
 ?Mathematical formulae have been encoded as MathML and are displayed in this HTML version using MathJax in order to improve their display. Uncheck the box to turn MathJax off. This feature requires Javascript. Click on a formula to zoom.
ABSTRACT
Water quality in Lagos's coastal area is prone to constant seawater intrusion due to its proximity to the Atlantic Ocean. Seawater intrusion in the coastal aquifer is a major challenge to human survival and therefore needs urgent attention due to deficiency in groundwater quality. This study applies integrated techniques to map groundwater suitability zone (GSZ) around the Lagos coastal area for sustainable development. The objectives were achieved by preparing eight different thematic layers that influence groundwater suitability viz; drainage density, geology, geomorphology, lineament density, rainfall, longitudinal conductance, slope, and transverse resistance. Weighting assignment, normalization and, pair-wise comparison of the thematic maps were done using Saaty’s Analytical Hierarchical Process (AHP) model before being integrated through the geographical information system (GIS) spatial analyst model with weight overlay to generate the overall groundwater suitability map. The integrated result reveals that 7% of the research location has very low suitability, 32.2% low, 47.8% moderate, and 13% high groundwater suitability. Thus, the groundwater suitability zone (GSZ) was validated via Electrical conductivity (EC) and total dissolved solids (TDS) and the result reveals a good correlation. The research has proven the efficacy of integrating different surface and subsurface data for effectively mapping the groundwater suitability zone (GSZ).
1. Introduction
Population increases in the coastal areas around the world, especially in the Lagos province coupled with increasing urbanisation and industrialisation have warranted greater demands for potable water supply for socio-economic development. Also, the demand for water has put more pressure on the coastal aquifer systems since it is the only source of water used for human consumption and other anthropogenic events in the metropolitan city of Lagos and the surface waters present are somewhat contaminated. Also, improper waste management from household sewages disposal and hazardous industrial chemical wastes have led to degradation in groundwater resources (Bachaer et al. Citation2018). More so, the coastal regions are prone to seawater intrusion (SWI) because the equilibrium of hydrostatic balance between the groundwater protective capacity and seawater interface has been broken. The main causes of seawater intrusion into freshwater are high demographic density. This is has a result of over-exploitation and intensive pumping (Bagyaraj et al. Citation2012). Also, high relief slope, topographical depression, precipitation, and high drainage density can increase surface runoff that infiltrates into the coastal aquifer (Demiroğlu and Dowd Citation2014). However, poor economic situation, inadequate infrastructural facilities from the government like pipe-borne water, and alternative water supplies have made people living around metropolis source for alternative water supply which is solely groundwater. A balance between human demands for water consumption and groundwater supply has not been attained for their sustainability. Also, the quantity and quality of groundwater have been changing due to the effect of anthropogenic activities coupled with natural geological influence (Chawla et al. Citation2010; Akintunde Citation2018).
Groundwater is found in the subsurface of the earth’s crust. It is void occupying water in rock cracks and pore space in sands. It serves as a reservoir for water storage and slowly moves within the geological formation of the subsurface litho-stratification. Groundwater occurrence at any place on the earth is due to consequential interaction of climate change, geological formation, hydrological and ecological factors (Scibeka et al. Citation2007). Soil porosity, topography, and permeability of the underlying lithologies are the dynamic factors controlling groundwater storativity and transmissivity. The study area lithologies are the constituent that forms the stratigraphy of various geomorphic units, porosity media, and permeability thereby causing some noticeable change in the groundwater potential (Surajit and Ramakar Citation2015). Hydro-geological parameters such as topographic slope, geological formation, lineament extraction, drainage network, rainfall, geomorphological structure, and geophysical surveys are factors that can be used in groundwater recharge investigation. Recently, geographic information systems (GIS) and remote sensing (RS) are valuable tools for spatial modelling of hydrogeological exploration of a large surface area with more dependability (Gyeltshen et al. Citation2020). GIS and RS are time-saving tools and economical ways of demarcating groundwater monitoring management. The multi-criteria decision model (MCDM) using the Analytical Hierarchical Process (AHP) technique has become an effective tool adopted by numerous researchers for an accurate description of groundwater suitability studies (Pinto et al. Citation2015; Fashae et al. Citation2014).
In recent times, researchers have used a different integrated approach to map and monitor groundwater in some parts of Lagos province (Adeoti et al. Citation2010; Oyedele and Oladele Citation2011; Aladejana et al. Citation2020). In some of these studies, saltwater intrusion has been identified in the first aquifer unit, such as Sangotedo, Ajah, Lakowe, Lekki, and Agboyi creek. The degradation of groundwater quality around the Oniru and Eputu-Lakowe environs may be due to the high infiltration of saltwater in the freshwater aquifer zone (Ozebo and Ajiroba Citation2011; Oyedele and Oladele Citation2011). (Anthony Citation2016; Adiat et al. Citation2012) have successfully combined geophysical methods and geospatial techniques using multi-criteria decision analysis to develop groundwater potential and water monitoring models. It is, therefore, necessary to identify and map potential areas around the Lagos coastal area for sustainable development. The present study focuses on applying an integrated approach to identify and map quality groundwater suitability zone (GSZ) around the Lagos lagoon metropolis using geospatial and geophysical techniques. These objectives will be achieved by preparing the thematic maps of contributing parameters such as drainage, lineament, geology, geomorphology, rainfall, and slope through the GIS environment. Also, a geophysical investigation was carried out to corroborate the results from the geospatial data. Then, Groundwater suitability zones (GSZ) map was generated for the study areas. Finally, the GSZ map was validated with the physico-chemical analysis of some collected groundwater samples.
2. Location, hydrology, and geology the study area
This study area falls within the Lagos coastal plain which is accessible through waterways within the metropolis. According to Badejo et al. (Citation2014), the Lagos Lagoon is very significant because it not only extends across the southern region of the metropolis but also serves as a linkage to the Atlantic Ocean especially along the western and southern as well as Lekki Lagoon in the eastern part of the lagoon. The study location lies between longitude and Latitude
as shown in . The proximity to the Atlantic Ocean and the variation in both seasonal and semi-diurnals are the main sources of salinity (Medina-Gómez et al. Citation2014; Mohamed et al. Citation2014). The weather season in Lagos varies significantly throughout the year, the wetter season lasts 6.8 months, from April to October while the drier season lasts for 5.2 months, from November to March (Adenodi Citation2018). The study area is characterised by a multi-aquifer system that consists of three major aquifer horizons differentiated by silty or clay layers. The first aquifer unit is the water table aquifer and is highly prone to pollution due to its closeness to the ground surface (Oyedele and Oladele Citation2011). The second aquifer unit is a confined aquifer that consists of discontinuous arrangements of sand and clay. These aquifer units are embedded within the continental Ilaro Formation and are harnessed through the borehole. Though some of this aquifer is slightly contaminated, and it is the most exploited (Adeoti et al. Citation2010; Olorode et al. Citation2016). The third aquifer consists of fine and medium sand and it is the most reliable aquifer used by industries and waterworks in Lagos metropolis. The groundwater in this aquifer exists as confined to the semi-confined aquifer (Longe et al. Citation1987).
Figure 1. Map of the study area showing borehole points, VES points and elevation (Nigeria Geological Survey Agency Citation2006 and Agagu 1985)
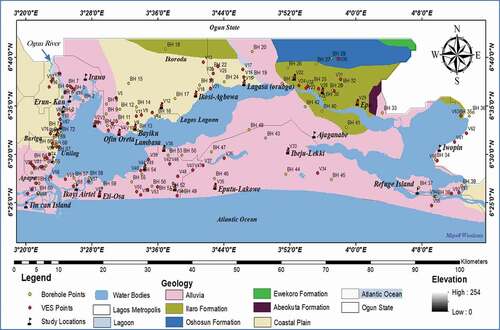
Figure 2. Average monthly rainfall data for the past 15 years (2005–2019) at the three stations
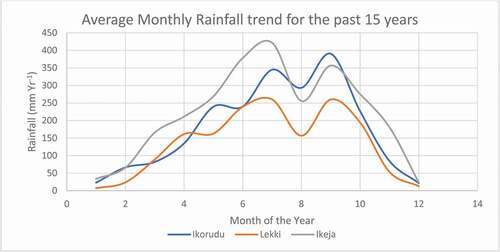
Figure 3. Frequency distribution for qualitative analyses of the VES curve types
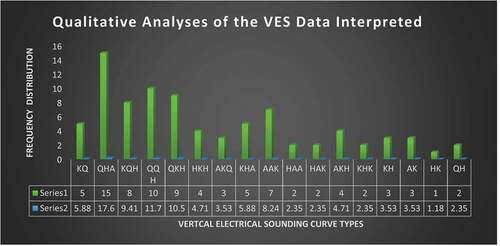
Figure 4. Drainage map of area around the Lagos Lagoon
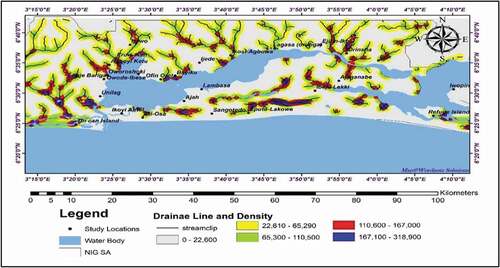
Figure 5. Lineament map and lineament density map of areas around the Lagos Lagoon
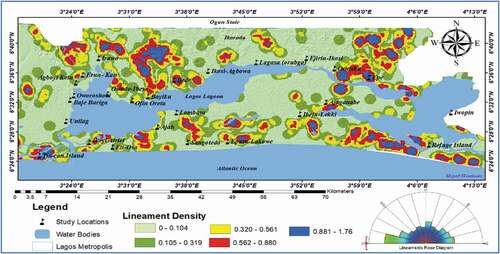
Figure 6. Geology map of area around the Lagos Lagoon
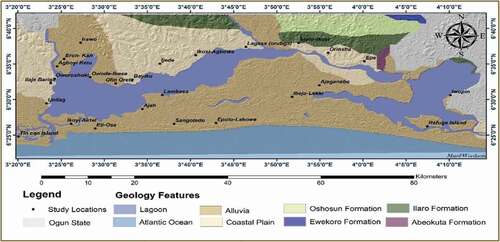
Figure 7. Geomorphology map of areas around the Lagos Lagoon
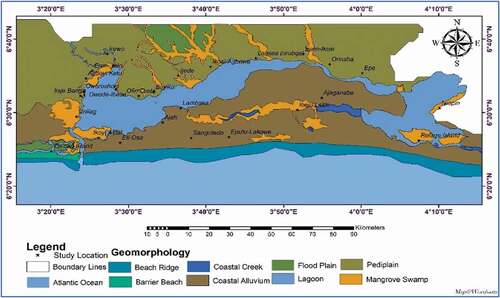
Figure 8. Slope map of areas around the Lagos lagoon
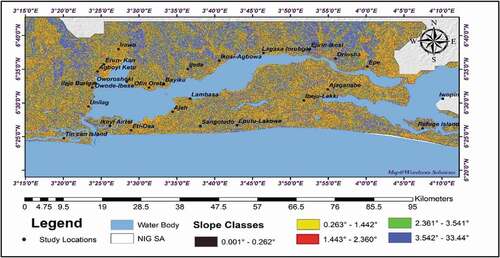
Figure 9. Mean annual rainfall map of areas around the Lagos lagoon
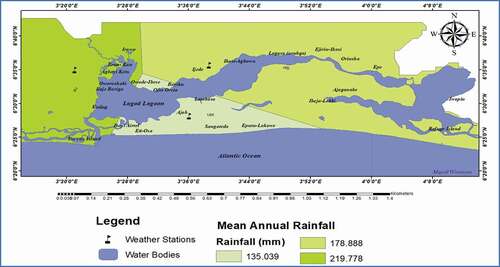
Figure 10. Representative inverted resistivity curve types of selected area around the Lagos Lagoon
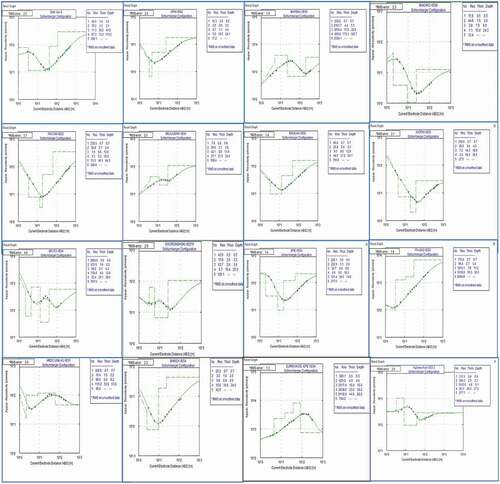
Figure 11. Transverse resistance map of areas around the Lagos Lagoon
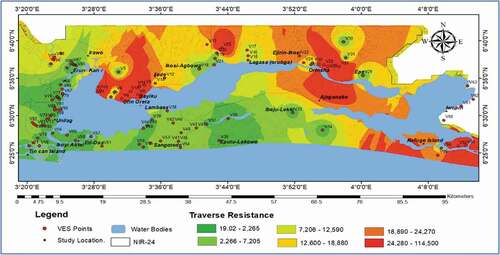
Figure 12. Longitudinal conductance map of area around the Lagos Lagoon
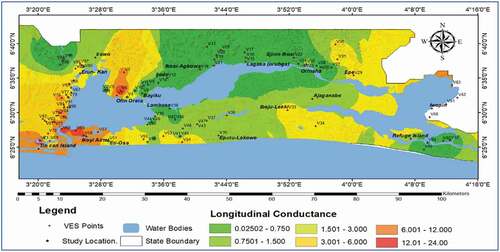
Figure 13. Groundwater suitability index map of area around the Lagos Lagoon
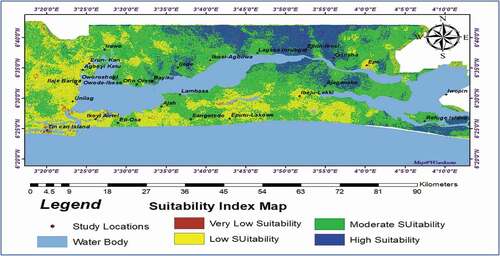
Figure 14. Electrical conductivity map of areas around the Lagos Lagoon
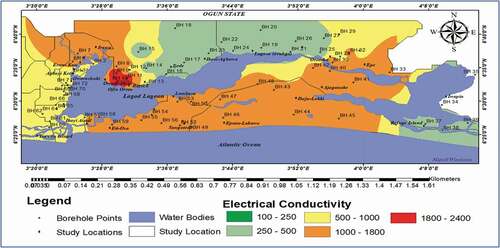
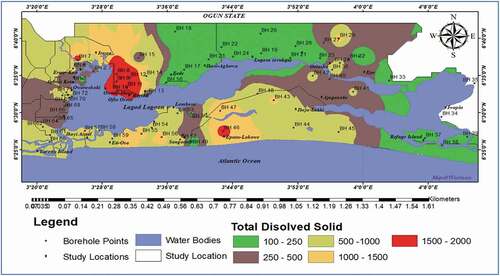
Figure 15. Total dissolve solid map of areas around the Lagos Lagoon
Dahomey represents one of the sedimentary basins that can be found at the Guinea Gulf continental boundary. The basin is a marginal pull part-system of the West African margin which erupted during the rifting era that separated the African and South American plates and subsequently create the Gulf of Guinea from the late Jurassic era to the early Cretaceous time (Burke et al. Citation1971; Whiteman Citation1982). However, Wilson and Willians (Citation1979) suggested that Dahomey is belted to the western part of Ghana escarpment that is essentially an adjunct of the Romanche fracture belt and bounded to the eastern part of the Benin Hinge line. Furthermore, the basement ridge that differentiates the Niger Delta Basin from the Okitipupa Structure and consequently became the Chain Fracture extension zone of the continent (Billman Citation1976). The stratigraphic column and the geology map of the study area are present in and , respectively (GAF et al. Citation2016 and Agagu, 1985). The major geological features of the study area are the Coastal Plain sand and Coastal Alluvium which belongs to the Quaternary to the Recent Formation with an alternating sequence of clay, clayey sand, pebbly sand, sandy clay, sand, lignite, and silt (Jones and Hockey Citation1964). While the minor geological units are the Ilaro formation, Ewekoro formation, Oshosun formation, and Abeokuta complex basin which are the shale, sandstone, limestone, marls gastropod, and siltstone (Omatsola and Adegoke Citation1981). High explorations of groundwater in the alluvia belt are proportional to the high rate of upward movement of saline water in this zone (Longe Citation2011).
Table 1. Eastern Dahomey basin stratigraphic units
3. Materials and methods
The method employed in this study is centred on three basic phases; Firstly, is the use geospatial approach to create thematic layers such as lithological layers, drainage patterns, lineament networks, hydrological cycle, and geomorphological data. Secondly, in-situ data using the geophysical electrical resistivity, digital image processing (DIP) from the remote sensing data were used for spatial classification of groundwater suitability zone (GSZ). In the third phase, a Multi-Criteria Decision Analysis (MCDA) approach based on the analytical hierarchical process (AHP) was used to integrate the multiple data set in an ArcGIS environment.
4. 3.1: Geo-spatial data acquisition
Drainage Network: The Shuttle Radar Topographic Mission Digital Elevation Model (STRM DEM) 30 m resolution (1 arc-second) data was acquired from USGS Earth Explorer. The topographic data was geo-referenced to UTM coordinate Systems in Minna Datum 32 N using a geographic information system (GIS). The Arc-Hydro tool of ArcMap employed involves a start from the sink fills up to the stream to feature function for extracting stream channels from the topographic map in . Researchers like (Prasad et al. Citation2008; Singh et al. Citation2013; Olorunfemi and Oni Citation2019) have successfully used the fill tools for different spatial analysis modules. The drainage network was used to indicate hydrological conditions. The density of the drainage network is restrained by its lithology and the precipitation infiltration rate of the subsurface runoff (Edet et al. Citation1998). The Drainage density is the total length of the drainage line via the sub-basin zone and was expressed in terms of km/km2. For the purpose of the research, a high drainage density zone is allocated with higher weight while a low drainage density zone is assigned with lower weight as presented in (Shaban et al. Citation2006). The drainage network is distinctively classified with a natural break (Jenks) into five categories as presented in .
Table 2. Categorisation of factors influencing of groundwater suitability zones
Lineament extraction: Lineament analysis shows the relationship between the surface water penetration and weathering zones that control the water mobility and infiltration rate (Recep Citation2019). The Landsat 8 (OLI_TIRS) enhanced thematic mapper (ETM+) sensor of path 190 and raw 055 and 056 acquired in May 2019 from USGS Earth Explorer was employed to extract the lineament pattern. The Landsat data reflectivity was enhancement via radiometric correction and the principal component analysis (PCA) using forward PC rotation in the ENVI 5.1 software. The automated lineament extraction was completed with the PCI Geomatica 2018 software using the LINE extraction tool from the algorithm librarian. The algorithm of the LINE extraction modular consists of edge detection, thresholding, and curve extraction, which were the three stages of extracting the Lineaments pattern. Rockwork 17 software was used to identify the bearing of the lineament lines using the rose diagram. The rose diagram tools are used to analyse lineament orientation and the directional frequency of the extracted lineament over the area. Layers of the lineament features were enhanced and improved using the panchromatic band of the ETM+ to increase details on the GIS model, especially layer grouping and classification. The lineament density was calculated by dividing the total lineament length by the cross-sectional area of the basin and its expressed in km/km2. The lineament density was classified into five categories as presented in with natural break (Jenks) intervals.
Geological structures: The geological map was geo-referenced, digitised, and classified from the 1: 50,000 toposheet 279 SW of the Nigeria Geological Survey Agency (NGSA) using ArcGIS Tools. More so, the geology of the study area was reclassified () by their influence on saltwater intrusion. The Abeokuta complex basin is given the magnitude of 5, the Ewekoro formation is given the magnitude of 4, the Ilaro and Oshosun formation were classed as 3 while the coastal plain and the coastal Alluvia were classified as 2 and 1 respectively ().
Hydro-geomorphological map: the geomorphology features are the topographic features that illustrate the various landform and landscapes of the study environment. The geomorphology map was extracted from the world geological map (One-Geology database, which is affiliated with the British Geological Survey (BGS)). The extracted data was geo-referenced using the ArcGIS referencing tool, then ratified into the tiff format for layer integration before being digitised for classification. Also, the geomorphology map was enhanced by different geomorphology features presented by (Allen Citation1965) and updated from the field survey. Weight was assigned to each geomorphological feature regarding their influence on saltwater intrusion (Offodile Citation2014). Features with higher influence were assigned the lowest value and vice versa ().
Slope and elevation: To determine the groundwater controlling factors, the slope map plays a significant role (Kadam et al. Citation2012). The research zone slope map was generated from the STRM DEM topographic map 30 m resolution (1 arc-second) data downloaded from USGS Earth Explorer and was processed with the ArcGis spatial tools. The slope was classified based on the SOTER model in the ArcGis environment and then reclassified into a close level, very gentle, somewhat gentle, somewhat steep, and highly steep as presented in (European Commission Citation1995). The lowest classes slope is ranked as five and one is given the highest step of the slope as presented in .
Rainfall: Rainfall is a vital factor that affects the hydrological cycle and represents a direct recharge source in groundwater. Rainfall data can be used to determine the quantity of water present in groundwater. Rainfall data were collected from the Nigerian Meteorological Agency (NIMET) stations in Lagos state. The annual rainfall data used covers from 2003 to 2017 and the average annual rainfall data for 15 years is plotted in . Rainfall distribution is affected by the slope gradient because it increases the infiltration rate of water runoff and groundwater rechargeability (Gyeltshen et al. Citation2020). The rainfall data were processed in the ArcGis platform using the Thiessen polygons tools to get the rainfall spatial distribution map. Researchers have used Thiessen polygon to analyse climate data when there are fewer weather stations in the state. The Thiessen polygon contains a single influential point input feature so that any location within the study area is closer to its associated point than to any other input point (Heywood et al. Citation1998).
4.1. Geophysical field survey
A geo-electrical resistivity method was employed to determine the physical parameters of the sub-surface lithology based on its apparent resistivity. A total of one hundred and ninety-seven (197) Vertical Electrical Sounding (VES) were conducted at Twenty-five locations around the study area using the Schlumberger arrangement with maximum current electrode spacing (AB/2) of 200 m at each point (). A period of four months (May to August 2019) was used in the acquisition of the geophysical data. The equipment used in acquiring data was Pasi Terameter (16-GL). The accessories were electrodes, hammers, tape measures, and Global Positioning System (GPS) for geo-referencing the study points. The measured apparent resistivity values were interpreted quantitatively and qualitatively using the partial curve matching technique and computer iterations (Win-Resist software) (Vander Velpen Citation2004). Out of the 197, VES stations sounded, 100 VES points were presented in showing the longitude, latitude, layer resistivities, and layer thickness of each station. Four to six subsurface geo-electrical layers were delineated from the interpreted VES. The distribution of their curve types is presented in . Due to the ambiguity in the interpretation of resistivity, and the similarities in geophysical subsurface lithology, the Dar Zarrouk parameter was employed.
Table 3. 100 vertical electric sounding results and the estimated Dar Zarrouk parameters
Geoelectrical parameter: The importance of using the Dar Zarrouk parameter is to solve the problem of overlapping character and reduce the uncertainty in the interpretation of the VES result (Henriet Citation1976; Batayneh Citation2013). The Dar Zarrouk parameters were used to determine the resistivity regime of the water-bearing formations or water bodies while dealing with complicated situations of resistivity ranges intermixing for saline, brackish, and freshwater aquifers. Dar Zarrouk parameters were used to identify the longitudinal conductance and transverse resistance from the VES data. In demarcating groundwater suitability, the transverse resistivity (Tr) and the Longitudinal conductance (Lc) were used in this study. Tr was used to identify target areas with good groundwater and is directly associated with groundwater transmissivity. Tr was obtained from the first order geoelectric parameters, which are the layer’s apparent resistivity and the thickness. EquationEquation 1(1)
(1) was used in calculating the transverse resistance (Tr) values with the layer’s resistivity and h the layer thickness for n-layers (Zohdy et al. Citation1974).
Also, the longitudinal conductance (Lc) value was obtained from the acquired VES results ( The Lc was estimated by using Equationequation 2
(2)
(2) .
The result from both Tr and Lc was interpolated with the spatial tools in the ArcGIS Platform using the inverse distance weight (IDW) interpolation scheme and their classification is presented in . Moreover, the map was classified according to its influence on groundwater quality. Areas with high Tr were given a high class and vice versa as presented in (). Finally, the calculated parameter of the longitudinal conductance (Lc) and transverse resistance (Tr) is presented in .
4.2. Analytical Hierarchy Process (AHP)
The AHP technique was used as a measurement for both subjective and objective evaluation of decision-makers, coupled with a provisional technique that checks and validates the consistency of the evaluated measurements. For this study, the eight contributing thematic parametric layers that influence groundwater suitability were ranked, then assigned weights by their importance. The AHP selects the likelihood of uncertainty in assignments via the principal Eigenvalue and the consistency index (Saaty Citation2004). A parameter weighted high was associated with the layer of high impact and the parameter weighted low was associated with a small groundwater impact. The weightage of each parameter and the pair-wise comparison was assigned based on standard Saaty’s scale 1–9 () of relative importance value, with each factor, scored in accordance to its relative influence (Saaty Citation1980). The Saaty’s scale of relative importance presented in show that each pair with a maximum difference is having one factor that is nine (9) times important than the other. The pair-wise comparison matrix for the selected groundwater parameter was developed by estimating the bulk value in every column in . The Sum of the columns was divided by every element in the matrix in other to normalise the matrix in . Also, in furtherance of validating the judgement consistency, the principal Eigenvalue was derived by multiplying the right matrix of the judgement by the normalised Eigenvector. The result of the pair-wise comparisons matrix (Weights, λmax) is summarised in . Then, the consistency index was evaluated using Equationequation 4(4)
(4) .
Table 4. Saaty’s 1–9 scale of relative importance (Saaty Citation1980)
Table 5. Pair wise comparison matrix of 7 criteria for the AHP process
Table 6. Determining the relative criterion weights
Where n is the number of factors (i.e. 8) and λ is the average eigenvalue of the consistency vector.
Also, the Consistency Ratio (CR) was used to measure the consistency of the pairwise matrix by using Equationequation 5(5)
(5) .
Where RI is the Ratio index calculated by Saaty (Citation2004), using . For the comparison value to be considered acceptable, the consistency ratio must be smaller than or equal to 0.1. This implies that the judgement is consistent, and the derived weights can be used. For this study, n is 8, and CR is 0.0835.
Table 7. Saaty’s ratio index for different values of n
4.3. Delineation of groundwater suitability zones
The groundwater suitability zones (GSZ) were delineated by the weighted linear combination (WLC) technique. (WLC) is a deterministic measure used to integrate non-parametric physical criteria in the ArcGIS module. The WLC was to calculate the groundwater suitability index by assigning weights of relative importance and then combine the standardised weights to design a suitability map. In order to generate a map that will portray a suitable area for potable water, all the contributing eight thematic parametric layers were integrated into the ArcGIS module and the overall weight of every map was computed using EquationEquation 6(6)
(6) :
Where w is the normalised weight and r is the influencing factor ratings. The weighted average was reclassified into five values to create a raster output file. A model builder was used to model all the influencing parameters. Each influencing parameter was represented with a band in the ArcGIS environment by using the normalised weights of each thematic layers. The vector thematic layer was transformed to raster thematic layers which later was reclassified for the optimisation of the integrated thematic map, then the groundwater suitability zone was estimated (). Moreso, the Groundwater Suitability Index Map was produce using the weight overlay model as presented in . The groundwater suitability index of the study area was classified into Very Low, Low, Moderate, and High suitability using the natural breaks classification method.
4.4. Validation of groundwater suitability zones
Finally, the GSZ model was validated with physicochemical data. Seventy-two (72) groundwater samples were collect sporadically within the study area with depths ranging from 28 to 87 m () to test for their electrical conductivity (EC) and total dissolved solids (TDS) concentrations. The water samples were taken to the chemistry laboratory for EC and TDS analysis using the American Public Health Association (APHA) (Citation2005) standard. Salinity in groundwater is associated with the amount of dissolved salt in water. When salt dissolves in water, their ions dissociate and increases the concentration of TDS and EC in groundwater (EPA. Citation2012). The statutory standard measures from World Health Organization (World Health Organization (WHO) Citation2018) and Nigerian standard for drinking water quality (NSDWQ Citation2015) for guidance on drinking water () were used to corroborate the result of the EC and TDS. The descriptive statistical result of the EC and TDS was presented in and the electrical conductivity (EC) and total dissolved solids (TDS) values were interpolated with inverse distance weight to produce the EC and TDS maps. Then, the EC and TDS maps were compared and correlated with the groundwater suitability map to validate the GSZ map, and to verify the effectiveness of the AHP method in demarcating GSZs in the study area. A very low electrical conductivity in groundwater is caused by the absence of impurities in groundwater. For groundwater to properly conduct electricity, there must be ions contained within it (EPA. Citation2012). Also, natural impacts like evaporation and rain, and human impacts which include agricultural runoff, road salt, and septic leachate) are factors that dictate the fluctuation of EC in groundwater (EPA. Citation2014).
Table 8. Descriptive statistical result of the physico-chemical analyses
5. Results and discussion
Drainage Network The estimated drainage density in the study area varies from 1 to 318,900 km/km2 and the drainage patterns are dendrites (i.e. a tree root-like). High drainage density will make the surface runoff high and lower the infiltration rate, while low drainage density zones indicate a high rate of infiltration and probably high recharge zones (Vasanthavigar et al. Citation2011; Shailesh et al. Citation2019). The contributing influence of drainage density is low, with an overall percentage of 12.5% as presented in . The drainage density map presented in , shows that lower density values are poor zones for groundwater accumulation while higher density value zone indicates good subsurface permeable materials and therefore enhances the rechargeability of groundwater
Lineament extraction: The analysed lineament result is presented in the lineament density map with some lineament lines in . Concentrated lineament density zone indicates high permeable and porous zones, which enhances groundwater accumulation (Fashae et al. Citation2014). The lineament networks are crisscrossed by minor to major lineaments lines varying in length. The lineament rose diagram has a bearing of with a population density of 2398 that covers a total polygon area of 68.69 Km2. The rose diagram reveals three noticeable directions (NW-SE, N-S, and NE-SW) but in different ranges. The dominant orientation of the lineament direction tends towards the NW-SE direction. The lineament density map is classified into five categories: very low to low (lineament density less than 0.104 km/Km2), moderate (0.320–0.562 km/km2), and high to very high (0.56 − 1.76 km/km2) as shown in . Zones with a higher value of lineament density are weighted with high value and vice versa. The orientations of the lineament lines are indicative of the preferential flow path (Khalil et al. Citation2014).
Geological structures: The ability of the subsurface media to transports and accumulates groundwater is built upon its geological structures, mineral content, and lithological texture (Salako et al. Citation2019). The major geological features of the study area are the Coastal Plain sand and Coastal Alluvia which belongs to the Quaternary to the Recent Formation that has an alternating sequence of sand, clay, lignite, and silt/clay (Jones and Hockey Citation1964). While the minor geological units are the Ilaro formation, Ewekoro formation, Oshosun formation, and Abeokuta complex basin which is the shale, sandstone, limestone, marls gastropod, and siltstone. High explorations of groundwater in the alluvia belt are proportional to the high rate of upward movement of saline water in this zone (Longe Citation2011). The geological map of the study area is presented in . The contributing influence of the geological structure has an overall percentage of 17.5% as presented in . More so, the geology of the study area was reclassified () by their influence on saltwater intrusion.
Hydro-geomorphological map: Geomorphology reflects the various structural behaviour, nomenclature processes of landforms and landscapes. Geomorphological features control the distribution of a surface water body and groundwater situation. The geomorphology of the research zone is categorised into coastal alluvium, beach ridge, mangrove swamp flats, pediplain, floodplain, a barrier beach complex, coastal creeks, and lagoons as shown in (Offodile Citation2014). The contributing influence of the geomorphology is given an overall percentage of 5 and the geomorphology features are classified and weighted according to their increasing significant influence on groundwater suitability as presented in . The southern zone of the study area is dominated by Barrier beach, beach ridge Mangrove swamp, and Alluvium plain which are lowland areas with low drainages and high infiltration rate while the Flood plain and pediplain are the higher land region with high drainages and low infiltration rate.
Slope and elevation: The slopes are terrain parameters that give a clue on the geologic nature and geodynamic process (Arulbalaji et al. Citation2019). It also expresses the steepness on which surface runoff and infiltration depend. The larger the slope, the smaller the recharge. This is because the flow of water is rapid down the steep slope during rainfall, thereby giving rise to low infiltration. The geospatial distribution of the slope steepness is presented in . Areas with a steep slope () are characterised by high runoff and low rainwater infiltration rate while, areas with a gentle slope (
) allow a high infiltration rate due to slow runoff and promote appreciable groundwater recharge. This implies that the slope steepness is inversely proportional to the infiltration of surface runoff as presented in .
Rainfall: Rainfall is one of the most influencing hydrological parameters that contribute to the groundwater recharge zone The average rainfall in the study location ranges from 135.039 to 219.778 mm. As presented in , the amount of rainfall decreases towards the shore while the slope gradient directly influences the infiltration rate of water runoff. The rainfall data were reclassified into three classes as presented in .
Geoelectric Resistivity Result: The iterated VES result of some selected areas around the Lagos Lagoon is presented in . The RMS errors were less than 4.6. The maximum and the minimum values at the study location are between 7469 Ωm northern zones and 1.1 Ωm at the southern zone respectively with a mean resistivity value of 469.79 m. The representative curve types () of the geoelectric layer signifies the alternating sequence of conductive to resistive layers of the subsurface and reflecting the unconsolidated nature of their lithologic composite and its decomposition characteristics. Seventeen curve types are obtained after plotting 197 partial curves. shows the frequency of the occurred curve types with QHA, QQH, and QKH having the highest frequency 17.65%, 11.76%, and 10.59% distribution respectively for the five-layer types and KQ and AK and KH are the four-layer curve types and the six-layer curve type is QHKQ.
For the study area, four to six geoelectric layers are delineated. The first layer is the topsoil having a resistivity value that varies from 0.8 to 8118 Ωm, with thicknesses between 0.4 and 1.6 m. The second layer is characterised as a shallow unconfined aquifer (Asseez Citation1972; Longe Citation2011; Oyedele Citation2019) due to litho-sequence of sand, sandy silt, and very low impermeable clay. The second layer has a resistivity value ranging from 1.2 to 3907.6 Ωm, with thicknesses between 0.3 and 8 m. Lower resistivity (<30 Ωm) is observed around Bariga, Agboyi, Irawo, Ibeju Lekki, Oworoshoki, and Makoko regions while high resistivity value (>500 Ωm) is observed at Bayiku, Agbowa, Ejirin, Tin-can, and Ajaganbe environments. The higher resistivity values demarcated free polluted aquifer zones and the lower resistivity value shows the aquifer contamination description (Oyedele Citation2019). Although, some of the low resistivities areas towards the northern zone of the study location are characterised as clay and peat (Ejirin ikosi, Epe, and Orinsha). The third geo-electric layer has resistivity values in the range of 0.8 to 4490.6 Ωm with a mean thickness of 20.45 m indicating the mixture of sand and lateritic clayey sand. The fourth geo-electric sequence is characterised as the confined coastal plain aquifer, separated by impermeable sandy clay to silty clay and clay (Oyedele Citation2019). The resistivities value varies from 1.1 to 7884.6 Ωm with a mean thickness of 51.2 m at an average depth of 72.8 m. (Longe et al. Citation1987) noted that the aquifer layer at this depth is a multi-layer system with three distinctive sub-zones. The fifth and sixth geoelectric layers were delineated with resistivity values ranging from 53.1 to 8118 Ωm with a signature of the basement complex aquifer zone (Coode et al. (Citation1996), Nton and Adeyemi Citation2014), although, the depth at this point could not be determine due to the termination of the current. Therefore, their depths and thicknesses at that point could not be determined. Most of the confined aquifer is located at the second to third strata of the subsurface and is dominant towards the north-eastern zone of the research location. The aquifer in this region shows high protective capacity as the thickness of clay in this region is high compared with the southwestern zone, which has low clay thickness.
Geoelectrical parameter: Environmental degradation such as surface water depletion and saltwater intrusion could be due to excessive abstraction of groundwater within the belt of the Lagos Lagoon and its proxy to the Atlantic Ocean. Furthermore, geoelectric parameters such as the longitudinal conductance, transverse resistance, thickness, and depth of the geological strata are essential in evaluating groundwater suitability. The result from Dar Zarrouk parameters was interpolated in the ArcGIS platform with the help of an inverse distance weight (IDW) module to generate the distributed spatial map. Also, the result of both Tr and Lc was presented in .
Transverse resistance: In this study, the transverse resistance values vary from 11.12 Ωm2 to 137,789 Ωm2 with a mean value of 13,419.78 Ωm2 (). However, Zohdy et al. (Citation1974), Suggest that an increase in Transverse resistance may be due to an increase in the resistive thickness of the subsurface. High transverse resistance (Tr) indicates regions with high aquifer transmissivity and porous media which can enhance the prospect contaminant flow into the groundwater (Tsepav et al. Citation2015; Senthikumar et al. Citation2019). Thus, the transverse resistance spatial distribution map of the research area is presented in . A high value of Tr is observed (>1000 Ωm2) at the northern and northwest zone around the lagoon shore, as well as a low value of Tr less than 500 Ωm2 is noticed at the eastern and southern zone.
Longitudinal conductance: The longitudinal conductance (Lc) values span between 0.025 and 25.54 mhos with an average value of 2.85 mhos (). The contrasting longitudinal conductance along the coastal belt is indicative of Atlantic marine sediments (Evans et al. Citation2017). Relatively, high longitudinal conductance values (above 10 mhos) are observed at Ilaje Bariga, Agboyi Ketu Owode-Ibese, and Erun-kan which scrutinise the presence of Brackish to saline water and clay to slit dominated regions (Ayolabi et al. Citation2013). The average value of Lc was observed around areas close to the lagoon. This could indicate the brackish to saline groundwater nature as presented in (Laouini et al. Citation2017). The low conductance values, noticed around the central north and south zones, could indicate the influence of the Ewekoro and Ilaro formation (Yusuf et al. Citation2018; Akinlalu and Afolabi Citation2018). The high value of Tr and low Lc around the central northern part of the research location reveals the existence of a coastal plain sand formation.
Groundwater Suitability Zone (GSZ): The GSZ, is a dimensionless model that can identify the suitability of the groundwater zone within the study area map by the assignment and normalising weight to each influencing thematic layer (). The groundwater suitability index map is classified into Very Low, Low, Moderate, and High suitability. The groundwater Suitability map shows that an excellent GSZ is concentrated around the central-western part (Ikosi–Agbowa, Lagasa, Ejirin–Ikosi Ajaganabe, and Ijede) of the study area due to the geological influence of Ilaro, Ewekoro, and the Oshosun formation with the high transverse resistance (Coode et al. Citation1996). In this research, 7% of research locations have very low suitability, 32.2% were low, 47.8% e moderate and 13% have high groundwater suitability. The transverse resistance and the geology feature play a very significant part in the suitability of groundwater in this research with an influencing capacity of 37.5%. The drainage density, lineament density, rainfall, and slope also help in the rechargeability of the aquifer, aquifer mobility rate, and the steepness in which surface runoff and the infiltration capability of the groundwater resources. The geomorphology and longitudinal conductance have a reasonable effect of 15% on the physical features of geological structures and the aquifer protective capacity of saltwater infiltration (Jaroslav and Balthazar Citation2011).
Groundwater Suitability Zones Validation: A validation assessment that demonstrates that the model is a reasonable representation of the actual aquifer system of the study area. In doing this, the groundwater suitability zone was validated with results obtained from the physicochemical analysis of groundwater. The descriptive statistical result of the EC and TDS is presented in . The EC and TDS results show different variations across the study area with a minimum value of (126 (µS/cm) and 113 (mg/l)) and maximum value of (2380 (µS/cm) and 2264 (mg/l)) respectively. The permissible limit of EC and TDS stipulated by World Health Organization (WHO) (Citation2018) and NSDWQ (Citation2015) are 1000 (µS/cm) and 500 (mg/l) respectively. The distribution maps of EC and TDS are presented in respectively. High EC and TDS are observed towards the southern zone and, the western north zone of the study location. The high EC and TDS might be due to the influence of the Ogun river at the western north and the proximity to the Atlantic Ocean in the south zone of the study location respectively. It was observed that low EC and TDS are situated around the central north-eastern zone (Ikosi–Agbowa, Lagasa, Ejirin–Ikosi Ajaganabe, Orinsha, and Epe), probably due to high altitude and presumably lower water table with lesser groundwater abstraction (UNICEF Citation2008; Oyem et al. Citation2014). Similarly, the low concentration EC and TDS within this location ascertained that the GSZ model implemented is reasonable and the observation from the geological and geomorphological analysis have been correctly verified. The existence of the Ilaro and Oshosun formation has a high protective capacity that produces a shield that protects the aquifer from saltwater intrusion (Ayolabi et al. Citation2013). The EC and TDS measure of groundwater around this zone (southern to the eastern) corroborate to an agreeable degree to the GSZ model. Though there is a trivial significant difference between the GSZ model and the EC /TDS, yet both maps agree to a large extent.
6. Conclusion and recommendation
Both the AHP and GIS approaches have been used to integrate different geophysical, hydrological, and remote sensing maps to produce groundwater suitability zone around the Lagos coastal area. The integrated groundwater suitability zone (GSZ) map was categorised by assigning normalised weights to different thematic maps. The AHP was used for the pairwise comparison matrix for the various thematic layers like geology, geomorphology, lineament density, drainage density, slope, rainfall, transverse resistance, and longitudinal conductance. The integrated groundwater suitability zone map of the research locations reveals that 7% of research locations have very low suitability, 32.2% were low, 47.8% e moderate and 13% have high groundwater suitability. Subsequently, EC and TDS maps generated from the 72-borehole samples were used to validate the groundwater suitability model and to check the quality of the water. The GSZ model corroborated with EC/TDS maps. The GSZ model shows that the northern zone of the study locations is a suitable area for groundwater exploration. The GSZ map will assist in the decision-making of the state to plan a sustainable groundwater monitoring scheme. Finally, the study has been used to establish the efficacy of integrating approach between, MCDA (AHP), GIS-based module, remote sensing, rainfall precipitation, and geophysical method in effectively mapping groundwater suitability zone for human consumption.
Disclosure statement
No potential conflict of interest was reported by the author(s).
References
- Adenodi RA. 2018. A centurial analysis of rainfall variability in Nigeria. Nigerian Journal of Technology (NIJOTECH). 37(2):543–547. doi:https://doi.org/10.4314/njt.v37i2.34.
- Adeoti L, Alile OM, Ughegbulam O. 2010. Geophysical investigation of saline water intrusion into freshwater aquifers: a case study of Oniru, Lagos State. Scientific Research and Essays. 5(3):248–259. (1992-2248).
- Adiat KAN, Nawawi MNM, Abdullah K. 2012. Assessing the accuracy of GIS-based elementary multi criteria decision analysis as a spatial prediction tool—a case of predicting potential zones of sustainable groundwater resources. J Hydrol. 440-441:75–89. doi:https://doi.org/10.1016/j.jhydrol.2012.03.028
- Agagu, OA. 1985. A geological guide to bituminous sediments in Southwestern Nigeria. Department of geology, University of Ibadan
- Akinlalu AA, Afolabi DO. 2018. Borehole depth determination to freshwater and well design using geophysical logs in coastal regions of Lagos, southwestern Nigeria. Applied Water Science. 8(6):152–169. doi:https://doi.org/10.1007/s13201-018-0798-3.
- Akintunde OA 2018. Hydro-geophysical analyses and estimation of aquifer hydraulic conductivity, overburden vulnerability and transmissivity at Ejinrin-Ijebu, Lagos. Presented at University of Lagos 13th Annual Research Conference and Fair. (163–171) Lagos, Nigeria.
- Aladejana JA, Robert M, Kalin RM, Sentenac P, Hassan I. 2020. Hydrostratigraphic characterisation of shallow coastal aquifers of Eastern Dahomey Basin, S/W Nigeria, using integrated hydrogeophysical approach; implication for saltwater intrusion. Geosciences. 10(2):65. doi:https://doi.org/10.3390/geosciences10020065.
- Allen JRL. 1965. A review of the origin and characteristics of recent alluvial sediments. J Int Assoc Sedimentology. 5(2):89–191. doi:https://doi.org/10.1111/j.1365-3091.1965.tb01561.x.
- American Public Health Association (APHA). 2005. Standard methods for the examination of water and wastewater. 21st. Washington (DC., USA): American Public Health Association/American Water Works Association.
- Anthony MK. 2016. Combining geophysical techniques and multi-criteria GIS-based application modelling approach for groundwater potential assessment in southwestern Nigeria. Environ Earth Sci. 75(16):1181–1201. doi:https://doi.org/10.1007/s12665-016-5897-6.
- Arulbalaji P, Padmalal D, Sreelash K. 2019. GIS and AHP techniques based delineation of groundwater potential zones: a case study from Southern Western Ghats, India. Sci Rep. 9(1):2082. doi:https://doi.org/10.1038/s41598-019-38567-x.
- Asseez LO. 1972. Hydrogeology of southwestern Nigeria. The Nigerian Engineers. 7(1):22–44.
- Ayolabi EA, Folorunso AF, Odukoya AM, Adeniran AE. 2013. Mapping saline water intrusion into the coastal aquifer with geophysical and geochemical techniques: the University of Lagos campus case (Nigeria). Springerplus. 2(1):433–449. doi:https://doi.org/10.1186/2193-1801-2-433.
- Bachaer A, Ikram J, Samir S, Salem B. 2018. The seawater intrusion assessment in coastal aquifers using GALDIT method and groundwater quality index: the Djeffara of medenine coastal aquifer (Southeastern Tunisia). Arabian Journal of Geosciences. 11(20):609. doi:https://doi.org/10.1007/s12517-018-3966-8.
- Badejo OT, Olaleye JB, Lademomi AS. 2014. Tidal characteristics and sounding datum variation in Lagos State. International Journal of Innovative Research and Studies. 3: 1–23. 2319-9725.
- Bagyaraj M, Ramkumar T, Venkatramanan S, Gurugnanam B. 2012. Application of remote sensing and GIS analysis for identifying groundwater potential zone in parts of Kodaikanal Taluk, South India. Frontiers of Earth Science. 7(1):65–75. doi:https://doi.org/10.1007/s11707-012-0347-6.
- Batayneh AT. 2013. The estimation and significance of Dar-Zarrouk parameters in the exploration of quality affecting the Gulf of Aqaba coastal aquifer systems. Journal of Coastal Conservation. 17(3):623–635. doi:https://doi.org/10.1007/s11852-013-0261-4.
- Billman HG 1976. Offshore stratigraphy and palentology of the Dahomey Embayment. Proceeding of the 7th Afican Micropaleontology Colloquium, Ile-Ife.
- Burke K, Dessauvagie TE, Whiteman A. 1971. Opening of the Gulf Of Guinea and geological history of the Benue depression and Niger-Delta. Nature, Phys Sci. 233(38):51–55. doi:https://doi.org/10.1038/physci233051a0.
- Chawla JK, Khepar SD, Sondhi SK, Yadav AK. 2010. Assessment if long-term groundwater behaviour in Pujab, India. Water Int. 35(1):63–77. doi:https://doi.org/10.1080/02508060903513502.
- Coode B, Oteri AU, Rofe KL (1996) Hydrogeological investigation of Lagos State. Final report, vol. I, II.
- Demiroğlu M, Dowd J. 2014. The utility of vulnerability maps and GIS in groundwater management: a case study. Turkish Journal of Earth Science. 23:80–90. doi:https://doi.org/10.3906/yer-1205-6
- Edet AE, Okereke CS, Teme SC, Esu EO. 1998. Application of remote-sensing data to groundwater exploration: a case study of the cross-river state, southeastern Nigeria. Hydrogeol J. 6(3):394–404. doi:https://doi.org/10.1007/s100400050162.
- EPA. 2012. Conductivity. In Water: Monitoring and Assessment. Retrieved from http://water.epa.gov/type/rsl/monitoring/vms59.cfm
- EPA. 2014. Sediments. In Water: Pollution Prevention & Control. Retrieved from http://water.epa.gov/polwaste/sediments
- European Commission (1995) Soil terrain database. Land management and natural hazards unit. IES and JRC, European Commission, Brussels. Available at http://eusoils.jrc.ec.europa.eu/projects/SOTER/Soter_Model.html. Accessed Dec 2016.
- Evans UF, Abdulsalam NN, Mallam A. 2017. Natural vulnerability estimate of groundwater resources in the coastal area of Ibaka community, using dar zarrouk geoelectrical parameters. J Geol Geophys. 6:295–303. doi:https://doi.org/10.4172/2381-8719.1000295
- Fashae OA, Tijani MN, Talabi AO, Adedeji OI. 2014. Delineation of groundwater potential zones in the crystalline basement terrain of SW-Nigeria: an integrated GIS and remote sensing approach. Applied Water Science. 4(1):19–38. doi:https://doi.org/10.1007/s13201-013-0127-9.
- GAF D, Kaki C, Adeoye JA. 2016. Benin and Western Nigeria Offshore basins: a stratigraphic nomenclature comparison. International Journal of Geosciences. 7(2):177–188. doi:https://doi.org/10.4236/ijg.2016.72014.
- Gyeltshen S, Tran TV, Gunda GKT, Kannaujiya S, Chatterjee RS, Champatiray PK. 2020. Groundwater potential zones using a combination of geospatial technology and geophysical approach: case study in Dehradun, India. Hydrological Science Journal. 65(2):169–182. doi:https://doi.org/10.1080/02626667.2019.1688334.
- Henriet JP. 1976. Direct application of Dar-Zarrouk parameters in ground water surveys. Geophysical Prospecting. 24(2):344–353. doi:https://doi.org/10.1111/j.1365-2478.1976.tb00931.x.
- Heywood I, Cornelius S, Carver S. 1998. An introduction to geographical information systems. New Jersey: Prentice Hall.
- Jaroslav V, Balthazar TV. 2011. Groundwater of emergency situations: a methodological guide. United Nations Educational, Scientific and Cultural Organization. 3:173–185.
- Jones HA, Hockey RD 1964. The geology of Part of South-Western Nigeria. Geological survey of Nigeria Bulletin No. 31, Geological Survey of Nigeria, Kaduna.
- Kadam AK, Kale SS, Pande NN, Pawar NJ, Sankhua RN. 2012. Identifying potential rainwater harvesting sites of a Semi-arid, Basaltic region of Western India, Using SCS-CN Method. Water Resour Manage. 26(9):2537–2554. doi:https://doi.org/10.1007/s11269-012-0031-3.
- Khalil M, Ahmed K, Elnahry A, Hasan A. 2014. Integrated geophysical, remote sensing and GIS studies for groundwater assessment, Abu Zenima Area, West Sinai, Egypt. International Journal of Geosciences. 5(9):882–907. doi:https://doi.org/10.4236/ijg.2014.59078.
- Laouini G, Etuk SE, Agbasi OE. 2017. Delineation of aquifers using Dar Zarrouk parameters in parts of Akwa Ibom, Niger Delta, Nigeria. Journal Hydrogeol Hydrol Eng. 6(1):18–42. doi:https://doi.org/10.4172/2325-9647.1000151.
- Longe EO. 2011. Groundwater resources potential in the coastal plain sands aquifers, Lagos, Nigeria Research. Journal of Environmental Earth Science. 3(1):1–7.
- Longe EO, Malomo S, Olorunniwo MA. 1987. Hydrogeology of Lagos Metropolis. Afr J Earth Sci. 6(2):163–174.
- Medina-Gómez I, Kjerfve B, Mariño I, Herrera-Silveira J. 2014. Sources of salinity variation in a coastal Lagoon in a Karst landscape. Estuaries and Coasts. 37(6):1329–1342. https://doi.org/10.1007/s12237-014-9774-9. Retrieved from http://www.jstor.org/stable/44851210
- Mohamed HK, Khalid SA, Alaa Eldin HE, Alaa NH. 2014. Integrated geophysical, remote sensing and GIS studies for groundwater assessment, Abu Zenima Area, West Sinai, Egypt. International Journal of Geosciences. 5(9):882–907. doi:https://doi.org/10.4236/ijg.2014.59078.
- Nigeria Geological Survey Agency (2006) Published by the authority of the federal Republic of Nigeria.
- NSDWQ. 2015. Nigerian standard for drinking water quality. Niger Ind Stand. 554:13–14.
- Nton ME, Adeyemi MO. 2014. Petrography, compositional characteristics and stable isotope geochemistry of the Ewekoro formation from Ibese Corehole, eastern Dahomey basin, southwestern Nigeria. Global Journal of Geological Sciences. 13(1):35–52. doi:https://doi.org/10.4314/gjgs.v13i1.5.
- Offodile ME (2014) Hydrology: groundwater study and development in Nigeria. ISBN:978-30956-4-1.
- Olorode DO, Adedayo AS, Akintunde AO. 2016. Application of geotechnical and geophysical methods to investigate tilt buildings at Lagos State, Nigeria. IOSR Journal of Applied Geology and Geophysics (IOSR-JAGG). 4(5):21–28. doi:https://doi.org/10.9790/0990-0405022128.
- Olorunfemi MO, Oni AG. 2019. Integrated geophysical methods and techniques for siting productive boreholes in basement complex terrain of Southwestern Nigeria. Ife Journal of Science. 21(1):013. doi:https://doi.org/10.4314/ijs.v21i1.2.
- Omatsola ME, Adegoke OS. 1981. Tectonic evolution and cretaceous stratigraphy of the Dahomey Basin. Journal of Mining and Geology. 18:130–137.
- Oyedele AA. 2019. Use of remote sensing and GIS techniques for groundwater exploration in the basement complex terrain of Ado-Ekiti, SW Nigeria. Applied Water Science. 9:51. doi:https://doi.org/10.1007/s13201-019-0917-9.
- Oyedele KF, Oladele S. 2011. Geoelectrical assessment of groundwater potential in the coastal aquifer of Lagos, Nigeria. Advances in the Research of Aquatic Environment. 2:29–36. doi:https://doi.org/10.1007/978-3-642-24076-8_4
- Oyem HH, Oyem IM, Ezeweali D. 2014. Temperature, pH, electrical conductivity, total dissolved solids and chemical oxygen demand of groundwater in Boji-Boji Agbor/Owa area and immediate suburbs. Research Journal of Environmental Sciences. 8(8):444–450. doi:https://doi.org/10.3923/rjes.2014.444.450.
- Ozebo VC, Ajiroba SO. 2011. Groundwater assessment in apapa coast-line area of Lagos using electrical resistivity method. Journal of Emerging Trends in Engineering and Applied Sciences (JETEAS). 2(4):673–679. (2141-7016).
- Pinto D, Shrestha S, Babel MS, Ninsawat S. 2015. Delineation of groundwater potential zones in the Comoro watershed, Timor Leste using GIS, remote sensing and analytic hierarchy process (AHP) technique. Applied Water Science. 7(1):503–519. doi:https://doi.org/10.1007/s13201-015-0270-6.
- Prasad RK, Mondal NC, Banerjee P, Nandakumar MV, Singh VS. 2008. Deciphering potential groundwater zone in hard rock through the application of GIS. Environ Geol. 55(3):467–475. doi:https://doi.org/10.1007/s00254-007-0992-3.
- Recep Ç. 2019. Evaluation of groundwater potential by GIS-based multicriteria decision making as a spatial prediction tool: case study in the tigris river Batman-Hasankeyf Sub-Basin, Turkey. Water. 11(12):2630. doi:https://doi.org/10.3390/w11122630.
- Saaty TL 1980. The analytic hierarchy process. McGraw-Hill, New York. reprinted by RWS Publications, 4922 Ellsworth Avenue, Pittsburgh, PA, 15213, 2000a.
- Saaty TL. 2004. Decision making the analytic hierarchy and network processes (AHP/ANP). Journal of Systems Science and Systems Engineering. 13(1):1–35. doi:https://doi.org/10.1007/s11518-006-0151-5.
- Salako AO, Osotuyi AG, Adepelumi AA. 2019. Seepage investigations of heterogeneous soils beneath some buildings using geophysical approaches: example from southwestern Nigeria. Geo-Engineering. 10(11):17–29. doi:https://doi.org/10.1186/s40703-019-0107-5.
- Scibeka J, Allena DM, Cannonb AJ, Whitfield PH. 2007. Groundwater-surface water interaction under scenarios of climate change using a high-resolution transient groundwater model. Journal of Hydrology. 333(2–4):165–181. doi:https://doi.org/10.1016/j.jhydrol.2006.08.005.
- Senthikumar S, Vinodh K, Johnson Babu G, Gowtham B, Arulprakasam V. 2019. Integrated seawater intrusion study of coastal region of Thiruvallur district, Tamil Nadu, South India. Applied Water Science. 9(5):124–144. doi:https://doi.org/10.1007/s13201-019-1005-x.
- Shaban A, Khawlie M, Abdallah C. 2006. Use of remote sensing and GIS to determine recharge potential zones: the case of Occidental Lebanon. Hydrogeol J. 14(4):433–443. doi:https://doi.org/10.1007/s10040-005-0437-6.
- Shailesh KS, Malte Z, Ude S, Griffiths GA. 2019. Potential groundwater recharge zones within New Zealand. Geoscience Frontiers. 10(3):1065–1072. doi:https://doi.org/10.1016/j.gsf.2018.05.018.
- Singh P, Thakur JK, Kumar S. 2013. Delineating groundwater potential zones in a hard-rock terrain using geospatial tools. Hydrol Sci J. 58(1):213–223. doi:https://doi.org/10.1080/02626667.2012.745644.
- SON 2006. Nigerian Industrial Standard for Potable Water developed by Standards Organisation of Nigeria and National Guidelines and Standards for Water Quality in Nigeria. ICS 13.060.20
- Surajit M, Ramakar J 2015. Identification of groundwater potential zones using remote sensing and gis in a mine area of Odisha, Odisha, India. National Conference on recent approach to water resource management. https://doi.org/10.13140/RG.2.1.3374.6644.
- Tsepav MT, Ibrahim SI, Bayegun FA. 2015. Geoelectrical characterization of aquifer precincts in parts of lapai, north central nigeria. journal of applied science and environmental. Management. 19(2):295–301. doi:https://doi.org/10.4314/jasem.v19i2.17.
- UNICEF. 2008. UNICEF handbook on water quality. New York (USA): United Nations Children’s Fund (UNICEF).
- Vander Velpen BPA (2004). Win RESIST Version 1.0. M. Sc Research Project. ITC, Deft (Netherlands).
- Vasanthavigar M, Srinivasamoorthy K, Vijayaragavan K, Gopinath S, Sarma S. 2011. Groundwater potential zoning in Thirumanimuttar sub-basin Tamilnadu, India (A GIS and remote sensing approach. Geo-Spatial Inf Sci. 14(1):17–26. doi:https://doi.org/10.1007/s11806-011-0422-2.
- Whiteman A (1982) Nigeria: its petroleum geology, resources and potential. Graham and Trotman, 394.
- Wilson RCC, Willians CA. 1979. Oceanic transform structures and the developments of Atlantic continental margin sedimentary basin a review. Journal of Geological Society of London. 136(3):311–320. doi:https://doi.org/10.1144/gsjgs.136.3.0311.
- World Health Organization (WHO). 2018. Guidelines for drinking water quality. First Addendum 3rd 1 491–493 Geneva.
- Yusuf MA, Abiye TA, Butler MJ, Ibrahim KO. 2018. Origin and residence time of shallow groundwater resources in Lagos coastal basin, south-west Nigeria: an isotopic approach. Heliyon. 4(11):e00932. doi:https://doi.org/10.1016/j.heliyon.2018.e00932.
- Zohdy AAR, Eaton GP, Mabey DR (1974) Application of surface geophysics to groundwater investigations, techniques water resources investigations of the US geological survey. Washington, 195–205.