
 ?Mathematical formulae have been encoded as MathML and are displayed in this HTML version using MathJax in order to improve their display. Uncheck the box to turn MathJax off. This feature requires Javascript. Click on a formula to zoom.
ABSTRACT
The Precambrian basement complex in southern Kebbi hosts various sulphuric and iron-oxide deposits which contain ore minerals associated with hydrothermal processes that occur within geologic structures. This study applied integrated geophysical approach to map and classify the structures and lithotypes of the basement complex so as to delineate geologic features that may support mineral prospecting. Airborne magnetic and radiometric datasets were enhanced through data reduction to display characteristics of surface and subsurface geology of the area. The derivative and analytic signal maps processed from the magnetic data highlighted major geologic structures such as the Zuru-Bini Yauri lineament and Anka lineament. The ternary map of the area displayed several metasedimentary and metavolcanic lithotypes bearing characteristics of potassium, thorium and uranium dominance. The Anka shear zone showed an elongated stretch of lineament trending NE-SW among other NNE-SSW, N-S, E-W trending shallow and deep-seated faults. Several shallow structures connected to the regional hydrothermal conduits within the alteration zone were delineated as potential auriferous-rich veins. The results of this study showed that the delineated Anka shear zone borders a plutonic region of brittle-ductile deformation inferring tectonic fracturing for fluid movement and related hydrothermal alteration deposits towards mineralisation in the area.
1. Introduction
The study area is situated in the southern stretch of Kebbi plain, northwestern Nigeria. It is within the Precambrian basement terrain that borders the Sokoto sector of the Iullemmeden Basin proposed to have high mineralisation potential (Ramadan and Abdel Fattah Citation2010). The area is bounded by latitude 10º 00′ and 11º 00′ N, and longitude 4º 30′ and 5º 00′ E. The region harbours some of the prominent schist belts in Nigeria which has been rarely mapped or subjected to detailed studies. The schist belts that promulgate along the western stretch of the country include Maru, Anka, Zuru, Zungeru, Kushaka, Ilesha and Iwo schist belts with the Zuru-Bini Yauri schist belt tailing in southern Kebbi, northwestern Nigeria. These schist belts are known to be generally associated with gold mineralisation (Obaje Citation2009).
The basement terrain is mostly grouped into three main lithostratigraphic units: viz., the gneiss-migmatite complex, the supra-crustal schist belts and the Pan-African granitoids (Ramadan and Abdel Fattah Citation2010). The gneiss-migmatite complex yielding Archaean and Early-Proterozoic isotopic ages possess generally an amphibolites facie grade of metamorphism (Fitches et al. Citation1985). They exhibit complex structural styles and are dominated by granitoid plutons which originated during Pan-African magmatism. The schist belts of late Proterozoic age were deposited and metamorphosed together with the basement gneiss-migmatite complex during the Pan-African event (Ramadan and Abdel Fattah Citation2010). The granitoids are mainly late-tectonic Pan-African intrusions of granites, granodiorites and diorites with some gabbros and syenites. They range in sizes from small sub-circular, cross-cutting stocks to large elongated concordant batholithic bodies emplaced into both gneiss-migmatite and supra-crustal rocks during or just after the main phase of Pan-African deformation (Wright et al. Citation1985).
Geophysical methods such as the electrical resistivity, seismic and potential field respond to differences in the physical properties of rocks. Over the area of prospect, survey can be done in the field to compute variations in a physical parameter associated with variations in a physical property of the subsurface (Dentith and Mudge Citation2014). The use of geophysical methods is an integral part in mineral exploration program because it can image the subsurface to provide information about concealed geology. The different geophysical methods help to distinguish rocks according to the physical properties of the geology they respond to. Magnetic method detects differences in the magnetic intensity of the rock by measuring variations in the magnetic field, whereas radiometric method detects variations in natural radioactivity from which the radioelement content of the rocks can be determined (Dentith and Mudge Citation2014).
Classification based on geophysical responses is useful in delineating mineralisation signatures within rock assembles of large expanses as studied by Akinlalu et al. (Citation2018), Oladunjoye et al. (Citation2016) and Oyeniyi et al. (Citation2016). Akinlalu et al. (Citation2018) applied the use of aeromagnetic data over the southern Ilesha schist belt with a view to assessing the subsurface structural settings that may favour mineralisation enrichment in the area. The studies suggested that the estimated depth of the deep-seated responses was the depth to the magnetic basement in the schist belt region. Furthermore, the shallow sources were inferred to be zones hosting mineralisation in the area (Garba Citation2002; Danbatta et al. Citation2009; Danjuma et al. Citation2019). Some previous studies have utilised geophysical tools comprising aeromagnetic and radiometric responses to map geological structures in a bid to prospect for minerals. This integrated approach is a formidable technique for probing the earth and revealing multiple clues to unearthing subsurface resources. Adepelumi and Falade (Citation2017) combined high-resolution aeromagnetic and radiometric data to map uranium mineralisation and the tectonic settings in northeastern Nigeria. The studies revealed that the study area was dissected by linear structures that trend ENE–WSW, NE–SW, E–W, NNE–SSW, WNW–ESE and NW–SE. It concluded that the survey area possibly contains deposits of uranium ore, which are likely to be found in the Bima Sandstones of Wade, Shinga, Bima hill, Wuyo, Teli, Bryel, Dali, Barkan, Gasi, Kunkun, Boragara, Deba and Gberundi localities. Wemegah et al. (Citation2015) integrated aeromagnetic and radiometric data sets to successfully map various geological units, delineate subsurface fracture zones and some hydrothermal alteration zones in Kyerano, South-Western Ghana which were inferred to be possible mineralised haloes.
In the study of the Zuru-Bini Yauri schist belt system, which is one of the largest multi-stage mesothermal gold deposits within the Precambrian basement complex of southern Kebbi (Garba Citation2003), results of geophysical data and possible interpretation for auriferous deposits are presented based on studies in Kebbi prospects of iron-oxides gold deposits using remote sensing (Ramadan and Abdel Fattah Citation2010). In general, this study presents the results of aeromagnetic and radiometric studies of the basement complex in southern Kebbi in order to (i) map the possible presence of geologic structures likely to accumulate mineral enrichment, (ii) delineate lithological boundaries that acted as channel for mineralised fluids and (iii) estimate the depth and lateral extent of suspected veins of mineral enrichment.
2. Regional and local geology
The Pan-African terrain of the Sokoto sector within the Iullemmeden Basin is part of the extensive Late Proterozoic-Early Phanerozoic terrain separating the West African craton and the Congo craton. (Grant et al. Citation1972). The Pan-African region and the West African craton were involved in collision-type orogeny, resulting in a subduction zone that dipped eastwards beneath the Pan-African region (Wright et al. Citation1985). Tectonic event including deformation and metamorphism occurred after continental collision about 660 Ma ago, resulting in crustal thickening in the Nigeria region (Ramadan and Abdel Fattah Citation2010). The basin within northwestern Nigeria consist predominantly of sandstone, ironstone, laterites and clay materials () forming a gentle undulating plain with an average elevation wavering from 250 to 3000 m above mean level. This monotonous plain is occasionally interrupted by steep side, flat-topped hills with the Dange escarpment appearing as the most prominent feature in the basin. The eastern area of the escarpment consists predominantly of a gentle undulating sandy plain which extend southwestwards to the basement complex (Kogbe Citation1979).
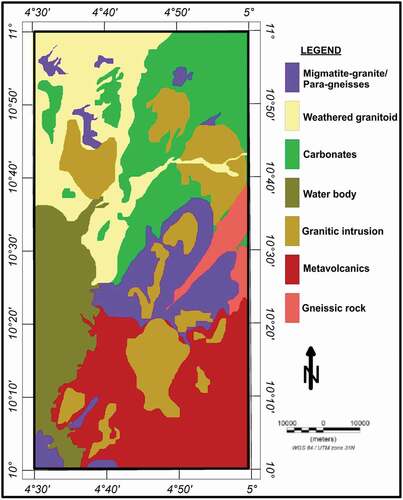
Figure 1. Geological map of southern Kebbi
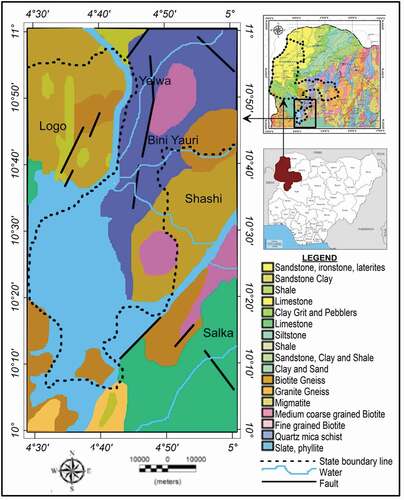
The sedimentary series exposed in the Iullemmeden Basin consist mainly of Eocene-Pliocene Continental Terminal and Quaternary formations (Aisabokhae and Oresajo Citation2018). The Continental Terminal series which consist of marine and continental sediments host considerable amounts of phosphate-bearing lignite coal and iron-ore formation (Kogbe Citation1979). The Precambrian basement formations outcrop consists mainly of Birmian volcano-sediments and Proterozoic intrusive formations. The volcano-sediments and intrusive rocks have shown a metallogenic interest for the exploration of various mineral resources.
2.1. Precambrian basement complex: geology, structures and mineralisation
The structural disposition of the area is that of a highly strained zone which resulted in the deformation and foliation of the country rocks. The tectonic fabric dominating the basement complex area is the Bini Yauri reverse fault; an N–S steeply dipping phyllitic-to-slaty cleavage which is primarily axial planar to tight isoclinal fold structure in addition a number of NW–SE striking faults, spatially associated with alteration and mineralisation, transverse the central part of the complex (Aisabokhae and Oresajo Citation2019). Folding had occurred during two successive deformation regimes resulting in isoclinal folds and cleavage and kink band imposition during early primary foliations, some of which were inscribed around plutons, and presently inferred as being products of forceful magmatic emplacement. The major shear zones in the area have been established to exhibit dextral displacement (Ramadan and Abdel Fattah Citation2010). They trend mostly in the NE–SW direction and tend to displace earlier structures in the order of a few kilometres. Artisanal pits said to have accumulated gold-hosted quartz veins are associated with the Bini Yauri transcurrent fault system (Garba Citation2000). These dextral and sinisterly complex systems (Ramadan and Abdel Fattah Citation2010) are as a result of late Pan-African brittle deformation that occurred after about 530 Ma on a continental scale (Ball Citation1980).
3. Materials and methods
3.1. Magnetic data processing
Aeromagnetic data (sheets 118 and 139) acquired using an aircraft bearing the 3x Scrintex C53 caesium vapour magnetometer and subsequently, processed by Fugro Airborne Surveys in 2009, were obtained from the Nigerian Geological Survey Agency (NGSA). In order to achieve a higher resolution of anomalies than the conventional output, the recording of the magnetic data was at 0.1 s intervals with a mean terrain clearance of 80 m. The flight line spacing and tie line spacing were 500 m and 5000 m, respectively, while the tie line trend was maintained in the NE–SW direction. The processed airborne magnetic field intensity was enhanced by deducting the International Geomagnetic Reference Field (IGRF) over the area (Nigerian Geological Survey Agency Citation2009). Geosoft Oasis montaj version 6.4.2 software was used to process the magnetic intensity data. Other computer packages used for data analysis and integration include Surfer 13 and ArcGIS version 10.2.
The reduction of the aeromagnetic data began with the application of upward continuation filter on the data to a height of 100 m. This filter helps to transform measured data on a given plane to data measured on a higher datum. The reduction was performed in order to eliminate near-surface noise over the area that may have affected the signal during data acquisition. Other data enhancement techniques applied to the data include reduction to the equator (RTE), residualisation, first vertical derivative (FVD), analytic signal and Euler deconvolution to enhance the structural structure of the magnetic anomaly map. Magnetic inclination and declination is dictated by geographic location. Therefore, latitude can have a significant effect on magnetic anomalies. The study area is located at a low latitude (10º N) region where its magnetic inclination can affect the shape of a magnetic anomaly because only the magnetic anomaly over a body at either north or south poles, or at the equator is believed to be located directly above the causative body. With the study area being slightly above the equator, it is necessary that the magnetic data is reduced to the equator to reposition it as being directly over the causative body. The RTE was performed to remove magnetic inclination effect and reduce ambiguity usually associated with subsurface magnetic signatures. In carrying out this operation, the data was assumed to have on inclination, I, of 1.622° and a declination, D, of −0.699° using the International Geomagnetic Reference Field (IGRF), epoch 31 May 2007.
Residualisation is achieved when the regional anomaly is extracted from the total magnetic field. Regional–residual anomaly separation was carried out on the magnetic data through upward continuation to a height of 1000 m in order to remove the signal associated with the deep-seated sources, thus preserving shallow responses which are required for mineral prospecting. Euler deconvolution is a commonly used semi-automated depth–to–source method applied for quick analysis of a large number of responses in magnetic data sets in order to determine depth and location of geological units or structures that produce magnetic anomaly (Akinlalu et al. Citation2018). The Euler standard method is based on anomaly gradients for selected geometry and is sequentially applied to all points along the anomaly profile. Euler’s equation represents the strength (f) of the potential field at a point (x, y, z) in space due to a source located at (xo, yo, zo) in terms of the first-order derivative of the field represented as
In EquationEquation 1(1)
(1) , B is the regional component. The structural index (N) indicates the rate of decrease in the amplitude of the responses with distance from the source, such that N value exists between 0 and 3 in increments of 0.5. FVD portrays the variation of an anomaly with height. It can be calculated either in the time or frequency domain to help emphasise shallower anomalies and suppress regional responses. The filter was used to delineate contact edges of source bodies at depth because of its ability to enhance linear features such as fractures, faults and shear zones. Analytic signal (AS) accentuates the variation in magnetisation of the magnetic sources and highlights variation in anomaly texture. Its form over a causative body depends on the location of the body but not on its magnetisation direction. The AS filter was applied in detecting causative body location and for geological boundary edge detection. In estimating the mean depths for shallow and deep structures, power spectrum tool was used to generate a radially averaged power spectrum profile of the area for depth calculation. Lineament extraction was performed on the derivative map using the manual lineament extraction tool in PCI-Geomatica platform. In performing the lineament extraction manually, the knowledge and experience of the user is key in delineating contact edges that have been accentuated by the computer program.
3.2. Radiometric data processing
The radiometric data obtained from Nigerian Geological Survey Agency (NGSA) comprising uranium (U), thorium (Th) and potassium (K) concentration maps over the study area (Sheet 118 and 139) were repositioned to WGS 84, UTM 31°N using the Geosoft Oasis montaj software. Image enhancing techniques such as composite image, ratio maps and ternary image were produced to recognise and understand radiometric signatures associated with host rocks important to mineralisation (Wemegah et al. Citation2015) enrichment. The composite image in red–green–blue (RGB) colour model was created using Geosoft Oasis montaj software for which K, Th and U were assigned to red, green and blue, respectively. Airborne radiometric survey reflects the geochemical variation of K, Th and U radionuclides within the Earth’s near surface (Dickson and Scott Citation1997). K/Th/U radiometric prospecting relies on the variable radioelement content of rocks for direct interpretation of lithology (El-Sadek and Mousa Citation2010; Kumwenda and Lackie Citation2019). The gamma-ray measurements of some rock samples using the procedures prescribed by Dickson and Scott (Citation1997) are presented in .
Table 1. Radioelement contents of some rock types and minerals (extracted from Dickson and Scott Citation1997; International Atomic Energy Agency (IAEA) Citation2003; Dentith and Mudge Citation2014)
4. Results
4.1. Derivative maps and geological structures
The process of delineating geological structures to accentuate structural complexity begins with gridding of the total magnetic intensity (TMI) map (). The TMI map which shows the strength of the earth’s magnetic field is a combination of both the regional field and the residual magnetic field intensity. A first-step reduction known as RTE was performed on the magnetic data so as to locate the magnetic anomalies above their source bodies and therefore reduce ambiguity during interpretation (). The similarity in both the TMI and RTE maps may be due to the low angle of inclination of the area. The RMI data () obtained is usually the main target for shallow effect observation and is prominently useful in mineral exploration. The RMI values ranged from −107.13 to 62.96 nT in the entire study area. Areas of high amplitude notably in the northeast, central and southeastern parts recorded intensity values ranging from 13.89 to 62.96 nT, whereas areas of low amplitude mainly around the northwest and southern parts recorded intensity values ranging from −107.13 to 7.57 nT. Areas of high amplitude were interpreted to be basement terrains dominated by basic rocks which contain ferromagnetic materials (Olurin Citation2017). Analytic signal () simplifies responses and is effective for delineating geological boundaries and resolving closely spaced bodies because the filter is effective in analysing data from equatorial regions where the spatial resolution of TMI responses are limited (Dentith and Mudge Citation2014).
Figure 2. Total magnetic intensity map
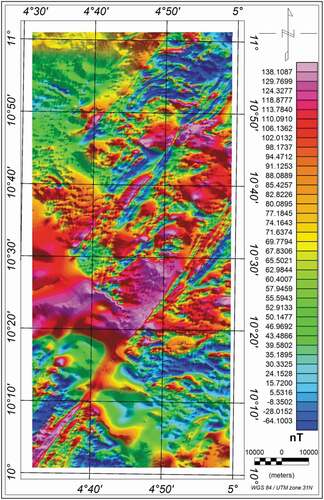
Figure 3. Reduced to equator magnetic map
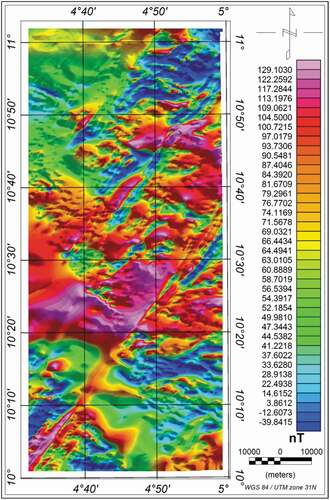
Figure 4. Residual magnetic (intensity) map
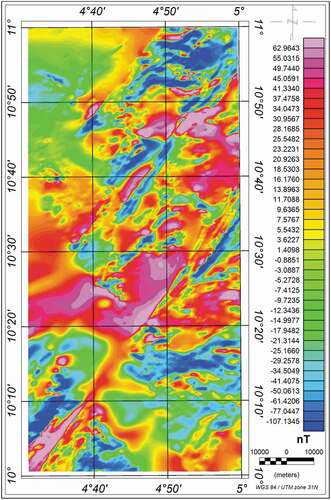
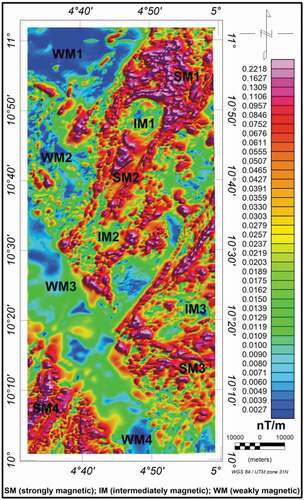
Figure 5. Analytic signal magnetic map
Derivatives of magnetic fields are much more sensitive (than the measured TMI) to changes in the physical properties of the subsurface, so they act as detail-enhancement filters (Dentith and Mudge Citation2014). Derivatives emphasise shallow features in preference to deep-seated broader bodies which produce small changes in the field’s vertical gradients and are very sensitive to the edges of bodies (). As such they serve as edge detectors and help in delineating discontinuity of responses which may indicate geological features like lineaments and shear zones (). A large number of faults and fractures have been identified and mapped by using FVD technique. The FVD map revealed areas with values ranging from 0.0088 to 0.1155 nT/m characterised by long wavelength signatures which depicts responses from deep causative sources. These features are expressed in the northwestern area and also along a W–S trending channel in the area. Areas with values ranging from −0.16 to 0.0065 nT/m characterised by short wavelength signatures are expressed in the northwestern, central and southwestern parts of the study area. These areas signify shallow causative bodies and are characterised by intense faulting and fracturing.
Figure 6. First vertical derivative magnetic map
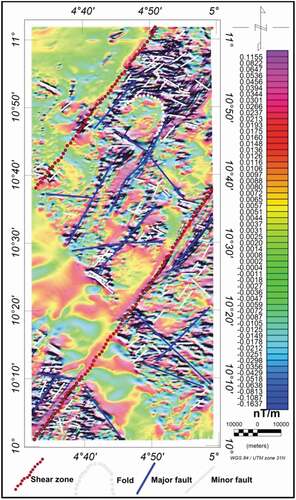
Figure 7. Structural map derived from magnetic interpretation
The large contribution obtained from the upper region of a causative body to the magnetic responses above the ground surface indicates that the data are sensitive to the top of the source (Oyeniyi et al. Citation2016; Akinlalu et al. Citation2018). It is necessary to make an estimate of the depth source of an anomaly by applying modelling techniques which best fits the entire profile. The Euler map is presented in showing variation in source depths and geometries.
Figure 8. Euler solutions map
4.2. Radioelement concentration mapping
Gamma-ray measurements of rock samples can serve as standard reference guides for identifying and mapping similar rock types during radiometric survey (IAEA, Citation2003). As such, geological maps may be created by assigning regions with similar radioelement enrichment to pseudo-geological units. Radiometric responses ultimately depend on the presence of mineral species that concentrate one or more of the K, Th and/or U radioelement (Dentith and Mudge Citation2014).
In the studies, radioelement concentration measurements consisting of potassium (), thorium () and uranium () were used to characterise inferred geological constituents based on the radioelement enrichment/depletion in surface rocks. The variation in radioelement concentrations may indicate primary geological processes such as the action of the mineralisation solutions or metamorphic processes and secondary processes such as supergene alteration and leaching. The individual radioelement concentrations display the absolute contribution of the radionuclide, whereas their ratio shows relative concentration in a dataset like the K/Th concentration map () which displays the relative abundance of K over Th. The absolute abundances of the three radioelements for surface rocks in the form of a ternary image are shown in . Areas displayed in white showed high concentration of all the three radioelements and usually constitute of highly radioactive rocks, whereas the dark portions showed low concentration of the K/Th/U radioelements and mostly constitute of weakly radioactive rocks (Dentith and Mudge Citation2014). Darkened portions are likely to depict carbonates or clay formations due to low radioactivity (Aisabokhae and Osazuwa Citation2021). shows the inferred geological rock units interpreted from the ternary image of the area.
Figure 9. Potassium concentration map
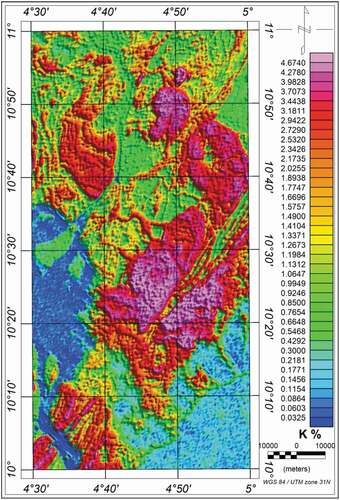
Figure 10. Thorium concentration map
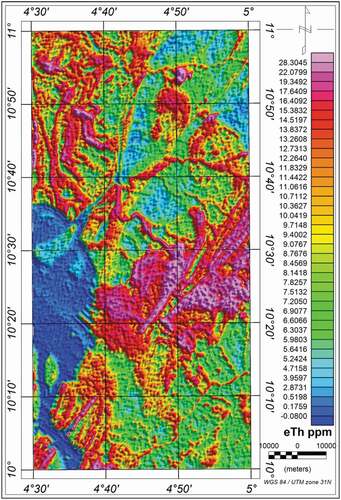
Figure 11. Uranium concentration map
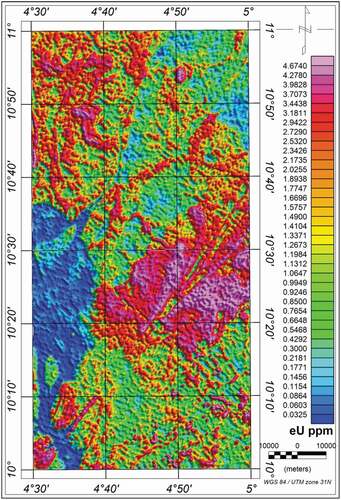
Figure 12. Potassium-to-thorium ratio map
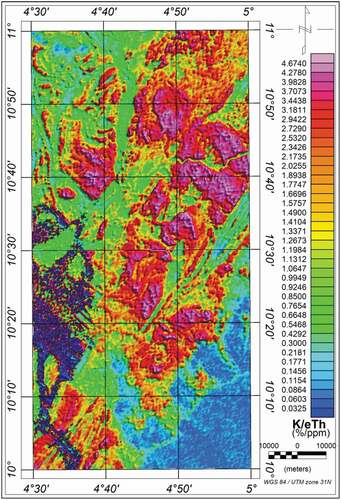
Figure 13. Ternary map
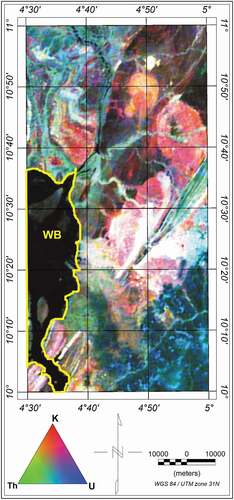
Figure 14. Radiolithic map
5. Discussion
5.1. Magnetic response of the basement complex
The magnetic responses of various types of mineralisation are such that anomalous magnetism of the mineralisation itself, the alteration zone and the host lithologies are usually the point of focus during magnetic exploration. The areas of weakly magnetic (WM) signatures () in the study area are likely to be metal oxides or sulphide minerals which are mostly known to be weakly magnetic (Dentith and Mudge Citation2014; Oyeniyi et al. Citation2016; Balogun Citation2019). Areas of high magnetic intensity marked as strongly magnetic (SM) zones, and of recorded values of between 0.0555 and 0.2218 nT/m (), are likely to contain massive magnetite such as magnetic–bearing scarns. Other materials with strong magnetism include oxide species and base metal sulphides, whereas weakly magnetised lithotypes include felsic and intermediate igneous rocks (Dentith and Mudge Citation2014). The analytic signal map suggests that a magnetic halo (SM1) exists possibly due to magnetite created by contact metamorphism. Also, an extensive batholithic body with a subdued magnetic response is seen (WM1). Stocks are also evident within (WM2 and WM4) the study area as well as an inferred gabbro intrusion (SM2) exhibiting a dominant magnetic fabric. Metasediments, which are mostly weakly magnetised (Dentith and Mudge Citation2014), are presumed to constitute the W–SE trending channel (WM3–WM4) in .
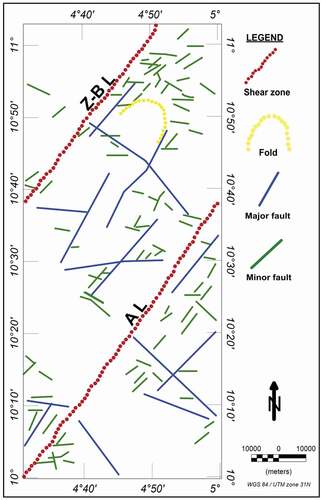
Structures such as faults and shear zones are important targets in mineral exploration because of their association with mineral deposits (Assran et al. Citation2019). They are usually designated as offsets and truncations to stratigraphic anomalies, and may appear as zones of reduced magnetism due to the destruction of magnetite especially by hydrothermal processes and weathering. However, in rare cases, magnetite may be accumulated more in structures such as faults and shear zones than in the surrounding rocks, thereby exhibiting linear positive responses (Gao et al. Citation2021). Two major regional lineaments are evident in the observed deformation zone. This major deformation zone has a complex history of reactivation (Ramadan and Abdel Fattah Citation2010). It is easily recognised from the associated linear zone of higher magnetic response (SM1) and the truncation of discordant anomaly trends caused by the granitoid intrusion (IM1) () which caused a fold structure () in the area. The regional lineaments are the Zuru-Bini Yauri lineament (Z-BL) and the Anka lineament (AL) (). The lineament map displayed several N–S, E–W, NE–SW and NW–SE trending faults including a fold in the northeastern flank. Majority of the structures appear to be domiciled within the area characterised by short wavelength signatures. A large number of the delineated minor faults appear to aggregate around the shear zone, suggesting a domain of major deformation. High lineament density occurs in the northeastern, central and southwestern regions which are domains of older granites, migmatite and gneissic rocks. The high-magnitude (regional) lineaments may be described as deep-seated structures, whereas the low-magnitude (local) faults may be described as shallow structures within shallow causative bodies or weathered zones.
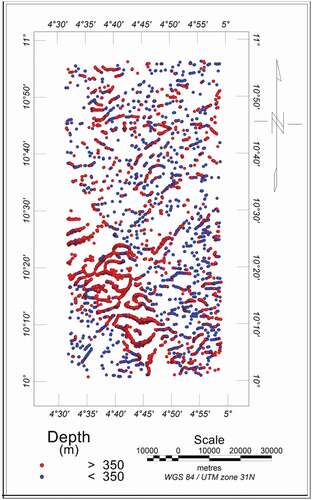
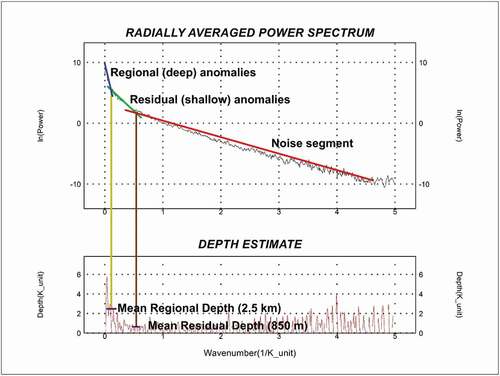
The Zuru-Bini Yauri shear zone is a major structure extending for hundreds of kilometres and is one of the several high–strain zones in the northern part of the area, whereas the Anka shear zone is a system of several closely spaced faults within the central area. It trends east–southwest and cuts across a weakly magnetised region composed of metasediments and metasedimentary rocks. Several regional and local faults are clustered around the two major shear zones, and they are likely to serve as traps for mineral constituents that may emanate from the cooling of hydrothermal fluids being transported into them. The depth of some geologic structures estimated from Euler solution () displayed two classes of probable depths with varying lateral configurations. Shallow structures less than 350 m deep are displayed in blue, whereas deep-seated structures greater than 350 m are displayed in red. The delineated structures trended in predominantly NE–SW, E–W, NW–SE orientation. The deep-seated structures appear to cluster in the form of dykes in an area previously interpreted as characterised by long-wavelength signatures, whereas areas interpreted as characterised by short-wavelength signatures showed mostly linear and curvilinear faults/fractures with estimated depth below 350 m. It is observable that several shallow structures are extensions of some deep-seated structures suggestive of a possible transmission channel for crustal hydrothermal fluids into near-surface faults. This possibility enables such shallow geological structures to be suitable targets for the search of near-surface mineralised veins. The power spectrum curve () shows that the shallow magnetic component is between 0.25 and 1.25 cycles/grid unit, whereas the deep component ranges from 0.01 to 0.25 cycles/grid unit. The slope of the line fitted to the low-frequency part of the spectrum was used to calculate the mean depth of the deep sources which was estimated as 2.5 km, whereas the slope of the second line fitted to the high-frequency part of the spectrum was used to calculate the mean depth of the shallow sources estimated as 0.85 km.
Figure 15. Depth profile of the area
5.2. Radiolithic classification of surface rocks
As observed in the potassium-to-thorium ratio map (), broader areas of higher potassium-to-thorium ratio coincide with the main zone of subdued magnetic responses. In areas where granitoids intrude the succession, the resulting lithology is clearly seen because these emplacements are very rich in potassium and thus show a distinct red appearance (). In the lower western stretch of the study area (WB), there is a subdued radiometric response possibly depictive of sediments deposited by water courses (). Banded iron formation normally has very low radioelement concentrations. However, they can show thorium enrichment because thorium when liberated by weathering becomes concentrated in iron oxides. An example is gneissic rocks which appear greenish in the ternary image (). Areas of whitish appearance as seen on the ternary image correspond to zones of high K, Th and U concentrations which are most likely migmatite-granite para-gneissic plutons (Dentith and Mudge Citation2014). K/Th/U enrichment accumulates around fault structures which may be indicative of hydrothermal alteration.
5.3. Mineralisation potential and implication
In combination with magnetic responses, radiometric data can give leads to zones of mineral enrichment in an area (Wemegah et al. Citation2015; Adepelumi and Falade Citation2017). In addition to direct detection of highly radioactive U mineralisation in the U–concentration data, radiometric surveys have been widely used to identify terrain areas with anomalously high U/K and U/Th ratios which may be targeted for follow-up exploration (Dentith and Mudge Citation2014). Hydrothermal alteration is a major potential source of radiometric response and for the alteration zone to be detected it must be large enough having a width of about 1 km or more. The magnetic response of alteration zones reveals a process that creates or destroys magnetic minerals as a primary cause of changes in rock magnetism, especially for ferromagnetic minerals (Aisabokhae and Oresajo Citation2019).
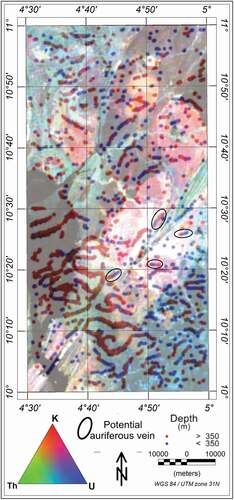
Gold mineralisation commonly occurs in quartz veins in mesothermal-type deposits (Elkhateeb and Abdellatif Citation2018). The primary host rock for veined deposits include fine-grained tremolite schists, mica schists and amphibolites schist which form part of the metasediments in the survey area () and several variety of gneisses (). Areas where these lithotypes are severally intercepted by high-complexity lineaments and/or low-angle faults indicate high prospects for gold mineral enrichment (Wemegah et al. Citation2015). Also, probable gold veins can be prospected for within migmatite/para-gneisses K-rich lithologies that host deep-to-shallow connecting faults in the vicinity of major transcurrent lineaments ().
Figure 16. Geophysical classification map
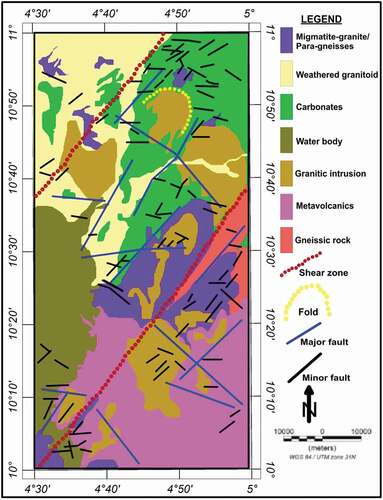
Figure 17. Euler solutions superimposed on ternary image
6. Conclusions
In classifying the basement complex of southern Kebbi, the geophysical responses from aeromagnetic and radiometric surveys were used to characterise the lithotypes of the area. For the studied area, both near-surface and deep subsurface geophysical signatures that best described the basement rocks of the area were presented. The results from the geophysical techniques allows for the following conclusions:
The delineated Zuru-Bini Yauri lineament and Anka lineament on the magnetic data acts as shear zones which formed as a slow response to inhomogeneous deformation partitioning strain directly into curviplanar and planar high-strain zones. These structures are transcurrent channel ways which are likely conduit for hydrothermal fluids which brings about mineral emplacement.
The structures with shallow depth that coincide with certain lithological boundaries such as metasedimentary and metavolcanic exchanges are high prospects for follow-up investigation towards mineral exploration.
Extensive areas with increased potassium enrichment that coincides with areas of intense demagnetisation may be explained as the destruction of magnetite due to the flow of hot hydrothermal fluids in the rock units, thereby accentuating low magnetic intensity in the affected areas.
Results from this study show that mineralisation may be structurally controlled and independent of any particular lithology which bears significant implication towards mineral exploration.
Disclosure statement
No potential conflict of interest was reported by the author(s).
References
- Adepelumi AA, Falade AH. 2017. Combined high-resolution aeromagnetic and radiometric mapping of uranium mineralisation and tectonic settings in northern Nigeria. Acta Geophys. 65(5):1043–1068. doi:https://doi.org/10.1007/s11600-017-0080-3.
- Aisabokhae JE, Oresajo B. 2018. Application of remote sensing method for geological interpretation of Sokoto Plain, Nigeria. South Afr J Geomatics. 7(3):360–371. doi:https://doi.org/10.4314/sajg.v7i3.12.
- Aisabokhae JE, Oresajo B. 2019. The magnetic response of hydrothermal alteration in iron-oxide basement complex, NW Nigeria. Geol Geophys Environ J. 45(2):145–156. doi:https://doi.org/10.7494/geol.2019.45.2.145.
- Aisabokhae JE, Osazuwa IB. 2021. Radiometric mapping and spectral based classification of rocks using remote sensing data analysis: the Precambrian Basement complex, NW Nigeria. Remote Sens Appl Soc Environ. 21:100447. doi:https://doi.org/10.1016/j.rsase.2020.100447
- Akinlalu AA, Adelusi AO, Olayanju GM, Adiat KAN, Omosuyi GO, Anifowose AYB, Akeredolu BE. 2018. Aeromagnetic mapping of basement structures and mineralisation characterisation of Ilesa schist belt, Southwestern Nigeria. J Afr Earth Sci. 138:383–391. doi:https://doi.org/10.1016/j.jafrearsci.2017.11.033
- Assran ASM, El Qassas RAY, Yousef MHM. 2019. Detection of prospective areas for mineralization deposits using image analysis technique of aeromagnetic data around Marsa Alam-Idfu road, Eastern Desert, Egypt. Egypt J Petrol. 28(1):61–69. doi:https://doi.org/10.1016/j.ejpe.2018.11.002.
- Ball E. 1980. An example of very consistent brittle deformation over a wide intracontinental area: the late Pan-African fracture system of the Tuareg and Nigerian shield. Tectonophysics. 61(4):363–379. doi:https://doi.org/10.1016/0040-1951(80)90240-1.
- Balogun OB. 2019. Tectonic and structural analysis of the migmatite-gneiss-quartz complex of Ilorin area from aeromagnetic data. NRIAG J Astron Geophys. 8(1):22–33. doi:https://doi.org/10.1080/20909977.2019.1615795.
- Danbatta UA, Abubakar YI, Ibrahim AA. 2009. Geochemistry of gold deposits in Anka schist belt, northwestern Nigeria. Nigeria J Chem Res. 13:19–29.
- Danjuma SG, Bonde DS, Mohammed A, Sale L, Tudu AMB. 2019. Identification of mineral deposits in Garin Awwal mining site, Kebbi State, northwestern Nigeria. J Multidiscip Eng Sci Technol. 6(6):10276–10280.
- Dentith M, Mudge ST. 2014. Geophysics for the mineral exploration geoscientist. Cambridge (United Kingdom): Cambridge University Press.
- Dickson BL, Scott K. 1997. Interpretation of aerial gamma-ray surveys adding geochemical factors. AGSO J Aust Geol Geophys. 17(2):187–200.
- Elkhateeb SO, Abdellatif MAG. 2018. Delineation potential gold mineralization zones in a part of central eastern desert, Egypt using airborne magnetic and radiometric data. NRIAG J Astron Geophys. 7(2):361–376. doi:https://doi.org/10.1016/j.nrjag.2018.05.010.
- El-Sadek I, Mousa IM. 2010. Integration of space images and airborne radiometric data for discrimination of radioactive mineralization at Wadi Araba Area, North-eastern desert, Egypt. Egypt J Remote Sens Space Sci. 13(1):11–19. doi:https://doi.org/10.1016/j.ejrs.2010.07.002.
- Fitches WR, Ajibade AC, Egbuniwe IG, Holt RW, Wright JB. 1985. Late Proterozoic schist belts and Plutonism in NW Nigeria. J Geol SocLondon. 142(2):319–337. doi:https://doi.org/10.1144/gsjgs.142.2.0319.
- Gao X, Xiong S, Yu C, Zhang D, Wu C. 2021. The estimation of magnetite prospective resources based on aeromagnetic data: a case study of Qilui area, Shandong Province, China. Remote Sens. 13:1–19.
- Garba I. 2000. Origin of Pan-African mesothermal gold mineralisation at Bin Yauri, Nigeria. J Afr Earth Sci. 31(2):433–449. doi:https://doi.org/10.1016/S0899-5362(00)00098-1.
- Garba I. 2002. Geochemical characteristics of the gold mineralization near Tsohon Birnin Gwari, northern Nigeria. Geochemistry. 62(2):160–170. doi:https://doi.org/10.1078/0009-2819-00008.
- Garba I. 2003. Geochemical characteristics of mesothermal gold mineralization in Pan-African (600 ± 150 Ma) basement of Nigeria. Appl Earth Sci (Trans Inst Min Metal Sect B). 112(3):319–325. doi:https://doi.org/10.1179/037174503225003143.
- Grant NK, Hickman M, Burkholder FR, Powell JL. 1972. Kibaran metamorphic belt in the Pan-African domain of West Africa. Nature (Phys Sci). 238:90–91.
- International Atomic Energy Agency (IAEA). 2003. Guidelines for radioelement mapping using gamma ray spectrometry data. IAEA-TECDOC-1363. Vienna (Austria).
- Kogbe C. 1979. Geology of the south-eastern sector of the Iullemmeden Basin. In: Bulletin of department of geology. 36-45. Zaria: Ahmadu Bello University.
- Kumwenda J, Lackie M. 2019. Geophysical interpretation of the geology of the Stranthorpe region using aeromagnetic, gravity and radiometric data. J Aust Soc Explor Geophys. 50(6):653–666. doi:https://doi.org/10.1080/08123985.2019.1659102.
- Nigerian Geological Survey Agency. 2009. Airborne geophysical survey total magnetic intensity map of southern Kebbi (Sheet 118 and 139) area.
- Obaje NG. 2009. Geology and mineral resources of Nigeria. London: Springer Dordrecht.
- Oladunjoye MA, Olayinka AI, Alaba M, Adabanija MA. 2016. Interpretation of high-resolution aeromagnetic data for lineaments study and occurrence of banded iron formation in Ogbomoso area, Southwestern Nigeria. J Afr Earth Sci. 114:43–53. doi:https://doi.org/10.1016/j.jafrearsci.2015.10.015.
- Olurin OT. 2017. Interpretation of high resolution airborne magnetic data (HRAMD) of Ilesha and its environs, southwest Nigeria using Euler deconcolution method. Mater Geoenviron. 64(4):227–341. doi:https://doi.org/10.1515/rmzmag-2017-0013.
- Oyeniyi TO, Salami AA, Ojo SB. 2016. Magnetic surveying as an aid to geological mapping: a case study from Obafemi Awolowo university campus in Ile-Ife, southwest Nigeria. Ife J Sci. 18(2):331–343.
- Ramadan TM, Abdel Fattah MF. 2010. Characteristics of gold mineralization in Garin Hawal area, Kebbi State, NW Nigeria, using remote sensing. Egypt J Remote Sens Space Sci. 13(2):153–163. doi:https://doi.org/10.1016/j.ejrs.2009.08.001.
- Wemegah DD, Preko K, Noye RM, Boadi B, Menyeh A, Danuor SK, Amenyoh T. 2015. Geophysical interpretation of possible gold mineralization zones in Kyerano, South-Western Ghana using aeromagnetic and radiometric datasets. J Geosci Environ Prot. 3(4):67–82. doi:https://doi.org/10.4236/gep.2015.34008.
- Wright JB, Hastings DA, William HR. 1985. Geology and mineral resources of West Africa. London: Allen and Unwin.