
 ?Mathematical formulae have been encoded as MathML and are displayed in this HTML version using MathJax in order to improve their display. Uncheck the box to turn MathJax off. This feature requires Javascript. Click on a formula to zoom.
ABSTRACT
Reducing expenses is a critical aspect of natural resource explorations, especially in the reconnaissance stage. Accordingly, GIS algorithms using the free remote sensing data were used to rank the probable mineralised zones before any future implementations of the high-cost drilling and/or detailed geophysical programmes. Geological and tectonic settings, and being a historical mineral resource were motivations to choose the Allaqi-Heiani Suture (AHS), Upper Egypt, as a study area. Remote sensing data were processed for tracing the probably mineralised alteration zones, determining fractures and dominating structural systems, and mapping different geological units. Various alteration minerals including hydroxyls–carbonates, ferrous and ferric iron oxides were detected over different rock units using band ratio (BR) and Crosta techniques. Different geological units were distinguished using false colour composite (FCC) images. Moreover, an intense fractured system, demonstrating the area, was revealed by tracing lineaments using informative, spatially enhanced remote-sensed images. Fractures within the altered rocks represent 35% of the total fracturing system in the AHS to indicate a structural system controlling mineralisation occurrences. The processing of magnetic data suggested a deep/buried nature of these remotely detected lineaments/structures. Reduced to pole (RTP) and tilt derivative (TDR) maps detected the buried magnetic sources, whereas zero contours of TDR, Euler deconvolution, analytic signal and source parameter imaging (SPI) techniques traced buried contacts/structures and estimated their depths. A GIS strategy depending on the intensity of the fracturing system and the presence of more than one type of alteration was applied to potential-rank the prospective mineralised occurrences over AHS. The correlation between ranked zones with the old/known mines showed encouraging evaluation.
1. Introduction
Upper Egypt and the Sudanese desert are called Nubian land; likewise, the rock belt along the western part of the Red Sea is called Nubian Shield. In the old Egyptian language, the word “Nubia” means gold (Habashi Citation2016), which indicates the importance of this desert as a gold source since ancient periods. Despite the knowledge (geological) simplicity of the ancient Egyptians, Romans, and early Arabs, they realised the close relationship between the presence of quartz veins and the narrow, rabid changes in lithology (alteration zones) with gold, silver and copper minerals occurrences. Therefore, gold production mainly depended on high-grade quartz veins and placer (alluvial) deposits through ancient eras. It would not be an exaggeration if we said that the ancients reached all the places that we consider today as sites for gold occurrences, but more than that, they reached places that are still rigid to reach today (for more, see Klemm and Klemm Citation2013). The historic mining activity is evidenced by the ancient house remains, stooped-out quartz veins, shafts, adits, mine tailings, hand hammers and crushed rocks (Klemm and Klemm Citation2013).
Recently and with the scientific progress, investigating mineralisations is conducted using satellite scenes interpretations and field geological studies to map the hydrothermal alteration zones and quartz veins, discriminating different rock units and determining the surface features/lineaments, while tracing the subsurface structures, estimating the depth and assessing the extension/rootedness and reserves of mineralised bodies are carried out using geophysical, and geochemical and drilling programmes (e.g. Ramadan and Sultan Citation2003; Akanbi and Ugodulunwa Citation2010; Mekkawi Citation2012; Zeinelabdein and El Nadi Citation2014; Pour and Hashim Citation2015; Wemegah et al. Citation2015; Sadek et al. Citation2015, Citation2020; El Arafy Citation2016; Hassan and Sadek Citation2017; Eldosouky et al. Citation2017; Gahlan and Ghrefat Citation2018; Amara et al. Citation2019; Salamba et al. Citation2019; Zoheir et al. Citation2019; Traore et al. Citation2020; Es-Sabbar et al., Citation2020; Saleh et al. Citation2020; Mekkawi et al. Citation2021; Gabr et al. Citation2022; ElGalladi et al. Citation2022; Araffa et al. Citation2022). The remote sensing and geophysical signal changes are subject to the spectral and physical properties that function in the mineralogical composition of various rocks. Therefore, the integration between the remote sensing and geophysical techniques was applied in this study by using Landsat 8 images and aeromagnetic data. The GIS algorithms were used to detect lineaments automatically and order the mineralisation potential zones. The west Allaqi-Heiani-Suture (AHS) represents the study area located downstream of Wadi Allaqi, South Eastern Desert, about 180 km southeast of Aswan city, Upper Egypt ().
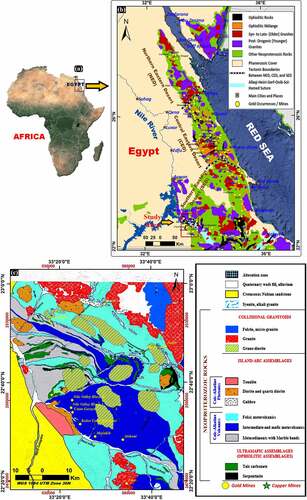
Figure 1. (a) Location of the study area. (b) A simplified geological map of the Egyptian Eastern Desert highlights the general geology and position of the study area (modified after Ramadan et al. Citation2001; Abdelsalam et al. Citation2003; Abdelsalam Citation2010; Johnson et al. Citation2011, Citation2017; Azer Citation2013; ElGalladi et al. Citation2022). (c) Detailed geological map of west Allaqi-Heiani Suture (AHS) (Kusky and Ramadan Citation2002; ElGalladi et al. Citation2022).
This manuscript tried to answer some addressed questions, like: Can we potential-ordering the probable mineralisation zones, within AHS, using the GIS algorithms and remote sensing data before any future drilling programmes? Does the surficial tracing of alterations and structures/lineaments, using geological surveys and remote sensing data, reflect the occurrence of deep mineralisations? Is the Allaqi district an encouraging future location for mineral extraction? Why? Where?
2. Tectonic, geological and drainage settings of west Allaqi-Heiani Suture (AHS)
One of the most obvious evidence of suturing is the presence of linear ophiolitic-decorated belts defining the position where the closure of oceans/basins took place (Abdelsalam and Stern Citation1996; Hamimi et al. Citation2019). These sutures/collisions are accompanied by plentiful granitic intrusions invading both sides of the accreted terranes/fragments (Kröner and Stern Citation2005) to represent a fertile environment for the hydrothermal solutions to deform/alter rock units and precipitate different ore bodies (ElGalladi et al. Citation2022) while the Egyptian Eastern Desert is a good example (). The Allaqi-Heiani Suture (AHS), study area, represents the western segment of the large, well-preserved arc–arc Allaqi-Heiani-Gerf-Onib-Sol-Hamed-Yanbu (AHGOSHY) suture within the northernmost of the Arabian-Nubian Shield (ANS) (Abdelsalam and Stern Citation1996; Abdelsalam et al. Citation2003; Johnson et al. Citation2011) ().
The basement rocks within west AHS are mainly represented by ophiolitic rocks, island-arc assemblages and granitic intrusions () (CONOCO Citation1987; EGSMA Citation1996; Ramadan et al. Citation2001; Kusky and Ramadan Citation2002; Ramadan and Sultan Citation2003; Khalil et al. Citation2014; Eldosouky et al. Citation2017; ElGalladi et al. Citation2022). The ophiolitic rocks represent obducted remnants of the oceanic lithosphere and the oldest rock units within the AHS. Ophiolites are dismembered and distributed within the middle segment of West AHS. While Wadi Haimur, Gebel Shikeyit, Wadi Umm Araka, Wadi Um Ashira and Gabel Shilman are the main provinces of the recorded ophiolites. Ophiolitic rocks including serpentinites, talc-carbonates and metagabbros superimposed/thrusted over the island arc rocks (Kusky and Ramadan Citation2002). Metagabbros are very limited within the study area. Whereas the island-arc rocks are the most abundant units within the Wadi Allaqi area (study area) including considerable metasediment and metavolcanic rocks, while gabbro-to-diorite intrusions are less common. These intrusions are heterogeneous in composition and include gabbro, diorite, quartzdiorite and tonalite. The younger granites surround the study area in the north, east and south. The late orogenic granites are associated with mineralisation, like gold, radioactive and rare-metal mineralisations [e.g. Pb, Th and U in Wadi Um Geir–Wadi Allaqi (Saleh and Makroum Citation2003) and Pb, Ta, Zr, U, Nb and Y in the radioactive Umm Shilman granite (Bugrov Citation1972)]. Whereas Emam and Saad-Eldin (Citation2011) suggested the source of Al, Pb, Zn, Ba and Rb elements, recorded in Wadi Allaqi samples, to be a result of weathered materials drained chiefly from the granites.
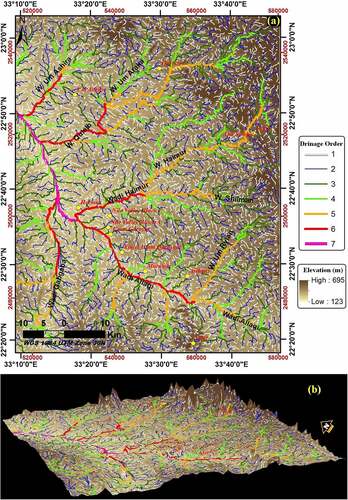
The drainage network reflects the topography and follows the elevation system over the study area. The stream flow is generally from the south-east (Wadi Allaqi), south-west (W. Gabgaba) and other Wadies in the north (such as Wadi Haimur, W. Um Ashira, W. Qulieb), which are combined at Khor-Allaqi to drain at Nasser-Lake (). Usually, placer deposits reflect the mineralised occurrences in different environments. Emam and Saad-Eldin (Citation2011), Ramazanov and Ali (Citation2011) and El-Makky and Sediek (Citation2012) studied samples collected from different streams/Wadis within the study area. The geochemical analysis indicated the occurrence of different minerals and placer gold deposits within the collected samples. Thence, the drainage network in could be used to detect placer deposits, especially in zones where the stream becomes curved and at zones where various stream orders intersect. These zones represent places where the speed of the stream flow changes/decreases and represent a chance for the discharging or accumulation of the stream loads/minerals.
Figure 2. (a) Drainage system over west Allaqi district. (b) 3D view simulates the topography setting with the drainage network.
3. Material and methods
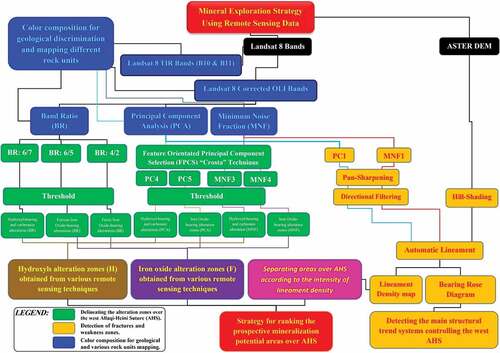
The gathering between (1) delineation of hydrothermally altered rocks that may be associated with mineralisation deposits, (2) detection of fracturing and weakness zones and (3) geological discrimination and mapping various rock units, is considered to be the best mineral exploration strategy (e.g. Sabins Citation1999; Gahlan and Ghrefat Citation2018; Araffa et al. Citation2022; ElGalladi et al. Citation2022). To achieve this optimum mineral exploration strategy, image processing techniques were applied for the corrected Landsat 8 OLI images (), including
Figure 3. A flowchart scheme shows the processing techniques used for the exploration of new prospective mineralisation potential zones over the west Allaqi-Heiani Suture (AHS).
3.1. Delineation of hydrothermally altered rocks
3.1.1. Band ratio (BR)
Dividing or subtracting the digital numbers of two bands produces a new band (called; band ratio in the case of dividing) which highlights the spectral contrast and reduces the spectral similarity of the transformed/parent bands. Hydroxyl-bearing and carbonate minerals have strong absorption features in 2.08–2.35 μm corresponding to band 7 (2.1–2.3 μm) and intense reflectance in 1.55–1.75 μm parallel band 6 (1.56–1.66 μm) of Landsat 8. Therefore, SWIR bands of Landsat 8, or BR 6/7, are the most suitable ratio to discriminate hydroxyl-bearing alterations and carbonate minerals (Gupta Citation2003, Citation2018; Pour and Hashim Citation2015; El Arafy Citation2016; Banerjee et al. Citation2019; Zoheir et al. Citation2019; Traore et al. Citation2020; Araffa et al. Citation2022; ElGalladi et al. Citation2022).
Ferrous (Fe2+)-bearing minerals have absorption characteristics within B5 (0.845–0.885 μm) and high reflectance within B6 (1.560–1.660 μm). Thence, the OLI BR 6/5 is used for detecting the ferrous mafic rocks (El Arafy Citation2016; Banerjee et al. Citation2019; Zoheir et al. Citation2019; Traore et al. Citation2020; Araffa et al. Citation2022; ElGalladi et al. Citation2022). Moreover, BR 6/5 helps identify the weathered ferruginous rocks (gossans) produced by oxidation and leaching of sulphide mineralisation and represent a probably surface indicator of buried ore deposits (Sabins Citation1999; Haldar Citation2018) especially gold occurrences in the Arabian Nubian Shield, ANS (Ramadan and Sultan Citation2003; Zeinelabdein and El Nadi Citation2014; Gahlan and Ghrefat Citation2018; ElGalladi et al. Citation2022).
Ferric (Fe3+) irons (e.g. limonite, jarosite and haematite) tend to have high spectral absorption in the ultraviolet or blue region between 0.45 and 0.52 μm (corresponding OLI B2) and high reflectance characteristics near red zone between 0.63 and 0.69 μm (corresponding OLI B4) giving iron minerals its rusty reddish-brown colour (Gupta Citation2003, Citation2018; Pour and Hashim Citation2015; Araffa et al. Citation2022; ElGalladi et al. Citation2022). Thus, OLI BR 4/2 was used for mapping ferric-bearing minerals. For mapping, alteration minerals over west AHS, Sabins’ OLI BRs of 6/7, 6/5 and 4/2 were selected to sharpen hydroxyls and carbonates, ferrous- and ferric-iron oxides, respectively.
3.1.2. Thresholding and separating alteration zones
The threshold is an image segmentation technique that determines the inflection point or the threshold value where the spectral response critically changes. El Said et al. (Citation2014), Fatima et al. (Citation2017), Amara et al. (Citation2019), Traore et al. (Citation2020), Aboelkhair et al. (Citation2020), Soliman et al. (Citation2021) and Araffa et al. (Citation2022) used threshold technique to separate and map alteration zones. Threshold has been applied for Sabins’ band ratios () and for Crosta selected (of PCs and MNFs) eigenimages to extract alteration zones over west AHS.
Table 1. Statistical factors used for estimating the band ratios threshold values for mapping alteration minerals in .
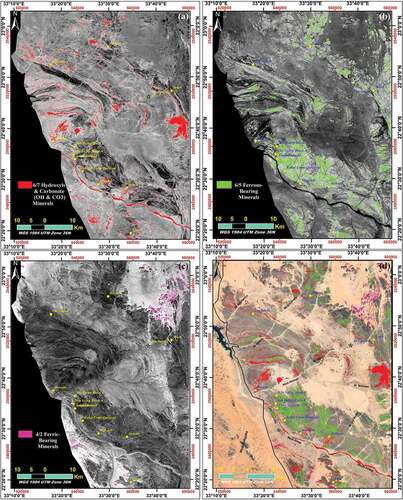
Figure 4. Threshold of band ratios 6/7, 6/5 and 4/2 to extract alteration zones: (a) Hydroxyl-bearing and carbonate minerals extraction, BR 6/7. (b) Extraction of ferrous-iron oxide minerals, BR 6/5. (c) Extraction of ferric-iron oxides minerals, BR 4/2. (d) The alteration minerals overlaid the natural colour image of Google Earth.
3.1.3. Feature-orientated principal component selection (FPCS) “Crosta” technique
The most optimum eigenvector (e.g. PC, MNF, ICA, etc.) for highlighting and mapping certain features (such as vegetation, alteration zones, etc.) is the one with the best fitting to the spectral features (bands) which are theoretically spectral sensitive for this target. The best-fitting eigenimage means the most spectral sensitive for the target, i.e. it is loaded by the highest contrast (positive and negative) eigenvalues for the reflectance and absorption bands of the target, to help in more sharpening the studied features. This technique is called FFPCS or “Crosta” (Crosta and Moore Citation1989). Crosta statistics were calculated for the PC and MNF components to sharpen the alteration zones within west AHS.
3.2. Lineament extraction and detection of fracturing and weakness zones
Detection of fracturing and weakness zones is one of the bases of the optimum triangle of mineral exploration strategy. Lineaments represent the weak zones and fractures which represent the path in which the hydrothermal fluids migrated/ascended through and deposit their loads (ore bodies) forming veins and alteration zones (El Arafy Citation2016; Eldosouky et al. Citation2017; Salamba et al. Citation2019; El-Desoky et al. Citation2021; Araffa et al. Citation2022; ElGalladi et al. Citation2022; Gabr et al. Citation2022).
3.2.1. Surface features, remote sensing data
3.2.1.1. Automatic lineament extraction
Lineament extraction automatically depends on variations in the brightness and colour tone, i.e. edge detection, of different features. So, as far as possible, increasing the spatial resolution of the used image will enhance the results of the lineament tracing process. Where most authors enhance the spatial resolution by pan-sharping and spatial-domain, edge detection, filtering of the used spectral images and hill-shading of the digital elevation models (e.g. El Arafy Citation2016; Amara et al. Citation2019; Es-Sabbar et al., Citation2020; ElGalladi et al. Citation2022; Araffa et al. Citation2022).
The automatic lineament process was carried to the most informative eigenimages including the PC1, which carries 95.8% of total variances of Landsat 8 OLI (1–7) bands (), the MNF1 image, the highest signal-to-noise image and the Global Digital Elevation Model (GDEM) of ASTER with 30 m spatial resolution. To improve the results of the lineament process, PC1 and MNF1 eigenimages were pan-sharpened and directional filtered, using a 3*3 neighbourhood convolution (kernel) matrix, in N-S (0°), NE-SW (45°), E-W (90°) and NW-SE (135°) directions, while the DEM image was hill-shaded in the same sun illumination angles (solar azimuth) using ENVI software. For extracting the geologic lineaments automatically, the LINE module algorithm of the PCI Geomatica software was used with the default parameters except for editing the threshold value for the edge gradient to become (50). The extracted lineaments, linear and curvilinear features, were exported from the LINE module algorithm as a vector layer to be statistically analysed and layout by the ArcGIS software. The rose diagram was plotted using RockWorks software to examine the orientation and identify the fracture trending system of the extracted lineaments.
Table 2. PCA eigenvector matrix of Landsat 8 used bands (B1–B7).
3.2.1.2. Lineament (line) density map
A density map calculates the concentration of lineaments per unit area (line frequency/unit area). It divides lineaments into low-density areas and high-density zones. The latter reveal highly fractured systems which are favourable media for the precipitation of the migrated/ascended hydrothermal solution loads and ore bodies deposition in the altered/fractured zones.
3.2.2. Subsurface structures, aeromagnetic data
Are these remotely detected lineaments/features reflecting the deep, buried, structures and tectonic settings or only relating to surface-weathered ones? The aeromagnetic data were processed to detect the magnetic (possible mineralised) sources and trace deep structures beneath the Allaqi-Heiani Belt to answer this question.
The aeromagnetic data of the Aero-Service (Citation1984) survey covering the study area were corrected and processed to compute the total magnetic intensity (TMI) anomaly. TMI was reduced to the magnetic pole (RTP) to peak the magnetic anomalies directly over their subsurface causative sources. To highlight the edges of magnetic sources, the tilt derivative (TDR) technique was employed. TDR is positive/peak over the magnetic sources, negative outside and zero contoured at/near the edge of the source (Miller and Singh Citation1994). TDR was applied to the RTP map to detect the magnetic sources and trace the geological edges/contacts beneath the study area. Furthermore, the Euler deconvolution technique was utilised to follow the magnetic contacts using the structural index of zero (SI = 0) (Reid et al. Citation1990).
The analytic signal (AS) (Roest et al. Citation1992) is the square root of the sum of the first derivative squares in the vertical (dz) and horizontal (dx and dy) directions of the magnetic field (EquationEquation 1(Equation. 1)
(Equation. 1) ), so it is also known as the total gradient technique. AS is a helpful technique in mineral exploration as it highlights/peaks over the magnetic edges and the geological structures where the high and low magnetic susceptibility, of different rocks, get in contact and over fractures and shear zones where the magnetite-rich magma ascended and infilled these fractures (Roest et al. Citation1992; Akanbi and Ugodulunwa Citation2010; Mekkawi Citation2012; Wemegah et al. Citation2015; Mekkawi et al. Citation2021). While the analytic signal magnitude is a function of the magnetic susceptibility contrast of different rocks (Akanbi and Ugodulunwa Citation2010).
where M is the total magnetic field, : is the first horizontal derivative in the (x) direction,
: is the first horizontal derivative in the (y) direction,
: is the first derivative in the vertical (z) direction.
The analytic signal of the total magnetic anomaly (AS) was gridded according to (EquationEquation 1(Equation. 1)
(Equation. 1) ). Likewise, the analytic signal of the first vertical derivative (AS1) was calculated with (EquationEquation 2
(Equation. 2)
(Equation. 2) ).
where Mv is the first vertical derivative of the total magnetic field.
Depth (D) to the magnetic sources could be estimated using the ratio of the analytic signal of the total magnetic anomaly (AS) to the analytic signal of the first vertical derivative (AS1), under assumptions that anomalies are in two-dimension (2D), (EquationEquation 3(Equation. 3)
(Equation. 3) ) (Saada Citation2015; Al-Badani and Al-Wathaf Citation2017; Mono et al. Citation2018; Saleh et al. Citation2020).
where D is the depth to the magnetic source, N is a structural index (Reid et al. Citation1990) which is directly related to a simple geometry of the magnetic sources. N = 0 is related to magnetic contacts, while N = 1 is for 2D narrow dikes or sills, pipes or horizontal cylinders have N = 2 and N = 3 is relative to spherical magnetic bodies.
Source parameter imaging (SPI) (Thurston and Smith Citation1997) is an automatic method that uses the complex analytic signal to estimate the depths to magnetic sources/edges without prior knowledge of the magnetisation direction. The accuracy of the SPI, based on a correlation between the calculated depths of SPI and real data from hole drilling, is ± 20% which is the same accuracy for the Euler technique (Aisabokhae et al. Citation2018; Meneisy and Al Deep Citation2021; Oguche et al. Citation2021). SPI tool of Geosoft software was used to compute the depths of geological contacts beneath the Allaqi district.
3.3. Geological discrimination and rock units mapping
Geological mapping is the third base of the triangle strategy used in this study for mineral exploration. While the band combinations of satellite bands are useful for this object. The true colour composite image (TCC) makes the recognition of the geological units easy as it enables the interpreter to see a familiar scene of rock units, as felsic rocks appear bright, while mafic appear dark, deep water is seen as blue, vegetation is green and so on. While false-colour composite (FCC) images can emphasise other features out/not only within the visible wavelength ranges of TCC image. The OLI (B2:B7) and TIR (B10 and B11) bands, in addition to OLI band ratios (BR), PCA (PC1:PC5) and MNF (MNF1:MNF6) eigenimages were included in the combination building process of different coloured FCC images to identify different rock units.
4. Results and discussion
4.1. Mapping alteration zones
4.1.1. Threshold of band ratio (BR)
The threshold technique was applied for the Sabins’ ratios 6/7, 6/5 and 4/2 to separate hydroxyl-bearing and carbonate minerals, ferrous mafic rocks and ferric iron oxides within west AHS (; ) respectively. The threshold took place after clipping the Saharan cretaceous deposits (left zone of the study area, black in ) and masking the Wadi and quaternary deposits, inside the study area, to prevent conflation with alteration zones ().
4.1.2. Application of FPCS “Crosta” technique to PCA images
For extracting hydroxyl-bearing alterations (e.g. clay minerals, mica) and carbonates (e.g. marbles, dolomites), Landsat 8 bands 6 (intense reflectance) and 7 (strong absorption) were selected to be examined overall PCs to get the optimal PC with the highest contrast between these two bands. The highest contrast means the best highlighting of the hydroxyl-bearing features. Principal component (PC4) was chosen to highlight hydroxyls as it has the highest contrast between bands 6 and 7 (). The PC4 is loaded by a negative eigenvalue (−0.7097) for band 6 (reflectance band) and a positive loading (+0.6724) for band 7 (absorption band). It is expected that PC4 will highlight hydroxyls with dark-tone colours. The PC4 image was inverted (by multiplying the PC4 band by −1) to reverse the brightness and highlight hydroxyls with bright colours to make the identification and thresholding process easier (). For mapping the hydroxyl–carbonate-bearing minerals, the thresholding process was applied to the inverted PC4 according to a confidence 98% ():
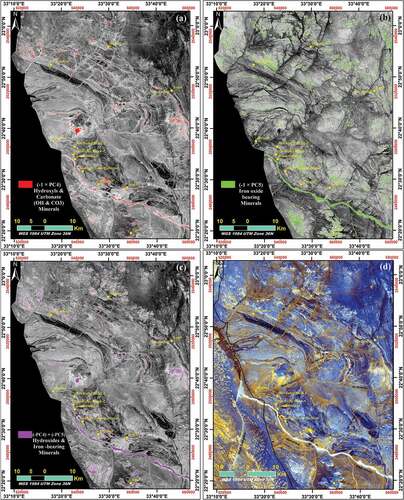
Figure 5. (a) Extraction of hydroxyl-bearing and carbonate minerals by thresholding the inverted PC4. (b) Extraction of iron oxide minerals by thresholding the inverted PC5. (c) Extraction of hydroxides and iron oxides by thresholding the inverted (PC4+ PC5). (d) Crosta’s FCC image of inverted PC4, inverted (PC4+ PC5) and inverted PC5 as RGB.
For identifying iron oxide minerals, Landsat 8 band pairs of 6 and 5, 5 and 4 and 4 and 2 are the choices for applying the FPCS technique. PC5 was chosen to highlight ferrous-bearing minerals as it carries a negative loading of the absorption band (B5; −0.7068) and a positive eigenvalue of the reflector band (B6; +0.0252) with good contrast between bands 6 and 5 (). PC5 is also suitable for mapping bands B5 (−0.7068) and B4 (+0. 6578) with high contrast between them (). Moreover, PC5 is sensitive for bands B4 (+0.6578) and B2 (−0.1591), which sharpen the ferric-iron oxides (). Therefore, PC5 is the choice for sharpening iron oxides which expected to be highlighted with dark-coloured. The PC5 image was inverted to make the mineralised pixels appear with a bright tone to make the identification and threshold process easier ().
PC5 was thresholded to convert the image into two colours (binarization), the mineralised zones with colour and non-mineralised as a background (black or non-coloured), then we export the mineralised areas (pixels) as a shapefile (). The threshold equation was applied at confidence 98% ():
The inverted PC4 (Hydroxyls image) and inverted PC5 (Iron image) were summed [(-PC4)+(-PC5)] to get the iron-hydroxyl (H + F) image (). The iron-hydroxyl image was also thresholded at confidence 95% ():
The inverted PC4 (Hydroxyls image), [(-PC4)+(-PC5)] (H + F image) and inverted PC5 (Iron image), respectively, were used to build the Crosta alteration image which is a false-colour composite image of PCs that highlights the alteration zones over west AHS ().
4.1.3. Application of FPCS “Crosta” Technique to MNF images
Bands 6 and 7 were examined to map the hydroxyl-bearing and carbonate minerals as they are theoretically spectral responses for the hydroxyls and carbonates. MNF3 was chosen as it shows a high positive loading (+0.427) for B6 (reflectance band) and high negative loading (−0.0479) for B7 (absorption band) (). MNF3 highlights the carbonates and hydroxyls with a bright tone. MNF3 was thresholded at a confidence of 98% ():
Figure 6. (a) Extraction of hydroxyl-bearing and carbonate minerals by thresholding MNF3. (b) Extraction of iron oxide minerals by thresholding MNF4. (c) Extraction of hydroxides and iron oxide minerals by thresholding MNF3 + MNF4 image. (d) Crosta alteration image, FCC image of MNF3, (MNF3+ MNF4) and MNF4 respectively as RGB.
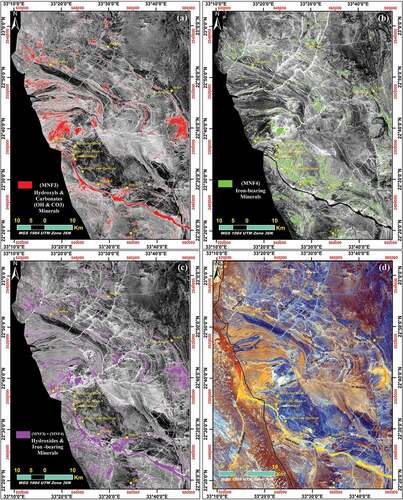
Table 3. Eigenvectors of MNF components of Landsat 8 used bands (B1-B7).
Bands 6 and 4 were selected to be examined over all MNF images for mapping iron oxides. MNF4 was found to be suitable for mapping iron-bearing minerals as it carries a positive loading for band 4 (+0.5081) and a negative value for band 6 (−0.1365). Likewise, MNF4 was found to be helpful in highlighting the ferric iron minerals as it shows a high positive loading for the reflectance band (B4; +0.5081) and a high negative loading for the absorptive band (B2; −0.6265). The mineralised pixels will appear with bright pixels (). To extract the iron oxides, the MNF4 eigenimage was thresholded at confidence 95% ():
The eigenimages of MNF3 (H-image) and MNF4 (F-image) were summed to obtain the possible occurrence (H + F) image of both iron-oxide and hydroxyl-bearing minerals. The mineralised areas (pixels) of the summed image were thresholded at a confidence of 95% ():
The FCC, Crosta alteration image, of MNF3 (hydroxyls image), MNF3+ MNF4 (H + F image) and MNF4 (Iron image) as RGB, respectively, were used to highlight the hydrothermal alteration zones over the study area (). The hydroxyl-bearing minerals are delineated by yellow to golden, bright orange. Pixels of Wadi Allaqi and Wadi Gabgaba are highlighted by yellow, golden colour, to indicate that alluvial deposits cover these Wadis. While the iron oxide areas are distinguished by the cyan to bright blue pixels. Also, Wadis with quaternary deposits appeared in cyan, so they were masked in the threshold process (), to prevent conflation with iron-bearing alterations. White to creamy colours (highest digital numbers) characterised the altered zones with both iron and hydroxyl-bearing minerals which are the most promising areas for mineral exploration ().
4.2. Lineament extraction and detection of fractures and weakness zones
4.2.1. Surface features
4.2.1.1. Detection of the predominating surface trend systems
Lineaments of the pan-sharpened, directional filtered PC1 and MNF1, and the hill-shaded DEM images (in 0, 45, 90 and 135 directions) were combined into a single vector image (). A large number of lineaments was traced (106,542 features) with a total length 106,458.11 km to indicate a highly fractured, tectonized, system demonstrating the study area and refer a fertile zone for mineralisation occurrences.
Figure 7. (a) Remotely sensed combination of lineaments extracted automatically from the composition of enhanced PC1, MNF1 and DEM images. (b) Remote sensed lineament density map of west AHS. (c) Lineaments orientation rose diagram. (d) Lineaments length rose diagram. (e) Basic statistics of the total automatically extracted lineaments.
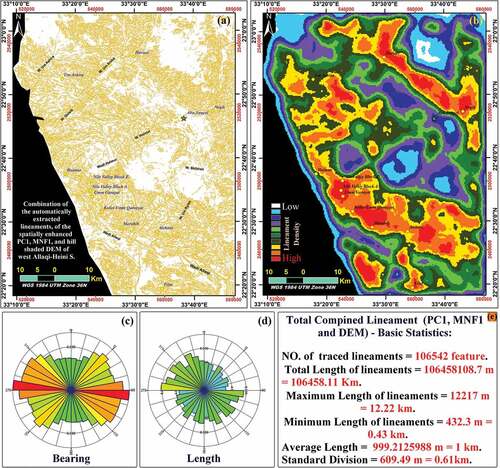
To examine the controlling structural trend/orientation system over the west AHS, the bearing rose diagram was plotted. The rose diagram of the total automatic remotely sensed lineaments, of PC1, MNF1 and DEM showed the main sets of WNW-ESE, ENE-WSW and NE-SW as the predominant fracture systems ().
4.2.1.2. Lineament density map
The line density map of the study area is shown in . High-density zones are highlighted by red, orange and yellow colours which mainly appear in the southern, western side, western south and eastern north corners of the study area (). High-density contours characterise the strongly sheared ophiolites and listvenites as Haimur gold mine area and the scattered, fractured ophiolites as Hariari gold mine in north and Nagib gold mine in the middle east of study area. Likewise, the strongly fractured metavolcanic rocks within Umm Garayat, Nile Valley Blocks, Atshani and Marahaib gold mining area in the west middle of Allaqi-Heiani Suture are differentiated by highly line-density contours which also characterise the deformed/altered granitic rocks within the south at Filat gold mine, and northern part of west AHS ().
4.2.1.3. Percentage and orientation of the hydrothermal alteration system
To detect the surface orientation systems associated with the mineralised occurrences, the remotely sensing extracted lineaments were limited to alteration-bearing zones only (after masking unaltered areas, and the Saharan Cretaceous deposits in the west and the recent alluvial deposits of Wadi Allaqi). The lineaments of hydroxyl-bearing altered zones were separated as a single layer (). Also, lineaments of iron-oxides altered zones separated as an individual shapefile (). The number of lineaments of hydroxyl-bearing alterations equals 12,924 lineaments () (represent 12.13% of, 106,542, the total remotely sensing extracted lineaments; ). While lineaments of the iron oxide alterations are 24,804 () (represent 23.29% of all extracted lineaments; ). The total percentage of features and fractures of altered rocks (hydroxyl and iron oxide-bearing alterations) represents 35% of the total fracturing system over the west AHS. This high percentage also means the mineralisation and alteration systems are positively correlated with the fracturing system (structurally controlled mineralisation) in Allaqi-Heiani Suture which represents a suitable environment for gold, copper and other mineralisation occurrences.
Figure 8. Automatically, remotely sensing, extracted lineaments for alteration zones: (a) Lineaments of hydroxyl-bearing zones. (b) Lineaments of iron-oxide altered zones. (c) Lineaments orientation rose diagram of hydroxyl-bearing zones. (d) Lineaments length rose of hydroxyl altered zones. (e) Lineaments trend rose diagram of iron-oxides. (f) Lineaments length rose diagram of iron-oxide altered zones.
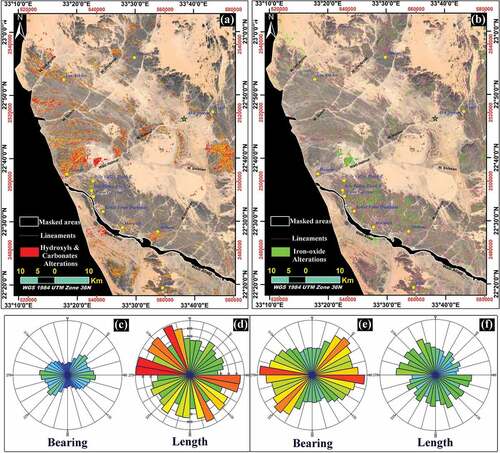
Trends of hydroxyl-bearing alterations were examined by plotting a bearing rose diagram which shows the WNW-ESE, ENE-WSW and NE-SW, especially N45E as the main trend systems (). Likewise, the orientation system of the iron oxide-bearing alteration zones shows the same main sets of hydroxyl alterations in the WNW-ESE, NE-SW, especially N45E, and ENE-WSW, respectively ().
In general, the alterations trends are following the general, observed, structure system of west AHS with predominating trends in WNW-ESE, ENE-WSW and NE-SW, especially N45E, fracture systems, respectively (). This interconnection between the orientation systems of altered zones and whole fracture system indicates the structurally controlled mineralisation occurrences in the west Allaqi-Heiani belt.
4.2.2. Subsurface structures and depth to buried magnetic sources
To ensure that the surficial, remotely, traced lineaments are related to deep magnetic bodies and a buried structure system, analysing of aeromagnetic data took place. The RTP map reflects the mineralogical composition and the magnetic response of the buried rock units. The high anomalies in the RTP map are related to the altered ultramafic rocks (serpentinites), mafic metavolcanics and granitic intrusions (). Serpentinites represent the elongated (and bent) high magnetic anomalies/belts, west the study area, taking the NW-SE and E-W directions, respectively, as the main trends. However, the ultramafic rocks of Gabel Haimur anticline (mainly embedded within metasediments and metavolcanics; middle west of the study area) and some patches within the elongated serpentinite belts didn’t show high magnetic anomalies over the airborne RTP map, why? Although serpentinisation of ultramafic rocks increases the magnetic susceptibility (mainly due to the formation of magnetite mineral during serpentinisation), however carbonation of serpentinites/ultramafics decreases the magnetic susceptibility significantly (mainly due to the destruction of magnetite during carbonation and increasing the amount of magnesite minerals forming talc-carbonates and quartz) (Tominaga et al. Citation2017; Mitchinson et al. Citation2020; Cutts et al. Citation2021; Godard et al. Citation2021). Therefore, the high degree of hydrothermal carbonation of ultramafic/serpentinite rocks within the Haimur area resulted in decreasing the recorded magnetic readings. Such an explanation is reinforced by the previous field studies which described serpentinites within Haimur area as highly deformed/altered serpentinites and silicified and carbonatized serpentinites (talc-carbonates and listvenites) (Emam and Zoheir Citation2013; Zoheir and Emam Citation2014; Abd El Monsef and Abdelnasser Citation2020; Araffa et al. Citation2022). While metavolcanics within the Umm Garayat mines area show a positive magnetic anomaly expected to extend deeper due to deeply, mineralised-rich, Volcanogenic Massive Sulphide (VMS) deposits settled beneath the area (Ramadan and Sultan Citation2003; ElGalladi et al. Citation2022). Meanwhile, the highest magnetic readings are related to the older and younger granitic intrusions (like granodiorites, and monzogranites and microgranites) with distinctive oval shapes in the north, middle and south of the study area (). The geological correspondence between granitic intrusions with high magnetic readings may indicate iron/magnetite rich content of these granites (typically biotite-rich [K2(Mg,Fe)6(Si6Al2)O20(OH)4] granites). The biotite-rich granites type was confirmed by Saleh and Makroum (Citation2003) at Gabel Filat, south of the study area, and by Emam and Radwan (Citation2021) at Nasb-Zurar area, northwest of the study area (north Um Ashira).
Figure 9. (a) RTP map. (b) Tilt derivative (TDR) map. (c) Zero contours of TDR map to outline the edges of magnetic anomalies, with their rose diagram. (d) Euler solutions estimated the depths to magnetic contacts at shallow depths (≤−150 m), with their rose diagram (ElGalladi et al. Citation2022).
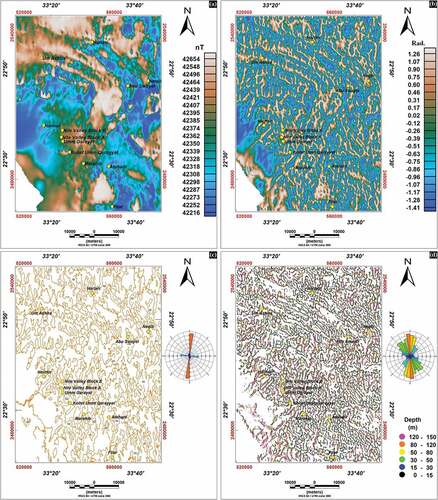
The tilt derivative (TDR) map sharpens the magnetic anomalies (). Whereas zero contours of TDR () highlight the edges of these anomalies and thence detect the structures/boundaries. The heavy numbers/distributions of the TDR zero-contours reflect the highly fractured/structured system buried beneath the AHS.
Likewise, ElGalladi et al. (Citation2022) traced the subsurface contacts using the structural index (SI = 0) of the Euler deconvolution technique beneath the study area. The Euler solutions were restricted to the shallow depths (≤–150 m) to define the contacts/edges of residual magnetic (possible mineralised) sources (). These tracked contacts also revealed an intensity crowded, fractured zone, and showed high similarity with TDR zero-contours. The main structural trends of these subsurface/magnetic lineaments referred to the N-S (NNE-SSW and NNW-SSE), N45W and E-W directions as the predominant trend systems. These magnetic trends exhibit a good correlation with the surface remotely sensed lineaments.
The analytic signal maps of the magnetic anomalies (AS; , applied to the RTP map) and of the first vertical derivative (AS1; ) maxima over the magnetic contacts and outlined the edges of magnetisation sources (Roest et al. Citation1992). AS and AS1 highlighted the granitic intrusions like area in the north (microgranites and monzogranites around Hariari mine), in the south (monzogranites around Filat mine) and above the granodioritic rocks in the middle (near Abu Swayel mine). Also, the AS and AS1 anomalies peaked over the magnetic transitions like areas of contact between the NW-SE belts of serpentinites and mafic metavolcanic rocks with the adjacent metasediments and felsic metavolcanics (like the zone around Um Ashira mine).
Figure 10. (a) Analytic signal map of the total magnetic field (AS). (b) Analytic signal of the first vertical derivative (AS1). (c) Depth estimations to the magnetic sources using the analytic signal technique. (d) Depth solutions to the magnetic sources/contacts, beneath AHS, using the SPI technique.
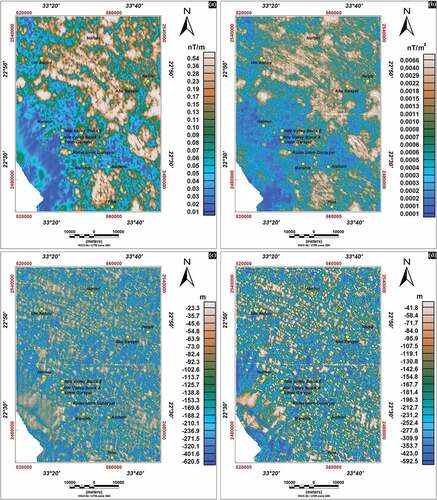
Depth estimations to the magnetic sources using the analytic signal technique were calculated by dividing the AS by AS1 (i.e. N = 0 in EquationEquation 3)(Equation. 3)
(Equation. 3) to highlight the magnetic contacts/faults beneath the AHS. Depths range from shallower rocks (around −23.3 m) to the deeper sources (at −620.5 m and deeper) (). Likewise, the Source Parameter Imaging (SPI) technique outlined a general depth image of the magnetic sources under the study area (). SPI results approximately show high similarity with the contacts and depths deduced from the analytic signal method. The SPI shows a depth variation from −41.8 to −592.5 m with an average depth equal to −192.7 m, which indicates the near-surface/shallow nature of the magnetic/mineralised sources and the buried structures beneath the Allaqi-Heiani belt.
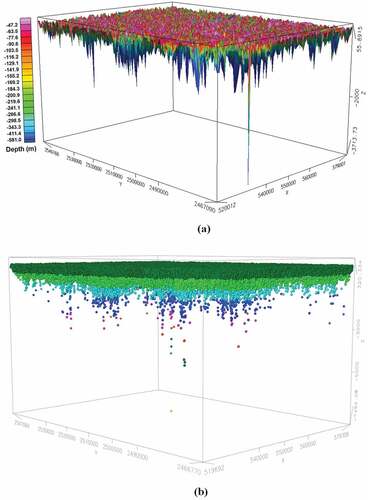
Moreover, if you know that, the total solutions/depths calculated by the SPI technique reached 557,729 points (magnetic sources) beneath the study area. Meanwhile, the number of sources with a depth shallower than >−500 m equals 533,778 sources with a percentage of 95.7%, whilst sources deeper than <−500 m equal 23,950 sources with a percentage of 4.29% (). These numbers indicate the shallow occurrences of the magnetic sources while the large variations in the percentages between the numbers of shallow and deeper sources (95.7%: 4.29%, respectively) could indicate a ductile–brittle transition zone (DBZ) where fractures at depth are fewer and increase upward at/near the surface (, and Figure S1 attached as an online resource; available to download in a supplementary file). Such brittle–ductile shear zone was recorded at surface structures and deformed minerals/veins in the Allaqi district and is mainly associated with the development of auriferous quartz veins (El-Kazzaz Citation1995; El-Kazzaz and Taylor Citation2001; Zoheir Citation2007; Zoheir and Klemm Citation2007; Zoheir et al. Citation2017). This DBZ could interpret why the residual magnetic and remote sensing maps traced large numbers of lineaments/fractures and explain why the Allaqi district is rich with auriferous quartz veins and hosts altered, mineralisation-rich, zones.
Figure 11. (a) 3D gridding, (b) 3D symbol simulation, of the depths to magnetic sources/contacts estimated using the SPI technique which suggests a ductile–brittle transitional/deformational zone (DBZ).
The anomalies/solutions of analytic signal and SPI maps (in ) show high similarity to the magnetic bodies of TDR map () and their edges (zero contours of TDR map, ) and further offer the depth estimations for these contacts/sources. These contacts/sources mainly take the NW-SE and NNE-SSW as the main trend systems. These anomalies could represent the lithological structures or magnetite-rich magma that ran upward to infill fractures carrying possible bearing mineralised sources. While the known mines within the area show good examples of the mineralised bearing anomalies in these maps.
The intensity and trend system of the traced magnetic/subsurface contacts revealed a highly fractured area and reported a strong tectonic, deformation, history along the AHS life. While the very shallow estimated depths (−23.3 m: −620.5 m) and the small scale of these depth variations (~0.5 km of range variation) revealed that the magnetic (probably mineralised bearing) sources/structures occurred at the near-surface to represent a very encouraging zone for the mineral exploration and indicate the efficiency of surficial tracing of these structures/lineaments using the geological surveys and remote sensing data.
4.3. Geological discrimination and mapping of different rock units
The true colour image (TCC) was obtained by combining OLI- B4, B3 and B2 as RGB, respectively. The natural colour image was pan-sharpened using the high spatial resolution B8 to enhance the ground resolution of the image (). False colour images (FCC) were created to differentiate between various rock units and match the mutual units that have the same spectral response for the bands used in the various false colour images.
Figure 12. Landsat 8 band composition images over the west AHS. (a) Pan-sharpened natural (true) colour of OLI band composition as Red: B4, Green: B3 and Blue: B2. (b): (g) False colour composite (FCC) images using OLI and TIRS bands, band ratios and PCA images. (Bands included in the FCC composition, in the RGB channels, are labelled over each image).
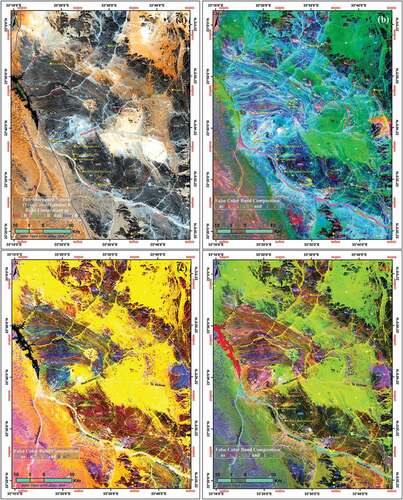
Figure 12. (Continued).
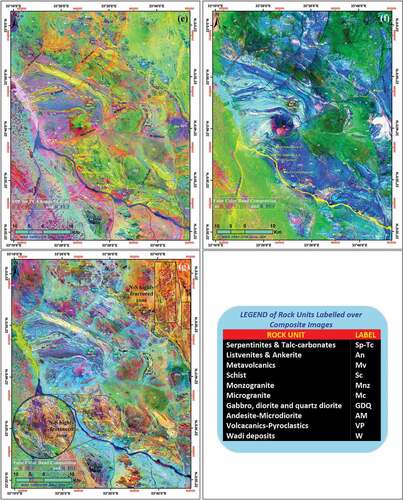
Initially, band ratio 6/7 was executed for mapping clay and other hydroxyl alteration minerals in addition to carbonates. Also, band ratio 5/7 was useful in identifying clay minerals. Band ratios 6/5, 6/4 and 5/4 were useful in recognising ferrous, mafic iron oxide rocks. Ferric-iron oxide minerals were sharpened by using band ratio 4/2. Also, band ratios resulting from the dividing of bands in visible wavelength region such as BR 4/3 and BR 3/2 were useful for distinguishing ferric iron rocks. Band ratio 6/2 was purposive in recognition of monzogranite and microgranite (granites) over the study area.
PC4 and MNF3 were fruitful in differentiating hydroxyl-bearing alteration, clay and carbonate minerals (similar to the OLI band ratio 6/7). PC5 and MNF4 helped characterise iron oxide minerals. PC3 and MNF5 were also useful in identifying altered rocks.
Thermal infrared (TIR) bands (B10 and B11) of Landsat 8 helped identify silicate, and quartz units and differentiate the mafic/felsic rocks which have various spectral responses for the thermal infrared (TIR) bands.
The FCC images resulting from the combination of different greyscale images according to the previously mentioned aspects are shown in (, and Figure S2 attached as an online resource; available to download in a supplementary file). The extension of different geological units was revealed by the band composite images which correlated and labelled according to the previously published geological maps over the study area, such as the geological maps in .
Table 4. Geological maps that were used for correlation and labelling the Landsat 8, TCC and FCC, images over the west Allaqi-Heiani Suture (AHS).
4.4. Order ranking of the prospective mineralisation zones over AHS
Previous magnetic results confirmed that the remote sensing detected lineaments/features are related to the buried structures. Thence, the surface, remotely sensing, traced lineaments may be used for investigating new probable mineralised zones along the Allaqi-Heiani Belt.
Moreover, the results concluded by applying remote sensing techniques show that
1) By integration between the remotely sensing extracted lineaments, lineament density map ( respectively) and the known gold mines, overlying the maps, it is noticed that there is a positive correlation between the high lineament density areas and the known gold mineralisation sites.
2) Also, by superimposing the extracted alteration zones (hydroxyls and iron-oxides extracted from the threshold of band ratios and Crosta images) on the lineament density map, it is noticed that there is a positive correlation between the high lineament density areas and the extracted alteration zones ().
Figure 13. (a) Superimposing image combines hydroxyl-bearing, iron-oxide alterations and fracture system, the highest earlier three lineament density contours, all over a real colour image of Google Earth. (b) Remotely sensed ranking of the prospective mineralisation zones in west AHS, Diagram, c represents a legend of the probable mineralisation categories. (c) The pyramid scheme describes the ranking order of prospective mineralisations according to the existence of alteration zones and the structural control system. The top of the diagram (red colour) represents the highest ranking (first order) of the probable mineralisation occurrences, while the bottom is the expected lowest potential ranking.
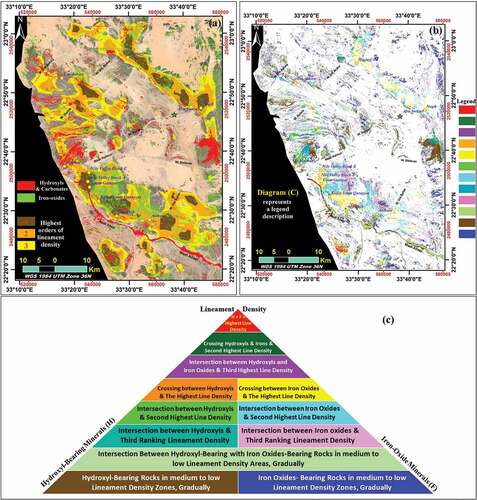
3) The heavy lineaments, (106,542 features) with a total length of 106,458.11 km, extracted from remote sensing data (), reinforced by magnetic results, that are oriented in different directions (), indicate a highly fractured system dominated the AHS area and reflect the intense density of the subsurface structures.
4) Moreover, Araffa et al. (Citation2022) detected listvenite alterations within the Haimur gold mine area, west middle of the study area, using remote sensing techniques as the highest fractured and the most heterogeneous zones including admixtures of various alteration minerals as carbonate-, hydroxyl- and iron-oxide minerals within serpentinite rocks. In Wadi Allaqi, gold is enriched in listvenite alterations up 400–1000 times in comparison to its occurrence in the original serpentinites (Azer Citation2013).
These concluded results prove the big role of tectonic and structural events in the occurrence and distribution of mineralisations over the west Allaqi-Heiani belt (structurally controlled mineralisation zone). This may be a key for discovering new mineralisation potential zones in the west AHS.
From the previous results, the probable mineralised zones in AHS were ranked, using remote sensing data, according to three factors: (1) first, the existence of hydroxyl-bearing minerals and/or carbonates; (2) second, the presence of iron-oxide-bearing minerals; and (3) the third factor is the intensity of fracturing system controlling the mineralised zone (obtained from lineament density map) as the probability of mineralisation occurrence increases at intense fracturing zones.
4.4.1. The prospective mineralisation GIS-ranking strategy
The highest order of this tri-factor ranking pyramid represents areas in which hydroxyl-bearing/carbonates minerals (H) intersect iron-oxide bearing (Fe) with the highest fracture system (highest lineament density).
The second order is areas with intersection between hydroxyls and iron oxides with the second-highest fracture system (second-highest lineament density).
The third order is the altered zones in which hydroxyls and iron oxides cross the third-highest fracture system (third-highest lineament density).
Only the early highest three fracture systems (highest three density areas) were included in this classification.
(4) In the fourth order, the areas with the intersection between one alteration type (hydroxyl or iron oxide) with the earliest fracture system (highest lineament density), for example, altered zones with hydroxyl-bearing minerals that cross the highest fracture system (highest lineament density) represent this class, which is equal to iron oxide-bearing areas with the highest fracture system (highest lineament density) order in this category.
(5) In the fifth grade, altered areas with hydroxyls or irons bearing intersect the second-highest fracture system.
(6) In the sixth class, hydroxyls or irons alterations cross the third-highest fracture system (third-highest lineament density).
(7) In the seventh group, areas with the intersection between the two extracted alteration types, hydroxyls with iron oxide-bearing areas, with medium fracture system (medium contoured areas in the lineament density map) gradually to the lowest fracture areas.
(8) In the eighth ranking, areas with medium to the lowest, gradually, fracture system that crosses only one type of the extracted alteration type, hydroxyls or iron oxide altered zones.
The remotely sensed ranking of the prospective mineralisation potential areas in the west Allaqi-Heiani Suture according to these three factors: hydroxyl-bearing minerals, iron-oxide altered zones and density of fracture system is shown in () and diagram in (). Also, the ranking process was zoomed in for the known gold mines in west AHS and it matches very well (). Therefore, the highly ordered areas could represent encouraging provinces for any future drilling programmes and mining exploitations.
Figure 14. Comparison between the remotely sensed ordering with the known gold mines in west AHS, overlie Google Earth images: (a) Haimur gold mine. (b) Nile Valley Blocks and Um Garayat gold mines. (c) Marahib gold mine. (d) Atshani gold mine. (e) Nagib gold mine and area of Abu Swayel copper mine. (f) Filat gold mine. (g) Um Ashira gold mine. (h) Hariari gold mine. Diagram, c, in , represents a legend of the colours in this figure (Figure 14) and describes the ranking order of the prospective mineralisation occurrences.
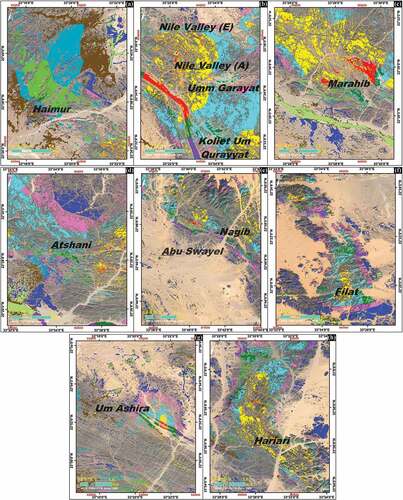
Particularly, hydroxyl (H) alterations and iron oxides (Fe), extracted from BR and Crosta eigenimages of PCA and MNF (, respectively) were merged into a single layer for each alteration type (i.e. separated H-shapefile and Fe-shapefile). The lineament density map () was converted to dissected shapefiles, every class with its shapefile (i.e. the highest lineament density, the second, the third and so on, areas become individual/separated shapefiles). By using the Intersect algorithm of ArcGIS software, the shapefiles of hydroxyl (H), iron oxide (Fe) and lineament densities were used as input for the algorithm to order the prospective mineralisation zones mentioned above.
5. Conclusion
Wadi Allaqi district is a historical gold source; however, it contains undiscovered encouraging zones for futurity mineral exploration plans. Remote sensing techniques recorded diverse types of alterations over the district. Hydroxyl-bearing and carbonate alterations, ferrous-bearing and ferric-bearing oxides were delineated to represent probable mineralisation zones intruding ophiolitic, metavolcanics, metasediments and monzogranite rocks. A highly fractured, tectonized, system demonstrating the west AHS was observed using remote sensing techniques. Such an intense fractured system was indicated using magnetic maps to prove that the mineralisation occurrences in AHS are structurally controlled. Moreover, magnetic data indicated a shallow nature of these structures to represent a very encouraging area for future mineral exploration. Also, magnetic maps indicated the efficiency of the surficial tracing of structures/lineaments and alteration/mineralised sources using geological surveys and remote sensing techniques over AHS and similar environments. According to the distribution/depths of magnetic sources, a ductile–brittle deformation zone (DBZ) was suggested that interpret why the Allaqi district is rich with auriferous-quartz veins and hosts altered, mineralised-rich, zones. Therefore, a GIS strategy depending on the intensity of the fracturing system and the existence of more than one type of alteration occurrence was used for ranking the prospective mineralisation areas. The high orders ranked zones matched very well with the historical/known mines within the district. Therefore, the highly potential-ranked zones could represent encouraging provinces for any future drilling programmes and mining exploitations. Furthermore, different rock units over the west AHS were differentiated.
Supplemental Material
Download PDF (12.2 MB)Acknowledgements
The USGS, NASA and METI are thanked for the free Landsat 8 and ASTER-GDEM images. The authors extend their sincere appreciation to the anonymous reviewers for their valuable comments and helpful suggestions which greatly improved the early version of this manuscript.
Disclosure statement
No potential conflict of interest was reported by the author(s).
Data availability statement
The data collected for this work are available.
Supplementary material
Supplemental data for this article can be accessed online at https://doi.org/10.1080/20909977.2022.2156068
References
- Abdeen MM, Abdelghaffar AA. 2008. Mapping Neoproterozoic structures along the central Allaqi-Heiani suture, southeastern Egypt, using remote sensing and field data. Egypt J Remote Sens Space Sci. 11:109–138.
- Abd El Monsef M, Abdelnasser A. 2020. Ore-forming mechanism and its relationship with deformational and metamorphic episodes at Haimur gold mine, Nubian Shield, Egypt. Geol Mag. 1–19. doi:10.1017/s0016756820000655
- Abdelsalam MG. 2010. Quantifying 3D post-accretionary tectonic strain in the Arabian–Nubian Shield: superimposition of the Oko Shear Zone on the Nakasib Suture, Red Sea Hills, Sudan. J Afr Earth Sci. 56(4–5):167–178. doi:10.1016/j.jafrearsci.2009.07.003.
- Abdelsalam MG, Abdeen MM, Dwaidar HM, Stern RJ, Abdelghaffar AA. 2003. Structural evolution of the Neoproterozoic western Allaqi-Heiani Suture, southeastern Egypt. Precambrian Res. 124(1):87–104. doi:10.1016/S0301-9268(03)00080-9.
- Abdelsalam MG, Stern RJ. 1996. Sutures and shear zones in the Arabian-Nubian Shield. J Afr Earth Sci. 23(3):289–310. doi:10.1016/S0899-5362(97)00003-1.
- Aboelkhair H, Abdelhalim A, Hamimi Z, Al-Gabali M. 2020. Reliability of using ASTER data in lithologic mapping and alteration mineral detection of the basement complex of West Berenice, Southeastern Desert, Egypt. Arab J Geosci. 13(7). doi:10.1007/s12517-020-5227-x.
- Aero-Service. 1984. Final operational report of airborne magnetic-radiometry survey in the Eastern Desert of Egypt. The Egyptian General Petroleum Corporation (EGPC). Cairo (Egypt).
- Aisabokhae J, Adamu A, Oresajo B. 2018. Analytic signal, depth and multispectral interpretation of areas within the continental terminal, North-western Nigeria. J Appl Sci Environ Manag. 22(5):669–673. doi:10.4314/jasem.v22i5.9.
- Akanbi ES, Ugodulunwa F. 2010. Using analytic signal technique in the interpretation of the residual magnetic field of Naraguta area, North-Central Nigeria. Niger J Phy. 21(2).
- Al-Badani MA, Al-Wathaf YM. 2017. Using the aeromagnetic data for mapping the basement depth and contact locations, at southern part of Tihamah region, western Yemen. Egypt J Pet. 27(4):485–495. doi:10.1016/j.ejpe.2017.07.015.
- Amara A, Aissa D, Maouche S, Braham M, Machane D, Guessoum N. 2019. Hydrothermal alteration mapping and structural features in the Guelma basin (Northeastern Algeria): contribution of Landsat-8 data. Arab J Geosci. 12(3). doi:10.1007/s12517-019-4224-4.
- Araffa SAS, Abd-AlHai MM, Mekkawi MM, ElGalladi AA. 2022. Integrated geophysical, remote sensing, and geochemical investigation to explore gold-mineralizations and mapping listvenites at Wadi Haimur, Eastern Desert, Egypt. Geocarto International. Geocarto International.:1–38. doi:10.1080/10106049.2022.2129838
- Azer MK. 2013. Evolution and economic significance of listwaenites associated with Neoproterozoic ophiolites in south Eastern Desert, Egypt. Geologica Acta. 11(1):113–128.
- Banerjee K, Jain MK, Jeyaseelan AT, Panda S. 2019. Landsat 8 OLI data for identification of hydrothermal alteration zone in Singhbhum Shear Zone using successive band depth difference technique – a new image processing approach. Curr Sci. 116(10):1639–1647. doi:10.18520/cs/v116/i10/1639-1647.
- Bugrov V. 1972. Technical Report on follow-up geochemical operations in the period 1968-1972, Aswan Mineral Survey Project. Geol Surv Egypt.
- CONOCO. 1987. Geological map of Egypt, Bernice Sheet, NF 36 NE, Scale 1: 500,000. The Egyptian general petroleum corporation (EGPC). Cairo (Egypt).
- Crosta A, Moore J (1989). Enhancement of Landsat thematic mapper imagery for residual soil mapping in SW Minas Gerais State Brazil: a prospecting case history in greenstone belt terrain. Proceedings of the 9th Thematic Conference on Remote Sensing for Exploration Geology, Calgary Ann Arbor, MI: Environmental Research Institute of Michigan, 1173–1187.
- Cutts JA, Steinthorsdottir K, Turvey C, Dipple GM, Enkin RJ, Peacock SM. 2021. Deducing mineralogy of serpentinized and carbonated ultramafic rocks using physical properties with implications for carbon sequestration and subduction zone dynamics. Geochem, Geophys, Geosystems. 22(9):e2021GC009989. doi:10.1029/2021GC009989.
- EGSMA. 1996. Geological map of Wadi Jabjabah Quadrangle, Egypt, NF-36-K. scale. 1: 250:000.
- El Arafy R (2016). Discrimination of various rock units in Abu Zenima area, Southwestern Sinai, Egypt, with emphases to the radioactive areas using the hyperspectral remote sensing and GIS techniques Doctoral dissertation, Birmingham (Alabama): The University of Alabama at Birmingham. ResearchGate. 10.13140/RG.2.2.17737.03684/1
- El-Desoky H, Soliman N, Heikal M, Abdel-Rahman A. 2021. Mapping hydrothermal alteration zones using ASTER images in the Arabian–Nubian Shield: a case study of the northwestern Allaqi District, South Eastern Desert, Egypt. Asian Earth Sci: X. 5:100060. doi:10.1016/j.jaesx.2021.100060
- Eldosouky A, Abdelkareem M, Elkhateeb S. 2017. Integration of remote sensing and aeromagnetic data for mapping structural features and hydrothermal alteration zones in Wadi Allaqi area, South Eastern Desert of Egypt. J Afr Earth Sci. 130:28–37. doi:10.1016/j.jafrearsci.2017.03.006
- ElGalladi A, Araffa S, Mekkawi M, Abd-AlHai M. 2022. Exploring mineralization zones using remote sensing and aeromagnetic data, West Allaqi area, Eastern-Desert, Egypt. Egypt J Remote Sens Space Sci. 25(2):417–433. doi:10.1016/j.ejrs.2022.03.007.
- El-Kazzaz YAHA (1995). Tectonics and mineralization of Wadi Allaqi, south Eastern Desert, Egypt. PhD thesis: University of Luton, 220. http://hdl.handle.net/10547/606076
- El-Kazzaz YAHA, Taylor WEG. 2001. Tectonic evolution of the Allaqi shear zone and implications for Pan-African terrane amalgamation in the south Eastern Desert, Egypt. J Afr Earth Sci. 33(2):177–197. doi:10.1016/s0899-5362(01)80058-0.
- El-Makky A, Sediek N. 2012. Stream sediments geochemical exploration in the northwestern part of Wadi Allaqi area, south Eastern Desert, Egypt. Nat Resour Res. 21(1):95–115. doi:10.1007/s11053-011-9166-9.
- El Said M, Abo Elkhair H, Dardier A, Hermas S, Minoru U. 2014. Processing of Multispectral ASTER data for mapping alteration minerals zones: as an aid for Uranium exploration in Elmissikat-Eleridiya granites, central eastern desert, Egypt. Open Geol J. 8(1):69–83. doi:10.2174/1874262901408010069.
- Emam A, Qaoud N, Abdel Rahman E, Fawzy K. 2014. Comprehensive mapping of the island arc rocks in the Marahiq area, South Eastern Desert, Egypt. Open Geology J. 8(1):84–96. doi:10.2174/1874262901408010084.
- Emam A, Radwan A. 2021. Geochemistry and petrogenesis of I-type granitoid rocks around Nasb-Zurar intrusion, West Wadi Allaqi, South Eastern Desert, Egypt. Arab J Geosci. 14(7). doi:10.1007/s12517-021-06913-x.
- Emam A, Saad-Eldin M. 2011. Distribution and environmental geochemistry of some heavy metals in stream sediments of Wadi Allaqi, South Eastern Desert of Egypt. Arab J Geosci. 6(5):1325–1332. doi:10.1007/s12517-011-0437-x.
- Emam A, Zoheir B. 2013. Au and Cr mobilization through metasomatism: microchemical evidence from ore-bearing listvenite, South Eastern Desert of Egypt. J Geochem Explor. 125:34–45. doi:10.1016/j.gexplo.2012.11.004
- Es-Sabbar B, Essalhi M, Essalhi A, Mhamdi H. 2020. Lithological and structural lineament mapping from Landsat 8 OLI images in Ras Kammouna arid area (Eastern Anti-Atlas, Morocco). Economic and Environmental Geology. 53(4): 425–440. https://doi.org/10.9719/EEG.2020.53.4.425
- Fatima K, Khattak M, Kausar A, Toqeer M, Haider N, Rehman A. 2017. Minerals identification and mapping using ASTER satellite image. J Appl Remote Sens. 11(4. doi:10.1117/1.JRS.11.046006
- Gabr S, Diab H, Abdel Fattah T, Sadek M, Khalil K, Youssef M. 2022. Aeromagnetic and Landsat-8 data interpretation for structural and hydrothermal alteration mapping along the Central and Southern Eastern Desert boundary, Egypt. Egypt J Remote Sens Space Sci. 25(1):11–20. doi:10.1016/j.ejrs.2021.12.002.
- Gahlan H, Ghrefat H. 2018. Detection of gossan zones in arid regions using Landsat 8 OLI data: implication for mineral exploration in the eastern Arabian Shield, Saudi Arabia. Nat Resour Res. 27(1):109–124. doi:10.1007/s11053-017-9341-8.
- Godard M, Carter EJ, Decrausaz T, Lafay R, Bennett E, Kourim F, Obeso J-CD, Michibayashi K, Harris M, Coggon J, et al., the Oman Drilling Project Phase 1 Science Party. 2021. Geochemical profiles across the listvenite-metamorphic transition in the basal megathrust of the Semail ophiolite: results from drilling at Oman DP Hole BT1B. J Geophys Res: Solid Earth. 126:e2021JB022733. doi:10.1029/2021JB022733
- Gupta R. 2003. Remote sensing geology. 2nd ed. Heidelberg: Springer Berlin. doi:10.1007/978-3-662-05283-9
- Gupta R. 2018. Remote sensing geology. 3rd ed. Heidelberg: Springer Berlin. doi:10.1007/978-3-662-55876-8
- Habashi F. 2016. Gold - An historical introduction. In: Adams MDeditor. Gold ore processing: project development and operations. 2nd: Amsterdam, Netherlands: Elsevier;p.1–20. 10.1016/B978-0-444-63658-4.00001-3.
- Haldar S. 2018. Mineral exploration: principles and applications. 2nd. Amsterdam, Netherlands: Elsevier doi:10.1016/C2017-0-00902-3
- Hamimi Z, Abd El-Wahed M, Gahlan H, Kamh S. 2019. Tectonics of the Eastern Desert of Egypt: key to understanding the Neoproterozoic evolution of the Arabian–Nubian Shield (East African Orogen). In: Bendaoud A, Hamimi Z, Hamoudi M, Djemai S, Zoheir B, editors. Geology of the Arab World—An overview. Cham: Springer; p. 1–81. doi:10.1007/978-3-319-96794-3_1
- Hassan SM, Sadek MF. 2017. Geological mapping and spectral based classification of basement rocks using remote sensing data analysis: the Korbiai-Gerf nappe complex, South Eastern Desert, Egypt. J Afr Earth Sci. 134:404–418. doi:10.1016/j.jafrearsci.2017.07
- Johnson P, Andresen A, Collins A, Fowler A, Fritz H, Ghebreab W, Kusky T, Stern R. 2011. Late Cryogenian–Ediacaran history of the Arabian–Nubian Shield: a review of depositional, plutonic, structural, and tectonic events in the closing stages of the Northern East African Orogen. J Afr Earth Sci. 61(3):167–232. doi:10.1016/j.jafrearsci.2011.07.003.
- Johnson P, Zoheir B, Ghebreab W, Stern R, Barrie C, Hamer R. 2017. Gold-bearing volcanogenic massive sulfides and orogenic-gold deposits in the Nubian Shield. South Afr J Geol. 120(1):63–76. doi:10.25131/gssajg.120.1.63.
- Khalil A, Obeid M, Azer M. 2014. Serpentinized Peridotites at the North Part of the Wadi Allaqi district (Egypt): implications for the tectono-magmatic evolution of fore-arc crust. Acta Geol Sin (Engl Ed). 88(5):1421–1436. doi:10.1111/1755-6724.12309.
- Klemm R, Klemm D. 2013. Gold and gold mining in ancient Egypt and Nubia. Heidelberg: Springer Berlin. doi:10.1007/978-3-642-22508-6
- Kröner A, Stern R. 2005. Africa | pan-African orogeny. Ency Geol. 1–12. doi:10.1016/B0-12-369396-9/00431-7
- Kusky T, Ramadan T. 2002. Structural controls on Neoproterozoic mineralization in the South Eastern Desert, Egypt: an integrated field, Landsat TM, and SIR-C/X SAR approach. J Afr Earth Sci. 35(1):107–121. doi:10.1016/S0899-5362(02)00029-5.
- Mekkawi MM. 2012. Application of magnetic method in mineral exploration: iron ore deposit, South Zagros Suture Zone. Geophys So (EGS) J. 10(1):117–124.
- Mekkawi MM, ElEmam AE, Taha AI, Al Deep MA, Araffa SA, Massoud US, Abbas AM. 2021. Integrated geophysical approach in exploration of iron ore deposits in the North-eastern Aswan-Egypt: a case study. Arab J Geosci. 14(8). doi:10.1007/s12517-021-06964-0.
- Meneisy AM, Al Deep M. 2021. Investigation of groundwater potential using magnetic and satellite image data at Wadi El Amal, Aswan, Egypt. Egypt J Remote Sens Space Sci. 24(2):293–309. doi:10.1016/j.ejrs.2020.06.006.
- Miller HG, Singh V. 1994. Potential field tilt—a new concept for location of potential field sources. J Appl Geophys. 32(2–3):213–217. doi:10.1016/0926-9851(94)90022-1.
- Mitchinson D, Cutts J, Fournier D, Naylor A, Dipple G, Hart CJR, Turvey C, Rahimi M, Milidragovic D. 2020. The carbon mineralization potential of ultramafic rocks in British Columbia: a preliminary assessment. Geoscience BC Report. 452: 25. 2020-15/MDRU Publication.
- Mono JA, Ndougsa-Mbarga T, Bi-Alou MB, Ngoh JD, Owono OU. 2018. Inferring the subsurface basement depth and the contact locations from Aeromagnetic data over Loum-Minta Area (Centre-East Cameroon). Int J Geoscie. 9(7):435–459. doi:10.4236/ijg.2018.97028.
- Oguche M, Akanbi ES, Odewumi SC. 2021. Analysis and interpretation of high resolution aeromagnetic data of Abuja sheet 186 and Gitata sheet 187, Central Nigeria. Sci World J. 16(3):212–218.
- Pour A, Hashim M. 2015. Hydrothermal alteration mapping from Landsat-8 data, Sar Cheshmeh copper mining district, south-eastern Islamic Republic of Iran. J Taibah Univ Sci. 9(2):155–166. doi:10.1016/j.jtusci.2014.11.008.
- Ramadan T, Abdelsalam M, Stern R. 2001. Mapping gold-bearing massive sulfide deposits in the Neoproterozoic Allaqi Suture, Southeast Egypt with Landsat TM and SIR=C/X SAR Images. Photogramm Eng Remote Sensing. 67(4):491–497.
- Ramadan T, Sultan S. 2003. Integration of geological, remote sensing and geophysical data for the identification of massive sulphide zones at Wadi Allaqi area, South Eastern Desert, Egypt. IEEE Int Symposium on Geosci Remote Sens. 4:2589–2592. doi:10.1109/igarss.2003.1294520
- Ramazanov V, Ali M. 2011. Stream Sediments Geochemical Investigations for Gold and Associated Elements in Wadi Haimur Area, Southeastern Egypt, Молодой учёный. 5(28): 149–157. https://moluch.ru/archive/28/3128/
- Ramazanov V, Ali M. 2012. Prediction of gold potential areas based on remote sensing techniques: a case study from Wadi Haimur region, South–Eastern Desert, Egypt. Baki Universitetinin X?b?rl?ri, T?bi?t Elml?ri Seriyasi ?1. 55(6):99–109.
- Reid AB, Allsop JM, Granser H, Millett AJ, Somerton IW. 1990. Magnetic interpretation in three dimensions using Euler deconvolution. Geophysics. 55(1):80–91. doi:10.1190/1.1442774.
- Roest WR, Verhoef J, Pilkington M. 1992. Magnetic interpretation using the 3-D analytic signal. Geophysics. 57(1):116–125. doi:10.1190/1.1443174.
- Saada SA. 2015. Edge detection and depth estimation of Galala El Bahariya Plateau, Eastern Desert-Egypt, from aeromagnetic data. Geomech Geophys Geo-Energy and Geo-Res. 2(1):25–41. doi:10.1007/s40948-015-0019-6.
- Sabins FF. 1999. Remote sensing for mineral exploration. Ore Geol Rev. 14(3–4):157–183. doi:10.1016/S0169-1368(99)00007-4.
- Sadek MF, Ali-Bik MW, Hassan SM. 2015. Late Neoproterozoic basement rocks of Kadabora-Suwayqat area, Central Eastern Desert, Egypt: geochemical and remote sensing characterization. Arab J Geosci. 8(12):10459–10479. doi:10.1007/s12517-015-1973-6.
- Sadek M, El‑kalioubi B, Ali‑Bik M, El Hefnawi M, Elnazer A. 2020. Utilizing Landsat‑8 and ASTER data in geologic mapping of hyper‑arid mountainous region: case of Gabal Batoga area, South Eastern Desert of Egypt. Environ Earth Sci. 79(5):101. doi:10.1007/s12665-020-8845-4.
- Salamba K, Hede A, Heriawan M. 2019. Identification of alteration zones using a Landsat 8 image of densely vegetated areas of the Wayang Windu Geothermal field, West Java, Indonesia. IOP Conf Series: Earth Environ Sci. 254(1):012004. doi:10.1088/1755-1315/254/1/012004.
- Saleh G, Makroum F. 2003. Pan-African magmatism: geochemical evolution and Uranium mineralization of Granitoid rocks, Southeastern Desert, Egypt. Int Geol Rev. 45(2):157–175. doi:10.2747/0020-6814.45.2.157.
- Saleh A, Qudus B, Magawata Z, Abdulrahaman IA. 2020. Delineation of structural features and depth to the magnetic sources over Allawa and its environs, Northcentral Nigeria. Int J Adv Eng Manag. 2(6):545–553.
- Soliman N, Bayoumi M, Salem S. 2021. Mapping the alteration zones for Uranium exploration in Gabal Abu Garadi area Central Eastern Desert, Egypt, using Aster data. Earth Sci. 10(2):36–48. doi:10.11648/j.earth.20211002.11.
- Thurston JB, Smith RS. 1997. Automatic conversion of magnetic data to depth, dip, and susceptibility contrast using the SPI (TM) method. Geophysics. 62(3):807–813. doi:10.1190/1.1444190.
- Tominaga M, Beinlich A, Lima EA, Tivey MA, Hampton BA, Weiss B, Harigane Y. 2017. Multi-scale magnetic mapping of serpentinite carbonation. Nat Commun. 8(1):1870. doi:10.1038/s41467-017-01610-4.
- Traore M, Wambo J, Ndepete C, Tekin S, Pour A, Muslim A. 2020. Lithological and alteration mineral mapping for alluvial gold exploration in the south east of Birao area, Central African Republic using Landsat-8 Operational Land Imager (OLI) data. J Afr Earth Sci. 170:103933. doi:10.1016/j.jafrearsci.2020.103933
- Wemegah D, Preko K, Noye R, Boadi B, Menyeh A, Danuor S, Amenyoh T. 2015. Geophysical interpretation of possible gold mineralization zones in Kyerano, South-Western Ghana using aeromagnetic and radiometric datasets. J Geosci Environ Protect. 3(4):67–82. doi:10.4236/gep.2015.34008.
- Zeinelabdein K, El Nadi A. 2014. The use of Landsat 8 OLI image for the delineation of gossanic ridges in the Red Sea Hills of NE Sudan. Am J Earth Sci. 1(3):62–67.
- Zoheir B. 2007. Structural controls, temperature–pressure conditions and fluid evolution of orogenic gold mineralisation at the Betam mine, south Eastern Desert, Egypt. Miner Depos. 43(1):79–95. doi:10.1007/s00126-007-0156-0.
- Zoheir B, Emam A. 2014. Field and ASTER imagery data for the setting of gold mineralization in Western Allaqi–Heiani belt, Egypt: a case study from the Haimur deposit. J Afr Earth Sci. 99(1):150–164. doi:10.1016/j.jafrearsci.2013.06.006.
- Zoheir B, Emam A, Abdel-Wahed M, Soliman N. 2019. Multispectral and Radar data for the setting of gold mineralization in the South Eastern Desert, Egypt. Remote Sens. 11(12):1450. doi:10.3390/rs11121450.
- Zoheir B, Emam A, El-Amawy M, Abu-Alam T. 2017. Auriferous shear zones in the central Allaqi-Heiani belt: orogenic gold in post-accretionary structures, SE Egypt. J Afr Earth Sci. doi:10.1016/j.jafrearsci.2017.10
- Zoheir B, Emam A, Pitcairn I, Boskabadi A, Lehaye Y, Cooper M. 2018. Trace elements and isotope data of the Um Garayat gold deposit, Wadi Allaqi district, Egypt. Miner Depos. 54(1):101–116. doi:10.1007/s00126-018-0807-3.
- Zoheir B, Klemm D. 2007. The tectono-metamorphic evolution of the central part of the Neoproterozoic Allaqi–Heiani suture, south Eastern Desert of Egypt. Gondwana Res. 12(3):289–304. doi:10.1016/j.gr.2006.10.005.