
 ?Mathematical formulae have been encoded as MathML and are displayed in this HTML version using MathJax in order to improve their display. Uncheck the box to turn MathJax off. This feature requires Javascript. Click on a formula to zoom.
ABSTRACT
A moderate size felt earthquake with a body wave magnitude (mb = 4.4) shocked the western part of northern Egypt on 11 April 2020. The nature of this seismic source has yet to be fully understood. This paper presents an analysis of the seismic source of this significant earthquake. A robust hypocentral parameters estimation is performed by collecting the data from 29 seismic stations in the Eastern Mediterranean region to reduce the azimuthal gap within the available location. The full-waveform Moment Tensor Inversion (MTI) is applied to derive the faulting mechanism of the quake. The obtained solutions indicate a reverse faulting mechanism. The plausibility of the obtained mechanism is analysed in terms of measuring the Kegan angle and evaluating the stability of the resulting mechanism. The source parameters are estimated using the S-wave amplitude displacement spectra. The obtained source parameters indicate that the seismic moment (Mo) is 8.9 × 10¹⁵ Nm, the fault radius L is 1013 m, the stress drop (σ) is 3.8 MPa, and the displacement (d) is 0.053 m. The analysis of this seismic source is of fundamental importance for evaluating seismic hazard in northern Egypt, particularly for critical facilities and safe hydrocarbon exploration.
1. Introduction
The northernmost part of the Western Desert () is bounded by the passive continental margin with a complex tectonic setting that is not fully understood (Abou Elenean and Hussein Citation2007; Badawy et al. Citation2015; Bosworth et al. Citation2015). It is located in the unstable shelf of Egypt (Said Citation1962) and presents the key to resolving the kinematic disconnect between the Western Desert onshore and the Egyptian offshore. The kinematics of the Western Desert onshore are controlled by the rifting event that occurred during the Middle to Late Jurassic and established the general basin configuration that persisted through most of the Mesozoic. Most active faults in the Jurassic are oriented E–W to ENE–WSW with an ∼ N–S extension direction (Guiraud, Citation1998). However, the kinematics of the Egyptian offshore is dominated by far-field compressional stresses resulting from the collision of the African and Eurasian plates and the Arabian-Eurasian convergence (Bosworth et al., Citation2008).
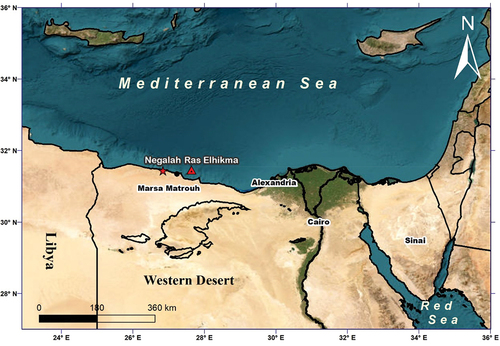
Figure 1. The northern part of the Western Desert, the location of the April 2020 EL-Negalah earthquake (red star) and Ras Elhikma earthquake (red triangle).
On the other side, a better assessment of the expected damages of an earthquake in such areas requires more understanding of the nature and the geometry of the seismic source and the associated physical process (Abdelzaher et al. Citation2020; Abdel Rahaman et al. Citation2008; Deif et al. Citation2009; Bormann et al. Citation2013; Zahran et al. Citation2016; Badawy et al. Citation2017; Gaber et al. Citation2018; Elhadidy Mahmoud and Abdalzaher Citation2021), which in turn, improves policies for the regulation and operation of natural resources. Additionally, the tectonic setting of this area is attractive to geoscientists and hydrocarbon exploration, as faults play a remarkable role in the trapping and migration of hydrocarbon (Moretti et al. Citation2010).
On 11 April 2020, a moderate size earthquake (mb 4.4) occurred in the northernmost part of the Western Desert, 40 km northwest of Marsa Matrouh city and 309 km west of Alexandria (). It was felt in Marsa Matrouh and EL-Negalah cities. This moderate earthquake is well recorded by the broadband stations of the Egyptian National Seismic Network (ENSN). Before this event, the availability of local broadband seismic records in this region was rare. Therefore, the source mechanism and source parameters of the Ras Elhikma earthquake (mb = 5.5) that occurred on 28 May 1998 and analysed by Abou Elenean and Hussein (Citation2007) were based on the teleseismic records from the global broadband seismic stations. Another important consideration is the recent seismic hazard studies (e.g. Ezzelarab et al. Citation2016) that discussed the contribution of the near offshore seismic sources to the ground motion affecting the cities in the northern coast of Egypt, especially in the short spectral periods. For these reasons, the current study aims to use the digital waveform data recorded by the ENSN broadband stations to determine the characteristic parameters for the source of the El-Negalah earthquake in terms of seismic source mechanism and source parameters.
The seismic source mechanism is usually described using a moment tensor. Recently, numerous methods have been presented for the inversion of waveform records to get the moment tensor. The widely used methods perform the inversion process based on full waveforms, amplitudes of direct waves, or amplitude ratios (Jechumtálová and Šílený Citation2005; Vavryčuk Citation2007; Sokos and Zahradnik Citation2008). We use the full-waveform inversion available in ISOLA code (Sokos and Zahradník Citation2013) for calculating a moment-tensor using the available waveform data.
The seismic source parameters (viz., source area, stress drop, corner frequency) are calculated based on the developed earthquake models (i.e. Brune Citation1970; SATO and HIRASAWA Citation1973; Boatwright Citation1980). It is performed by converting the time history to the frequency domain of the S-wave. The frequency analysis is widely used to estimate the seismic source parameters (e.g. Dobrynina Citation2009 & Kwiatek et al. Citation2011). In this study, the authors preferred to use the Brune (Citation1970), circular source model, because it is more appropriate for small to moderate events.
2. Tectonic setting and seismicity
The tectonic setting of the northwestern desert is characterised by complexity because it belongs to the unstable shelf (Said Citation1962). Furthermore, considerable hydrocarbon exploration has proven this complexity (El Gazzar et al. Citation2016). The tectonic setting of the region is attributed to the far-field compressional stresses resulting from the relative movements between the African, and Eurasian plates (Garfunkel Citation2004; Bosworth et al. Citation2015). Where, the convergent movement between African/Arabian and Eurasian Plates () developed the Syrian Arc System during the Late Cretaceous (Meshref Citation1990). The Global positioning system (GPS) measurements illustrate the relative movements (McClusky et al. Citation2003) and indicate that the African Plate moves towards the north direction at a relatively small rate. Moreover, the study of Aksu et al. (Citation2005) showed that the Aegean Sea moves towards Eurasia with a higher slip velocity (30 ± 1 mm/y) in the southwest direction. The Hellenic and Cyprian Arcs mainly delineate the boundary between Africa and Anatolian-Aegean subplate. The Arabian Plate moves towards north–northwest relative to Eurasia with a velocity of 18–25 mm/y (McClusky et al. Citation2000). The subsurface geology is deduced based on geophysical studies (Goudarzi and GH Citation1980; Meshref Citation1982; Sestini Citation1984). These studies show that this area is characterised by several subsidence depocentres and positive structures. The main trend of these subsurface features changes from W to E. East of 25°E, and faulting is mainly NW-SE to NNW-SSE and E-W. Between 25°E and 29°E, the trend is either E-W or ESE-ENE, or a combination of WNW and ENE. East of 29°E, the dominant orientation is NE and ENE, the so-called Syrian arc folds.
Figure 2. Tectonic and seismicity of the northwestern desert. Red star shows the location of the studied earthquake, and the arrows present the direction of the plate motions. Seismicity data is compiled from the ISC and ENSN Bulletins.
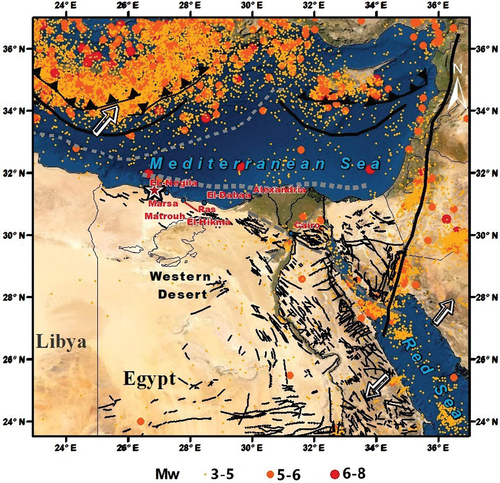
The recent instrumental seismicity () reveals the best correlation between seismic activity and the known active tectonic (Hellenic and Cyprian Arcs, Northern Red Sea rift, Gulf of Aqaba). The seismicity data plotted in is collected from the ENSN annual bulletins and the ISC bulletin. These two agencies report the size of earthquakes in different magnitude types. ENSN calculates the size of the earthquake using the local scale magnitude. At the same time, the ISC reports the size of the earthquakes in different magnitude scales, e.g. the mb and Ms. The magnitude of the earthquakes recorded by the ENSN is converted into the moment magnitude using the empirical equation proposed by Mohamed et al. (Citation2012). On the other hand, the magnitude types reported by the ISC are converted to the moment magnitude using the empirical equations proposed by Erdik et al. (Citation2012).
The most significant earthquake that occurred along the African margin is the Ras Elhikma earthquake (5.4 Mw). It occurred on 28 May 1998 and showed a reverse faulting mechanism (Abou Elenean and Hussein Citation2007). The assigned intensity of the 1998 earthquake is VII (Hassoup and Tealeb Citation2000) on the Modified-Mercalli intensity scale at Δ∼50 km to the south of the epicenter.
3. Data
Three seismic agencies report the studied event with different hypocentre parameters (i.e. epicentre location and origin time), as shown in . Therefore, a data set of 29 seismic stations of the ENSN and European Integrated Data Archive (EIDA) have been used for estimating the hypocentre parameters of the El-Negalah earthquake ( and ) using HYPOINVERSE-2000 program (Klein Citation2002). The collected metadata reduces the largest azimuthal gap between stations surrounding the epicentre to 61°.
Figure 3. Seismological stations used for the location (triangles) and MTI enclosed by red circles.
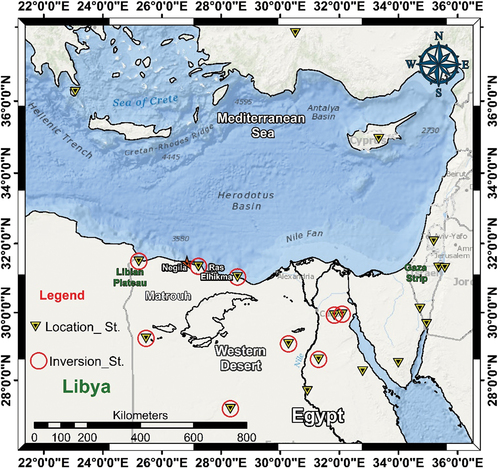
Table 1. The hypocentre parameters of the April 2020, El-Negalah Earthquake.
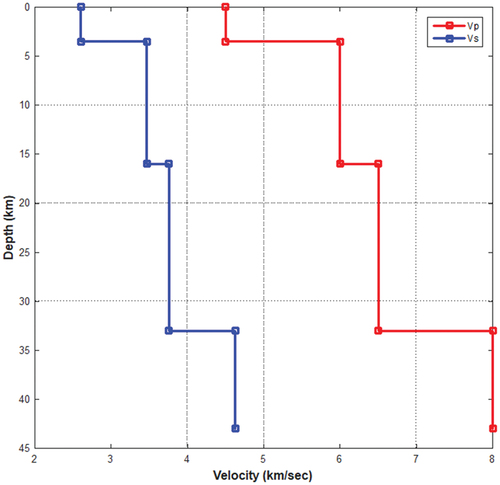
For full waveform inversion, only nine broadband seismic stations (with Trillium-240s sensor type) are feasible according to the signal-to-noise ratio for retrieving the moment tensor. The selected stations for MTI are located at epicentral distances of ≈39–531 km and have the best possible azimuthal coverage (). The quality of the waveform data is considered in the selection of these stations in terms of the signal-to-noise ratio (SNR), in addition to being free from long-period instrument disturbances (Zahradník and Plešinger Citation2010). A set of frequency bands is tested for inversion, and the proper frequency band was found at 0.05 to 0.07 Hz. The 1-D velocity model of El Hadidy (Citation1995) is adopted in the hypocentre location and inversion process (). El Hadidy (Citation1995) obtained a velocity model of the northern part of the Eastern Desert using deep seismic sounding. Several authors have used this model (e.g. Abou El-Enean Citation1997) to model the velocity structure in the northern part of the Western Desert.
Figure 4. The velocity model used for MTI (El Hadidy Citation1995).
4. MTI and the source mechanism
The full-waveform inversion ISOLA code allows for point- and multiple-point-source iterative deconvolution (Kikuchi and Kanamori Citation1991). The moment tensor is retrieved by reducing the difference between the observed and synthetic displacement in the least-squares sense. At the same time, the location and origin time of the point sources are grid-searched to decrease the uncertainty in the location.
It starts by calculating Green’s function to yield the synthetic displacements for the vertical, radial, and transverse components at the defined receiver’s position using the discrete wavenumber method (Bouchon Citation1981; Coutant Citation1989). The associated uncertainty in the depth of the hypocentre is treated by performing the point-source inversion for a series of trial source positions lying at various depths below the epicentre. Fifteen trial source depths are tested with a 2 km vertical interval: spanning from 5 to 33 km. The time grid search is carried out by 0.12 s time step (∆t) within ±4 sec from the origin time. The synthetic displacements with 327.68 s window length are computed at each receiver based on the location of the source, the 1-D velocity model, and the receiver’s positions. The observed data is corrected using the transfer function of the seismometer and resampled to 25 Hz. A band-pass filter between 0.05 and 0.7 Hz is applied to both observed and synthetic data.
The correlation (corr) between the observed (obs) and synthetic (syn) seismograms is determined at every depth in terms of variance reduction (VR) which is defined as;
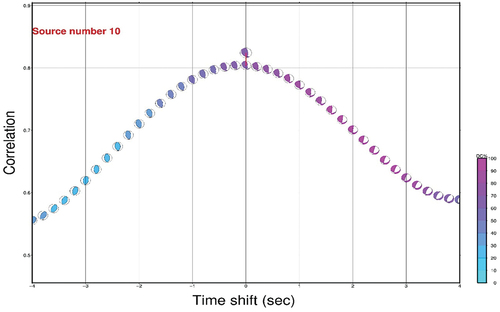
In the analysis process, the waveform inversion for the defined set of depths (5–32 km) yielded a stable faulting mechanism over all the trial depths (). It is noted that the best solutions occurred between 21 and 33 km focal depths with a dominant double-couple percentage. The optimal solution is found at 25 km focal depth, and the correlation between the synthetic and observed data is 77% which can be considered a good fit. The time grid search showed that the optimal centroid time of the El-Negalah earthquake is the same as the origin time ().
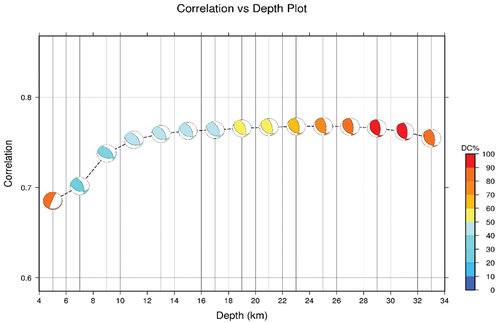
Figure 5. A). The correlation ratio for the seismic source mechanism for the El-Negalah earthquake is obtained at various trial depths using the vertical grid search method. The scale on the right side shows the beach ball’s double-couple percentage (DC %). B). Optimum verification of the depth of the El-Negalah earthquake using the time grid search method.
The waveform matching shown in is good, which confirms the robustness of the adopted crustal model and the realism of the obtained source mechanism. It decreases with increasing the epicentral distance due to the poor SNR. The inverted source mechanism agrees well with the polarity of P-wave arrival. The obtained solutions indicated that the mechanism of the studied earthquake is a reverse faulting mechanism, and its parameters are shown in .
Figure 6. Waveform matching between observed displacement waveform presented in black and synthetic displacement waveform presented in red in the frequency range 0.05–0.07 Hz. Station codes appear at the right. The VR of the used components is represented by the numbers in the top right corner of each box and components with pale colours are excluded from the inversion.
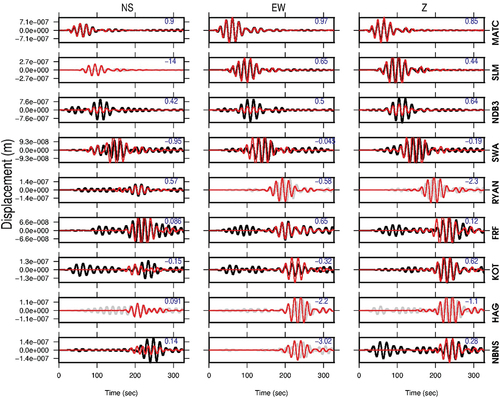
Figure 7. Fault plane solution (Strike 354°, Dip 58°, and Rake 116°) based on the MTI compared and the polarity of P-wave first arrivals.
5. Plausibility of obtained source mechanism
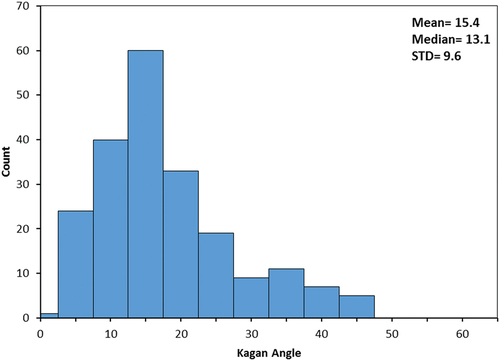
The plausibility of the obtained mechanism is analysed in terms of the relative assessment of the uncertainty and evaluation of its stability. The relative assessment of the uncertainty is performed by measuring the mean deviation angle between the optimum focal mechanism solution and the list of acceptable solutions (Sokos and Zahradník Citation2013), this angle is known as Kagan angle (Kagan Citation1991). We proposed that each solution has a correlation equal to 90 percent of the obtained mechanism (optimum solution) correlation is an acceptable solution. A histogram is plotted to visualise the deviation angle between each acceptable focal mechanism and the obtained optimum mechanism (). This histogram is physically interpreted based on its width, where small width refers to the coherency between the accepted solutions and in accordance with low relative uncertainty (Michele et al. Citation2014), or based on the mean value of Kagan angle, as a smaller mean value of the Kagan angle refers to low uncertainty (Fojtíková et al. Citation2016).
Figure 8. Kagan angle distribution of all acceptable solutions (the mean Kagan angle is 15.4°).
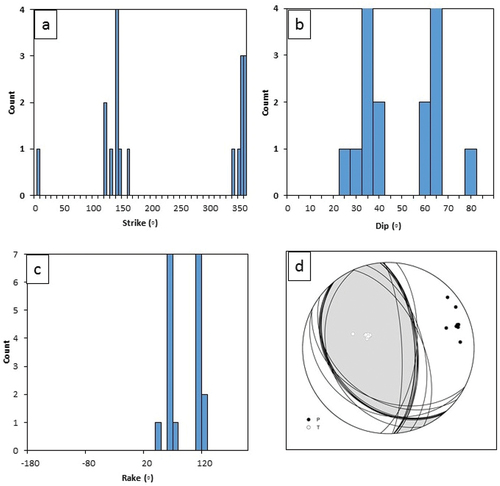
The stability in the obtained source mechanism is utilized based on the Jackknife test for seismic stations (Horalek et al. Citation2010; Horalek and Sıleny Citation2013; Hicks and Rietbrock Citation2015). The test measures the biasness of the obtained mechanism due to the seismic stations used in the inversion process. Jackknife tests are performed for the strike, dip, and rake angles () and show that the variations in these parameters are small and concentrated in narrow bands for the strike in the range of 330°–360°, from 55° to 65° for the dip, and 100°–130° for the rake. Moreover, the stereographic projection of the nodal planes is coherent with an almost stable focal mechanism (). These results are a good indicator of the stability of the obtained mechanism.
Figure 9. Jackknifing tests. Panel a shows a histogram for the calculated strike, b for the dip, c for the rake, and panel d shows the solid black dots representing the nodal planes, the pressure axis (P), and the white circles representing the tension axis (T).
6. Source parameters
The earthquake source is modelled by Brune (Citation1970, Citation1971) as a circular fault that has a tangential stress pulse applied to the interior of a dislocation surface. The stress pulse transmits a shear-stress wave normal to this dislocation surface. Brune’s model is subjected to some improvement (i.e. Hanks and Wyss Citation1972; Randall Citation1973; Madariaga Citation1977; Boatwright Citation1978) and the Fourier amplitude spectrum of this pulse is described for the far-field displacement ( by the following equation:
Where is the amplitude low-frequency spectral level (plateau), the exponential part is for the attenuation along the ray path where
average attenuation along the path,
is the corner frequency, and
is the high-frequency falloff (
in Burne model).
Other source parameters can be calculated based on , such as the radius of the circular fault (L) as follows:
Seismic source parameters are the seismic moment (M0), stress drop (Δσ), rupture length (L), and displacement of the source (d0). Parolai et al. (Citation2007) used these parameters to characterise the different types of seismic sources and to estimate the Ground Motion Prediction Equations (GMPEs). On the other hand, Boore (Citation2003) used the source parameters as the main inputs in the ground motion simulation and seismic hazard assessment.
The source parameters of the 11 April 2020, earthquake are calculated using the S-wave amplitude displacement spectra and considering the S-wave velocity of the implemented velocity structure model. The data implemented in the current study consists of the records of four rocky site high-quality broadband stations of the ENSN. These stations are located at epicentral distances ranging from 41 km to 280 km. The raw data is tested by using different window lengths. The selected window length ranges between 2.5 and 3.5 seconds to avoid the contamination of the other phases. The selected windows are processed by re-meaning, re-trending, tapered, filtered between 0.5 and 10 Hz to remove the undesired signals, and finally, converted to the displacement record.
The M0, L, Δσ and d0 are derived from the displacement spectra of the S-wave following Brune’s (Citation1970, Citation1971), Hanks and Wyss (Citation1972), and Kanamori (Citation1977) equations:
Where ρ is the rock density, Vp and Vs are the primary wave and shear wave velocities at the depth of the hypocentre, R is the hypocentral distance and Rθφ is an average value of the radiation pattern and supposed herein to equal 0.6 as assumed by Boore and Boatwright (Citation1984) and used by Abou Elenean and Hussein (Citation2007) for determining the source parameters of some earthquakes in Egypt.
The estimated source parameters are shown in . While shows the spectra used to derive the source parameters.
Figure 10. The displacement spectra for stations MAT, SLM, and SWA stations used to derive the source parameters.
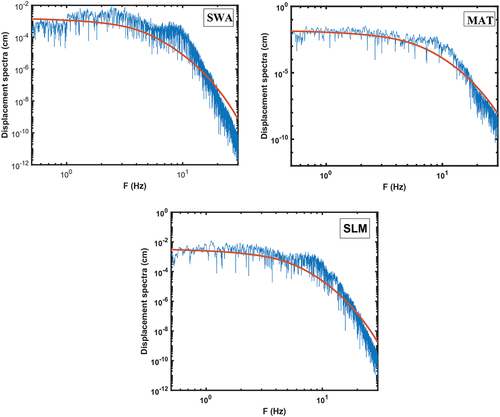
Table 2. The calculated source parameters for April 2020 earthquake.
7. Discussion and conclusion
The northernmost Western Desert in Egypt is part of the African continental margin. Its tectonic setting is a meaningful research point due to its importance for the region’s ongoing hydrocarbon explorations and seismic hazard analysis. Moreover, a question usually arises about extending the compressional tectonic regime to the African continental margin (Badawy et al. Citation2015).
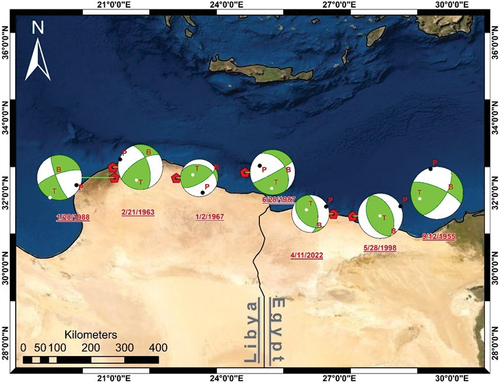
The most significant earthquake along the African margin, at a few tens of kilometres of the Egyptian coast, is Ras Elhikma earthquake with 5.4 Mw (Abou Elenean and Hussein Citation2007) located about 30 km to the east of the April 2020 earthquake. The two previously mentioned earthquakes show similar faulting of high-angle reverse mechanisms with negligible strike-slip movement, as indicated by . The accurate determination of the depth of such earthquakes is a challenging mission due to the lack of seismological stations along the northern coast of Egypt and ocean-bottom seismometers in the southern part of the Mediterranean Sea. A robust relocation process is performed to present a precise analysis of the studied earthquake. This step removed the uncertainty in the hypocentre parameters which has a negative effect on the inversion of the source mechanism. The full-waveform inversion technique is applied to define the moment tensor of the quake. The uncertainties in the depth of the hypocentre and the origin time are treated by performing a depth grid search and a time grid search. The defined set of depths (5–32 km) yielded a stable faulting mechanism over all trial depths. The time grid search shows that the optimal time of the studied earthquake is the same as the origin time. Which confirms the reliability of the velocity model applied in both relocation and inversion processes. The optimal source mechanism solution is at 25 km focal depth and it coincides with the estimated depth of the 1998 Ras Elhikma earthquake 22 − 25 km (Abou Elenean and Hussein Citation2007). Also, the obtained source mechanism shows a reverse faulting mechanism which agrees with the faulting mechanism of the Ras Elhikma earthquake and the reverse faulting mechanism in the Northern Eastern part of Libya (Abou El-Enean Citation1993).
Figure 11. Focal mechanism solutions of the significant earthquakes that occurred along the African continental margin (After Abou Elenean Citation1997; Abou Elenean and Hussein Citation2007; Centroid Moment Tensor Online Bulletin).
With the result of this study, the source parameters are estimated using the P-wave amplitude displacement spectra. The resulting parameters indicate that the seismic moment is 8.9 × 10¹⁵ Nm, the fault radius (L) is equal to 3829 m, the stress drop is about 3.8 MPa and the displacement is 0.053 m. The analysis of the seismic source has fundamental importance for the evaluation of seismic hazard, particularly for critical facilities and for the safe exploration of hydrocarbon reserves in the region.
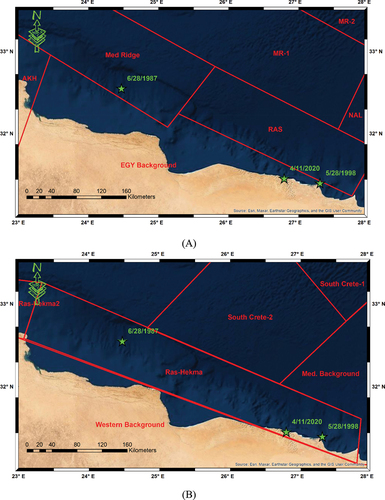
Such significant and rare events are used in the identification, modification and/or confirmation of the geometry of the seismic sources included in the source models used in the seismic hazard assessment. shows the spatial distribution of the significant earthquakes located along the eastern segment of the African Continental margin and the boundaries of Ras El Hikma seismic source. The Ras El Hikma seismic source was delineated by Abou El-Enean (Citation2010) and Mohamed et al. (Citation2012) as shown in . This figure shows that the Ras El Hikma seismic source (Ras El Hikma source shown in ) defined by Mohamed et al. (Citation2012) is more compatible with recent seismicity pattern than the RAS (shown in ) seismic source delineated by Abou El-Enean (Citation2010). Mohamed et al. (Citation2012) and Ezzalarab et al. (Citation2016) mentioned that the maximum expected earthquake that can generate in Ras El Hikma is Mw-6.3.
Figure 12. Panel (A) shows the significant seismic activity in the African Continental margin and the seismic sources delineated by Abou El-Enean (Citation2010). Panel (B) shows the significant seismic activity in the African Continental margin and the seismic sources delineated by Mohamed et al. (Citation2012). Green stars represent the significant earthquakes, and red polygons are the seismic sources. AKH is Gebel Al-Akhder seismic source, Med-Ridge is the Mediterranean Sea Ridge seismic source, MR-1 is the Mediterranean Sea-1 seismic source, RAS is Ras Elhikma seismic source, MR-2 is the Mediterranean Sea-2 seismic source, NAL is north Alexandria seismic source, EGY is Egypt Background seismic source. Western Background is the Western Desert Background Seismic source.
From this study, it is concluded that these findings confirm the occurrence of an active seismic source close to the Northern Coast of Egypt. The April 2020 earthquake is mainly related to the tectonic setting of this region, which is related to the compression stresses resulting from the relative movements between the African and Eurasian plates, this is in a good agreement with the reverse faulting sense of motion of April 2020 earthquake focal mechanism. The preferred fault causing this earthquake is trending NW-SE. Also, there is a good agreement with the focal mechanism of Ras El Himka earthquake with reverse faulting with properly NW-SE trending. This supports the idea of occurring these two earthquakes in one seismic source. This seismic source generates earthquakes which may affect the urban areas and new investments in the north western part of Egypt. Therefore, this seismic source must be considered in seismic hazard studies for northern Egypt, especially in-case of the critical facilities. Authors recommend adding more seismic stations along the northern coast of Egypt and employment of ocean bottom seismometers in the southern Mediterranean Sea to increase the accuracy of hypocentres determination along the African continental margin.
Disclosure statement
No potential conflict of interest was reported by the author(s).
References
- Abdalzaher MS, El-Hadidy M, Gaber H, Badawy A. 2020. Seismic hazard maps of Egypt based on spatially smoothed seismicity model and recent seismotectonic models. Journal of African Earth Sciences. 1464-343X, 170:103894. doi:10.1016/j.jafrearsci.2020.103894.
- Abdel Rahaman M, Tealeb A, Mohamed A, Deif A, Abou Elenean K, El-Hadidy MS. 2008. Seismotectonic zones at Sinai and its surrounding. In First Arab Conference on Astronomy and Geophysics.
- Abou El-Enean K. 1993. Seismotectonics of the Mediterranean region north of Egypt and Libya, M. Sc. Thesis, Fac. of Sci., Mansoura Univ., Egypt, 198.
- Abou El-Enean K. 1997. A study on the seismotectonics of Egypt in relation to the Mediterranean and Red Sea tectonics. Ph.D. Thesis, Ain Shams Univ., Egypt. 200.
- Abou El-Enean K. 2010. Seismotectonics studies of El-Dabaa and its surroundings. Unpublished Report.
- Abou Elenean KM, Hussein HM. 2007. Source mechanism and source parameters of May 28, 1998 earthquake, Egypt. Journal of Seismology. 11(3):259–274. doi:10.1007/s10950-007-9051-5.
- Aksu AE, Calon TJ, Hall J, Mansfield S, Yaşar D. 2005. The Cilicia–Adana basin complex, Eastern Mediterranean: Neogene evolution of an active fore-arc basin in an obliquely convergent margin. Marine Geology. 221(1–4):121–159. doi:10.1016/j.margeo.2005.03.011.
- Badawy A, Korrat I, El-Hadidy M, Gaber H. 2017. Update earthquake risk assessment in Cairo. Egypt. J Seismol. 21(4):571–589. doi:10.1007/s10950-016-9621-5.
- Badawy A, Mohamed G, Omar K, Farid W. 2015. The northern Egyptian continental margin. Journal of African Earth Sciences. 101:177–185. doi:10.1016/j.jafrearsci.2014.09.009.
- Boatwright J. 1978. Detailed spectral analysis of two small New York State earthquakes. Bulletin of the Seismological Society of America. 68(4):1117–1131.
- Boatwright J. 1980. Preliminary body-wave analysis of the St. Elias, Alaska earthquake of February 28, 1979. Bulletin of the Seismological Society of America. 70(2):419–436. doi:10.1785/BSSA0700020419.
- Boore DM. 2003. Simulation of ground motion using the stochastic method. Pure and Applied Geophysics. 160(3–4):635–676. doi:10.1007/PL00012553.
- Boore DM, Boatwright J. 1984. Average body-wave radiation coefficients. Bulletin of the Seismological Society of America. 74(5):1615–1621. doi:10.1785/BSSA0740051615.
- Bormann P, Wendt S, DiGiacomo D. 2013. Seismic sources and source parameters. In: Bormann P, editor. IASPEI New Manual of Seismological Observatory Practice. Potsdam: Deutsches GeoForschungsZentrum GFZ; vol. 2; p. 1–259.
- Bosworth W, El-Hawat AS, Helgeson DE, Burke K 2008. Cyrenaican “shock absorber” and associated inversion strain shadow in the collision zone of northeast Africa. Geology. 36(9):695–698. https://doi.org/10.1130/G24909A.1
- Bosworth W, Stockli DF, Helgeson DE. 2015. Integrated outcrop, 3D seismic, and geochronologic interpretation of Red Sea dike-related deformation in the Western Desert, Egypt–The role of the 23 Ma Cairo “mini-plume”. Journal of African Earth Sciences. 109:107–119. doi:10.1016/j.jafrearsci.2015.05.005.
- Bouchon M. 1981. A simple method to calculate Green’s functions for elastic layered media, Bull. Seismol. Soc. Am 71(4):959–971. doi:10.1785/BSSA0710040959.
- Brune JN. 1970. Tectonic stress and the spectra of seismic shear waves from earthquakes. Journal of Geophysical Research. 75(26):4997–5009. doi:10.1029/JB075i026p04997.
- Brune JN. 1971. Correction to tectonic stress and the spectra of seismic shear waves from earthquakes. J. Geophys. Res. 76(20):5002.
- Coutant O. 1989. Program of numerical simulation AXITRA Tech. Rep., LGIT. Grenoble: France (in French).
- Deif A, Abou Elenean K, El Hadidy M, Tealeb A, Mohamed A. 2009. Probabilistic seismic hazard maps for Sinai Peninsula, Egypt. Journal of Geophysics and Engineering. 6(3):288–297. September. doi:10.1088/1742-2132/6/3/008
- Dobrynina AA. 2009. Source parameters of the earthquakes of the Baikal rift system. Izvestiya. Physics of the Solid Earth. 45(12):1093. doi:10.1134/S1069351309120064.
- El Gazzar AM, Moustafa AR, Bentham P. 2016. Structural evolution of the Abu Gharadig field area, Northern Western Desert, Egypt. Journal of African Earth Sciences. 124:340–354. doi:10.1016/j.jafrearsci.2016.09.027
- Elhadidy Mahmoud MS, Abdalzaher HG. 2021. Up-to-date PSHA along the Gulf of Aqaba-Dead Sea transform fault. Soil Dynamics and Earthquake Engineering. 106835, , 148:0267–7261. doi:10.1016/j.soildyn.2021.106835.
- Erdik M, Sesetyan K, Demircioglu MB, Tuzun C (2012). Assessment of seismic hazard in the Middle East and Caucasus: EMME (Earthquake Model of Middle East). project – Proc of 15th World Conference on Earthquake, Greece.
- Ezzelarab M, Shokry MMF, Mohamed AME, Helal AMA, Mohamed AA, El-Hadidy MS. 2016. Evaluation of seismic hazard at the northwestern part of Egypt. Journal of African Earth Sciences.113. 113:114–125. doi:10.1016/j.jafrearsci.2015.10.017
- Fojtíková L, Kristeková M, Málek J, Sokos E, Csicsay K, Zahradník J. 2016. Quantifying capability of a local seismic network in terms of locations and focal mechanism solutions of weak earthquakes. Journal of Seismology. 20(1):93–106. doi:10.1007/s10950-015-9512-1.
- Gaber H, El-Hadidy M, Badawy A. 2018. Up-to-date Probabilistic Earthquake Hazard Maps for Egypt. Pure Appl. Geophys. 175(8):2693–2720. doi:10.1007/s00024-018-1854-5.
- Garfunkel Z. 2004. Origin of the Eastern Mediterranean basin: a reevaluation. Tectonophysics. 391(1–4):11–34. doi:10.1016/j.tecto.2004.07.006.
- Goudarzi GH, GH G (1980). Structure-Libya.
- Guiraud R 1998. Mesozoic rifting and basin inversion along the northern African Tethyan margin: an overview. Geological Society Special Publication. 132:217–229. https://doi.org/10.1144/GSL.SP.1998.132.01.13
- Hadidy EL. 1995. Crustal structure and its related causative tectonics in northern Egypt using geophysical data. Ain Shams University: Ph.D. Thesis.
- Hanks TC, Wyss M. 1972. The use of body-wave spectra in the determination of seismic-source parameters. Bulletin of the Seismological Society of America. 62(2):561–589. doi:10.1785/BSSA0620020561.
- Hassoup A, Tealeb A. 2000. Attenuation of intensity in the northern part of Egypt associated with the May 28, 1998 Mediterranean earthquake. Acta Geophysica Polonica. 48(1):79–92.
- Hicks S, Rietbrock A. 2015. Seismic slip on an upper-plate normal fault during a large subduction megathrust rupture. Nature Geoscience. 8(12):955–960. doi:10.1038/NGEO2585.
- Horalek J, Jechumtalov Z, Dorbath L, Sıleny J. 2010. Source mechanisms of micro-earthquakes induced in a fluid injection experiment at the HDR site Soultz-sous-Forets (Alsace) in 2003 and their temporal and spatial variations. Geophys. J. Int. 181:1547–1565. doi:10.1111/j.1365-246X.2010.04506.x
- Horalek J, Sıleny J. 2013. Source mechanisms of the 2000 earthquake swarm in the West Bohemia/Vogtland region (Central Europe). Geophys. J. Int. 194(2):979–999. doi:10.1093/gji/ggt138.
- Jechumtálová Z, Šílený J. 2005. Amplitude ratios for complete moment tensor retrieval. Geophysical Research Letters. 32(22):22. doi:10.1029/2005GL023967.
- Kagan YY. 1991. Seismic moment distribution. Geophysical Journal International. 106(1):123–134. doi:10.1111/j.1365-246X.1991.tb04606.x.
- Kanamori H. 1977. The energy release in great earthquakes. Journal of Geophysical Research. 82(20):2981–2987. doi:10.1029/JB082i020p02981.
- Kikuchi M, Kanamori H. 1991. Inversion of complex body waves. III, Bull. Seismol. Soc. Am. IIIrd ed. Vol. 81, p.2335–2350.
- Klein FW. 2002. User’s guide to HYPOINVERSE-2000. A Fortran Program to Solve for Earthquake Locations and Magnitudes. USGS Open File Report. 2:171.
- Kwiatek G, Plenkers K, Dresen G, Research Group JAGUARS. 2011. Source parameters of picoseismicity recorded at Mponeng deep gold mine, South Africa: implications for scaling relations. Bulletin of the Seismological Society of America. 101(6):2592–2608. doi:10.1785/0120110094.
- Madariaga R. 1977. Implications of stress-drop models of earthquakes for the inversion of stress drop from seismic observations. In: Stress in the Earth. Basel: Birkhäuser; p. 301–316.
- McClusky S, Balassanian S, Barka A, Demir C, Ergintav S, Georgiev I, Gurkan O, Hamburger M, Hurst K, Kahle H, et al. 2000. GPS constraints on plate motions and deformation in the Eastern Mediterranean: implications for plate dynamics. J. Geophys. Res 105(B3):5695–5719. 2000. doi:10.1029/1999JB900351.
- McClusky S, Reilinger R, Mahmoud S, Ben Sari D, Tealeb A. 2003. GPS constraints on Africa (Nubia) and Arabia plate motions. Geophysical Journal International. 155(1):126–138. doi:10.1046/j.1365-246X.2003.02023.x.
- Meshref WM. 1982. Regional structural setting of northern Egypt. In: Proceeding of the 6th Egyptian General Petroleum Corporation Exploration Seminar. Cairo; p. 17–34.
- Meshref WM. 1990. Tectonic framework of global tectonics. In: Said R, editor. The geology of Egypt. Rotterdam: AA Balkema; p. 439–449.
- Michele M, Custódio S, Emolo A. 2014. Moment tensor resolution: case study of the Irpinia Seismic Network, southern Italy. Bulletin of the Seismological Society of America. 104(3):1348–1357. doi:10.1785/0120130177.
- Mohamed A, El-Hadidy M, Deif A, Abou Elenean K (2012), Seismic hazard studies in Egypt, NRIAG J. of Astr. and Geoph.
- Moretti I, Kerdraon Y, Rodrigo G, Huerta F, Griso JJ, Sami M, Said M, Ali H. 2010. South Alamein petroleum system (Western Desert. Egypt). Pet Geosci. 16(2):121–132. doi:10.1144/1354-079309-004.
- Parolai S, Bindi D, Durukal E, Grosser H, Milkereit C. 2007. Source parameters and seismic moment–magnitude scaling for Northwestern Turkey. Bulletin of the Seismological Society of America. 97(2):655–660. doi:10.1785/0120060180.
- Randall MJ. 1973. Spectral peaks and earthquake source dimension. Journal of Geophysical Research. 78(14):2609–2611. doi:10.1029/JB078i014p02609.
- Said R. 1962. The Geology of Egypt, El-Sevier Publ. Co. New York: Amsterdam.
- SATO T, HIRASAWA T. 1973. Body wave spectra from propagating shear cracks. Journal of Physics of the Earth. 21(4):415–431. doi:10.4294/jpe1952.21.415.
- Sestini G. 1984. Tectonic and sedimentary history of the NE African margin (Egypt—Libya). Geological Society. London, Special Publications. 17(1):161–175. doi:10.1144/GSL.SP.1984.017.01.10.
- Sokos EN, Zahradnik J. 2008. ISOLA a Fortran code and a Matlab GUI to perform multiple-point source inversion of seismic data. Computers & Geosciences. 34(8):967–977. doi:10.1016/j.cageo.2007.07.005.
- Sokos E, Zahradník J. 2013. Evaluating centroid‐moment‐tensor uncertainty in the new version of ISOLA software. Seismological Research Letters. 84(4):656–665. doi:10.1785/0220130002.
- Vavryčuk V. 2007. On the retrieval of moment tensors from borehole data. Geophysical Prospecting. 55(3):381–391. doi:10.1111/j.1365-2478.2007.00624.x.
- Zahradník J, Plešinger A. 2010. Toward understanding subtle instrumentation effects associated with weak seismic events in the near field. Bull Seismol. Soc. Am. 100(1):59–73. doi:10.1785/0120090087.
- Zahran HM, Sokolov V, Roobol. 2016. On the Development of a Seismic Source Zonation Model for Seismic Hazard Assessment in Western. Arabia S, Seismol J. 20:747–769. 10.1007/s10950-016-9555-y