
ABSTRACT
Communities in North Africa and the Middle East are suffering from a lack of water supplies. In Egypt, this problem will be severe due to the expected shortage in River Nile supply. Therefore, looking for and investigating groundwater aquifers are the target. The current study is an attempt to investigate the Wadi El Assiuti area’s deep groundwater aquifer, which has been identified as a potential development, establishing new community. In this study, the available geophysical data were the gravity and aeromagnetic data. The interpretation of these data has been filtered using different filters. Also, Euler deconvolution and 2D gravity modeling were applied. The actual outcome of the interpretation is presented through the depth of the contour map of the basement surface and Nubian sandstone aquifers map. The primary structure directions are WNW-ESE, NW-SE and NE-SW, according to the maps. The patterns match the distribution of geomorphological units in Wadi El Assiuti. This means that the principal geomorphological units in the area are controlled by trends that originate in the bedrocks and extend upwards within the sedimentary layers. Basement rock depths range between 1.5 and 3.7 km. The Nubian sandstone aquifer has a thickness ranging from 300 to over 2000 m.
1. Introduction
Deserts represent about four-fifths of the Egyptian land. This leads to the congregation of the population around the Nile Valley and Delta. Therefore, several new projects have to be developed for new urban and agricultural and industrial communities in the Eastern and Western Deserts. Most projects rely entirely on shallow aquifers. However, the amount of groundwater in this aquifer is not sufficient to achieve sustainable development. Therefore, the current goal of the study is to explore deep aquifers to achieve water demand adequacy.
The deep aquifers in the area are two fractured limestone aquifers (FLA) and the Nubian sandstone aquifers (NSA) in the promising areas of Egypt. It has become an important issue. In Wadi El Assiuti, the carbonate rocks are outcropped on its surface. They are indicated by Neogene and Palaeogene carbonate rock outcrops, and encounter Palaeogene carbonate rocks underground.
The Nubian sandstone series has been established as the major aquifer throughout North Africa, not simply in Egypt’s Western Desert (Diab Citation1972).
The previous works of Wadi El Assiuti and its neighbourhoods were not considered as the aquifer of the deep Nubian sandstone and its significance as a groundwater resource. So, the current study is concentrated on examining the aquifer of the deep Nubian sandstone and determining its depth and thickness in the area bounded by latitude 27° 00′ to 28° 00′ N and longitude 31° 00′ to 33° 00′ E. Additionally, structural framework of the area’s basement complex is inspected ().
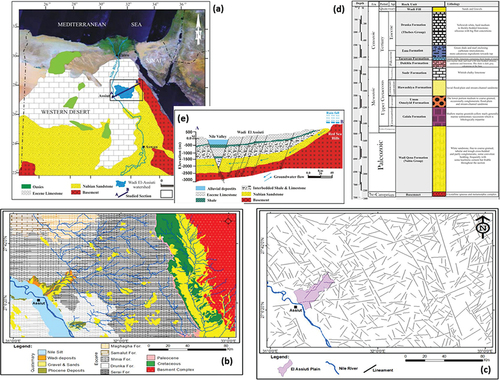
Figure 1. (a) Location map of the study area, (b) a geological cross-section (a,b, Fig. 1) crossing the study area (modified after RIGW, Citation1993), (b) geological map (modified after CONCO Citation1987), (c) structural geological map of the study area, (d) a geological cross-section (a,b, Fig. 1a) crossing the area (modified after RIGW, Citation1993) and (e) borehole data of RWEDEA well showing the subsurface geological sequence and different aquifers in the area.
These objectives were achieved using hydrogeological, potential data (aeromagnetic and gravity) to ascertain the research area’s underlying structure.
A variety of vintage Assiut Governorate producing wells were used to acquire subsurface rock measurements as well as the Research Institute of Groundwater Research’s newer monitoring wells (RIGW) and RWEDEA deep well drilled by the Apache Petroleum Company in Wadi Habib and reaching the basement surface was evaluated to estimate aquifers. In addition, two-dimensional aeromagnetic and gravitational modelling of nine profiles calibrated using the deep RWEDEA well was used to show the basement and deep layers (NSA) of the surface. The Wadi El Assiuti Basin is one of the Eastern Desert’s most important watersheds (). This valley’s drainage basin is dry and spans the Egyptian Eastern Desert, afar around 115 km, with a breadth of 5–25 km; as a result, the total area is approximately 5930 km2 (At Tia et al. Citation2016). Summers are dry and hot, with little rainfall, and winters are pleasant (Elewa Citation2008). Only once in a while, there is a burst of strong rain that causes floods (Ashmawy and Nassim Citation1998).
A new series of Lower Eocene sedimentary strata defines the Wadi El Assiuti area geologically (Said Citation1990) (). The Lower Eocene limestone sequence is made up of the Drunk and Minia formation. The entrance and exit to the research area are bordered by Lower Eocene limestone cliffs. The Madmoud formation, produced from early Pliocene clays, is followed by the Lower Eocene ascending sequence.
The Issawia and Armant formations are clastic deposits from the Lower Pleistocene (Protonile). The Upper Pleistocene Neonile Formation is the Dandara Formation (Said Citation1981). Mansour and Philobbos (Citation1983) and Said (Citation1990) pointed out that the Holocene sequence was composed of alluvial fan and sandy sediments.
Structurally, the study area is situated on Egypt’s steady shelf, and the major surface features correspond to the basement lines (Said Citation1962). The derived surface lines obtained from Landsat-8 using ARC GIS software show that the major trends of the fault system are NW, NE and N-S. The NW Fault System developed later in the faulting process than the NE Fault System. Unlike other fault systems that can link shallow and deep aquifers, the NW fault system is activated and demonstrates a greater degree of extension and continuity ().
2. Methodology and data
2.1. Hydrogeological data
In El Assiuti Wadi region, hydrogeological study has been conducted (Farrag et al. Citation2019; Elewa Citation2008; Yousef Citation2008; Far Rag Citation2005; Farrag Citation2007; El-Tahlawi et al., 2007; Abu El-Ella Citation1999).
The research area’s wells were all drilled into Quaternary or Pliocene aquifers, resulting in a cohesive hydrogeological system. The Quaternary aquifer, which reduces east of the study region, is the main aquifer in the Nile Valley and adjacent area.
According to a study of recent data from a deep-drilled oil well’s subsurface lithological log (RWEDEA) (, there appeared three main groundwater aquifers that are shallow quaternary aquifers, and two main deep aquifers of FLA and NSA.
The previous work on Wadi El Assiuti showed two possible sources for backfilling the shallow Quaternary reservoir which comes from infiltration of surface water together with the runoff streams by transport losses that mainly develop within the Quaternary alluvium aquifer or ascending discharge from the deep (NSA) through downward major faults () that feed the Quaternary aquifer (Attia Citation1989; Dawoud Citation1997; Warner et al. Citation1991; Yan et al. Citation2004; Da Woud et al. Citation2006; Dawoud and Ewea Citation2011).
2.2. Geophysical data
The current investigation was conducted utilising accessible geology and geophysical data from Sandwell’s Bouguer gravity data (Sandwell and Smith Citation2009; Sandwell et al. Citation2013, Citation2014). Also, the reduced to the pole (RTP) aeromagnetic map was compiled by EGPC, Citation1987. All these data were calibrated with the aid of the deep oil well drilled Wadi Habib.
The area’s subsurface geological condition was determined using aeromagnetic and gravity measurements. The subsurface structures were studied through interpretation of both quantitative and qualitative of the gravity map, and reduce to the pole aeromagnetic map (RTP) map of the area utilising Oasis Montaj Programs (Citation2007).
To determine the mean structural trends, certain filtering was done to the RTP aeromagnetic map, such as tilt derivative and vertical derivative, according to the qualitative interpretation. On the other hand, the gravity map was filtered to separate the regional components associated with deep seated supplies from the residual components associated with shallow seated supplies. The cut-off for the high and low pass filters is 0.01 cycle/km. Additionally, the apparent density filter was calculated at different subsurface level from gravity map to identify the affinities of the rock units and also the subsurface structural setting.
In this study, quantitative interpretations included 3D Euler Deconvolution, 2D magnetic models and gravity. Based on the results of these interpretations, the depth of the bedrock and the Nubian aquifer thickness were calculated, and the subsurface structure frame was determined. The next section provides an overview of the RTP aeromagnetic and its derivative, and gravity maps.
The magnitude of the magnetic anomaly ranges from 270 nT to +400 nT of the RTP aeromagnetic map (). Negative magnetic abnormalities are prominent in the region’s southwestern portion. As well as the northern part recorded low anomaly with −250 nT, where it is expected that the thick sedimentary sequence belongs to Upper Cretaceous sediments. The eastern parts of the region give positive anomalies to reach +300 nT, where there are outcrops of the basement rocks. The shape of the region’s RTP anomalies varies from circular and oval to irregular and has mainly NW-SE and NE-SW to N-S axis directions. Most of the axis elongation of the RTP anomalies which are more prevalent in the NW-SE direction could be the consequence of structures impacting the basement rocks and rejuvenating them upward through the sedimentary cover.
Figure 2. (a) RTP aeromagnetic map with locations of chosen profiles utilised for 2D aeromagnetic and gravity forwarded modelling, (b) first vertical derivative map and (c) tilt derivative map.
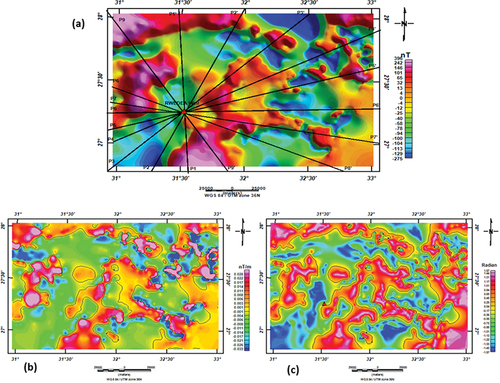
The first-order vertical derivative filter determines the magnetic field’s vertical rate of change and applies it to the RTP map. The first vertical derivative filter map is depicted in . The magnitude of the initial vertical derivative shows alternating positive and negative values. The positive value reached up to +0.028 nT/m, while the negative values reach −0.035 nT/m. Anomalies have a zero value at the edge source, and have positive and negative values based on their appearance on the source and outside the vertical edge source. The principle usefulness of the first vertical derivative map in magnetic interpretation is to indicate the outlines of individual intra-basement blocks or the edges of supra-basement disturbances by the value of the anomalies. The NW-SE direction is a predominating trend, and then the NE-SW and N-S trends come second.
Tilt derivative is computed by subtracting the vertical derivative of the aeromagnetic RTP map by the total horizontal derivatives in order to identify shallow geological sources and to calculate depth. The tilt derivative map () revealed that the tilt values vary from −1.57 to +1.57 radians and that the primary anomaly patterns are aligned along the NW-SE axis.
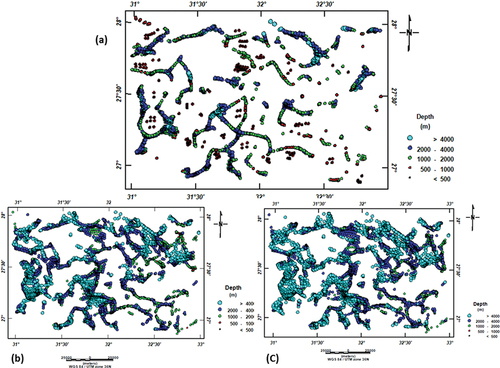
Euler deconvolution (ED) method is used for estimating depths and positions of subsurface geologic sources of magnetic anomalies on the RTP aeromagnetic map. It is an inversion technique that is utilised to figure out how deep and contoured source bodies are. This technique depends on applying the homogeneity equation of Euler. This formula, which connects the magnetic field and its gradient element with regard to the source position, can be viewed as a structural index with uniformity N (Thompson Citation1982). The structural index parameter values after Whitehead (Citation2010) indicated that if SI = 1 for sill and dyke, SI = 0.5 for thick step and SI = 0 for contact in magnetic.
ED technique was applied by using Oasis Montaj Program (Citation2014) with SI = 0, 0.5 and 1 to produce various solutions of magnetic field and choosing the best solutions indicates the best solution at SI = 0 which refers to fault/or contact. The magnetic sources were located at depths ranging from less than 500 m in the eastern south to 4000 m in the south and western north, with significant patterns of NW-SE and NE-SW.
Figure 3. Euler deconvolution maps when (a) SI = 0, (b) SI = 0.5 and (c) SI = 1.
The gravity anomaly map () displays that the gravity anomaly values increase at the northeastern and northwestern parts of the area with +70 mGal. At the southwestern part of the area, the gravity anomaly reaches a minimum value of −50 mGal. In many regions, gravity highs are connected with anticlines or uplifted blocks, two types of formations that transport older, denser materials closer to the surface. The shape of gravity anomalies in the area under investigation was mostly elongated to oval and some anomalies at the northeastern part on the map were linear belts. Zones of marked gradients are created by steep contacts between different rock types, many of which cross fault planes. These shapes gave idea about the structure nature of the buried body. The major gravity anomaly pattern is arranged along NW-SE direction at the northeastern part while there is a major gravity anomaly at NE-SW directions in the western part.
Figure 4. (a) Bouguer gravity map, (b) low-pass gravity filter map and (c) high-pass gravity filter map.
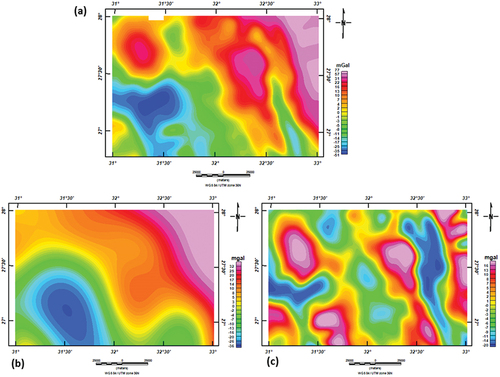
On the gravity map, low- and high-pass filters of a cut-off of 0. 001 cycle/km were applied to separate the regional and residual elements. illustrates a regional gravity map obtained using a low-pass filter and indicating deep-seated large amplitude abnormalities, where the abnormalities seem less sharp than the anomaly map due to the removal of smaller anomalies and sounds associated with high frequencies. The research area’s low-pass gravity filter can be divided into two distinct sections, separated by a zero gravity value. Positive gravity anomaly values range from 0 to 33 mGal in the northeastern section. Meanwhile, the southwestern section exhibits values of negative gravity ranging from −5 to −36 mGal. These two fundamental components comprise two distinct tectonic units. The largest linear abnormalities in the entire area exhibit a NW-SE trend with a gradual eastward gradient, implying large-scale step faults with eastward uplift of the basement rocks.
The residual gravity map can identify the local irregularities in the gravitational field map. These locals within the residual map () can shed more light on small-scale structures that cannot be easily detected from the gravity map. The residual map indicates that the magnitude of gravity values ranges from +20 to −20 mGal. It is defined by a series of modest ovals to elongated abnormalities that run the length of the study region. The major structural trends are in the NW-SE and NE-SW directions.
Calculations of apparent density: In this study, the interpretation of gravity data necessitates knowledge of the rock densities in the area, because all the analyses are related principally on the density values. Yet, no density logs are available, and typically the area covers some sort of wide part of the Eastern Desert. To overcome this problem, there is an attempt to calculate the apparent density values at different subsurface levels (separation or isolation). Considering the gravity anomaly map for any region is the cumulated gravity effect of the units of the different rock layers that make up the sedimentary section as well as the basement complex. The apparent density map gives a good figure about typically the configuration and structures within the basement included by sedimentary sequence.
The deep oil RWEDEA well provides vital information about the subsurface sedimentary sequence and at the same time extended to the basement surface at 2220 m (). The deep oil well shows that the sedimentary succession in the studied area above the basement complex is composed mainly of white sandstone (Nubian sandstone aquifer), Galala, Umm Omeiyied, Hawashiya, Sudr, Dakhla shale, Tarawan chalk, Esna shale and Drunka Formation as well as the wadi deposits (sands and gravel). This sedimentary sequence can be categorised as two rock units that overlie the basement complex depending on the characterising density. Beginning from the surface to a depth of 850 m below the ground surface, including the wadi deposits, Drunka Formation, Esna shale, Tarawan chalk, Dakhla shale and Sudr Formation, is considered as one unit. The depth of 850 m is chosen to cover and recognise most of the carbonate rocks. Meanwhile, the second rock unit starting from 850 m to the basement surface is composed of sandstone, where the Nubian sandstone aquifer is situated.
The filter technique of apparent density calculated was applied on the gravity map. This technique depends on computing density with depth. Two apparent density maps are built in the present study. The apparent density values are calculated at different subsurface levels with depths of 850 m and 2220 m, according to classify the subsurface sedimentary sequence into two main rock sedimentary units was made as well as the basement rocks. ) shows the apparent density-calculated map at depths 850 m and 2220 m in the studied area, respectively. These maps indicate that
Figure 5. Apparent density maps at depths 850 and 2200 m.
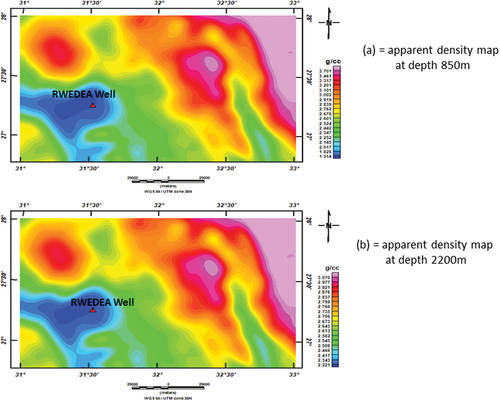
In the eastern section of the area, the spread of high-density and low-density anomalies shows shallow or outcrop basement rocks. The existence of basement rocks in the eastern parts of the study might be indicated by high-density values greater than 3 g/cm3, whereas low-density values less than 1.5 g/cc could be related to sedimentary rocks.
The sharpness or gradient for density anomalies increases when the depth increases to 2200 m. The gradient represented clearly between the high and low or, in other words, between contacts of sedimentary and basement rocks, or it could be between the basic and acidic igneous, or around the zones of abrupt sedimentary facies.
The linear anomalies are observed in various places at the area. These linear belts may be due to fractures (e.g. faults).
The trends of the density anomalies on the apparent density maps at depths 850 and 2200m having the NW-SE direction. This trend is the same as that observed on the Bouguer gravity map (). This means that the trends of the region’s regional structure are not significantly different through its tectonic history.
In approximately the southwestern part near Wadi Assiuti and the deep well, a large elongated anomaly was observed with a low apparent density of 1.5–1.9 g/cm3 at a depth of 850 m.
Meanwhile, this value increased with the increasing depth at 2200 m from 2.2 to 2.5 g/cm3. This indicates that fresh ground water has soaked the sediments (deep Nubian aquifer). Therefore, the density value increased by 1 g/cm3, which is the density value of water.
The apparent density values observed especially close to the deep well as control point at depths 850 m and 2220 m are 1.5 and 2.23 g/cm3 for two rock units’ receptivity.
The apparent density values extracted from this filter are used in the next part for processing 2D gravity and magnetic forward model and for calculating the depth of the Nubian sandstone.
3. Two-dimensional (2D) magnetic and gravity forward modelling
The second step of the interpretation data is the quantitative interpretation that is considered the backbone for all the data analyses and has the appropriate function in the interpretational process, in which it aids to recognise various geological constraints, including the location, depth, thickness, shape, and source’s composition.
Quantitative interpretation of field potential data used 2D Gravitational/Magnetic Interactive Building Package (GM-SYS Citation2007) run by Oasis Montaj (Citation2007) software. The 2D forward modelling consists of entering the density and magnetic susceptibility for every single layer for the program to compute.
According to the previous discussion, the density values derived from the apparent density of the sedimentary overburden in the study area are 1.5 g/cm3 for carbonate rocks and 2.23 g/cm3 for the Nubian sandstone and for the basement rocks, it was assumed to be 2.76 g/cm3. In contrast, suppose the magnetic susceptibility of the bedrock study area is between 0.03 and 0.035, with cgs as the unit. Magnetic declination of 2.82° east and magnetic field inclination of 39.83° are used to compute the magnetic field for the geological simulations. The intensity of the regional magnetic field employed is 41,966 nT.
Nine profiles were collected on the RTP and Bouguer maps, randomly assigned to cover all the study area (), designated as “P1P1“ to “P9P9”. These profiles were taken in all directions passing through the location of the available deep oil well. Modelling process takes deep oil well as control indicators.
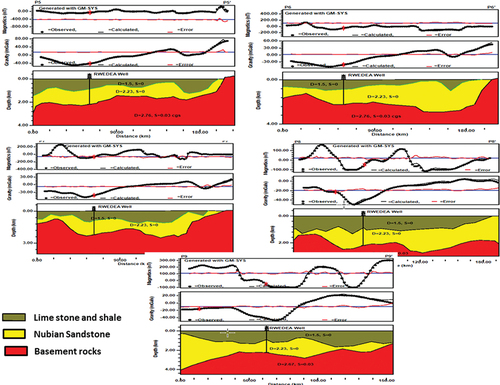
show the model derived from combined gravity and magnetic data. These models indicate that the sedimentary cover is classified into two units. The first unit represents the carbonate rocks that vary in thickness from 50 m to 1800 m. On the other hand, the second unit, which represents the Nubian sandstone apparent on the surface and extended to subsurface with thickness, ranged between 200 m and 2900 m.
Figure 6. 2D aeromagnetic and gravity modelling from “P1-P1” to “P4-P4”.
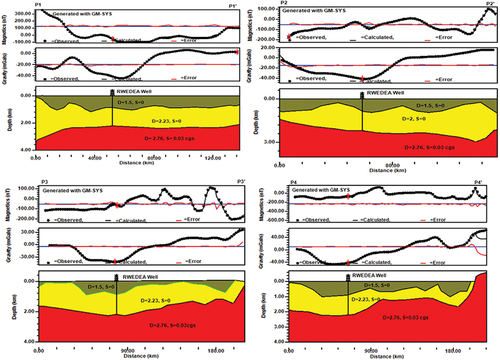
Figure 7. Cont. of 2D aeromagnetic and gravity modelling from “P5-P5” to “P9-P9”.
4. Results and discussion
The first step towards achieving the goal of the study was analysis of the gravity and RTP aeromagnetic data through qualitative and quantitative analyses. The qualitative interpretation includes separation and filtration of gravity and RTP map utilising low and pass filter and apparent density technique for gravity data. On the other hand, the first vertical and tilt derivative applying for aeromagnetic data. The results of qualitative interpretation were constructed as maps and shown in . These maps are dependent on a number of criteria that define these anomalies, including their size, shape, gradient, sharpness, magnitude and location of the anomaly source. The forms, sizes and directions of the anomalies retrieved from the tilt derivative map correspond to those of the first vertical derivative aberrations. These correlations may be verifying subsurface features with the area’s primary tectonics. The main anomalies pattern is perfectly aligned along WNW-ESE, NE-SW and NW. These tendencies correspond nicely to the major tectonic directions of Egypt’s Eastern desert.
To provide a valuable information on tectonic pattern in the area, the subsurface structures were studied through the interpretation processing of the gravity map and the RTP aeromagnetic map and its derivative by applying Gay method (Gay Citation1972). The tectonic lines obtained from these maps are considered faults based on the dense and zero contour lines. The Roc kware ver.14 (Citation2014) program was used to prepare the azimuth frequency diagrams.
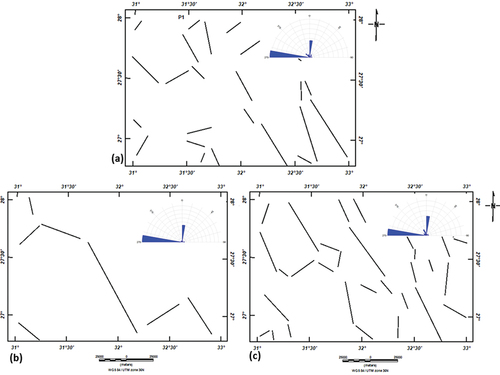
Aeromagnetic lineaments deduced from RTP and its derivative maps (initial vertical derivative, Tilt derivative and Euler deconvolution (SI = 0) maps) can be seen in . This figure indicates structure tectonics allocation of the trace lineament beside the azimuth frequency distribution of these lineaments. From the azimuth frequency diagram, which was derived using the aeromagnetic map and its derivative, additionally Euler deconvolution map when SI = 0, the most predominant trends are found in descending order of WNW, the NE and the NW trends. Gravity lineaments trends interpreted from the gravity anomaly maps and their azimuth frequency diagram are indicated in .
Figure 8. Structure trends determined using (a) the RTP aeromagnetic map and (b) the Euler deconvolution map (SI = 0). (c) Map of the tilt derivative. (d) Map of the analysed area’s first vertical derivative, together with the appropriate azimuth frequency diagram.
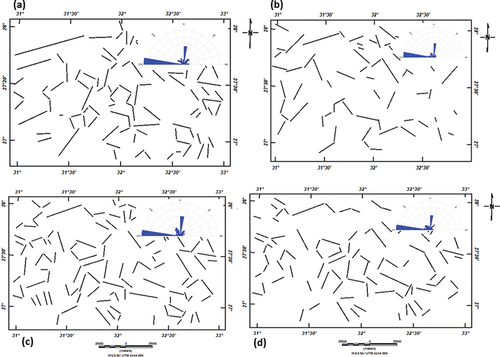
Figure 9. Structure trends as determined by (a) the Bouguer gravity map, (b) the low-pass filter map, (c) the high-pass filter map and the related azimuth frequency diagram.
4.1. Results
The results suggest that the major faults influencing the study region extend in the WNW-ESE direction in the first order of predominance, followed by the NW-SE and NE-SW directions in the second order.
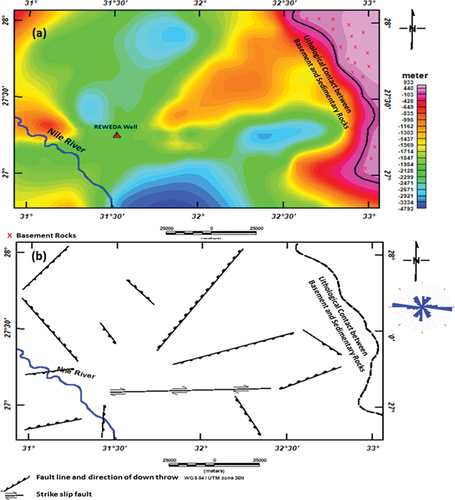
Quantitative interpretation includes the calculation of the depth of bedrock in the area and the calculation of the depth of the Nubian sandstone layer representing the deep Nubian sandstone aquifer. Two-dimensional (2D) gravity and aeromagnetic modelling, in addition to the 3D Euler deconvolution technique, was applied to calculate the basement rock’s depth. exhibits the basement surface topographic map concluded from 2D gravity and aeromagnetic models. The depth of the basement rocks ranges from 0.3 km to −3.7 km. The basement rocks appear on the surface (outcrops) in the eastern part of the area. The maximum depth values for the basement surface appear in the southern parts with −3.7 km. The average basement depth recorded in Wadi Habib and Wadi El Assiuti varies from −1.5 km to −3.0 km. The basement structure map is shown in . The basement tectonic map indicated that the fault trends are extending in WNW-ESE, NW-SE and NE-SW directions.
Figure 10. (a) Basement depth map derived from a 2D modelling of aeromagnetic and gravity data; (b) subsurface tectonic map created from the depth to basement map and azimuthal frequency diagram.
The Groundwater Institute (RIGW) was unable to reach the surface of the Nubian sandstone with the data obtained from historic production wells drilled in Assiut Governorate and current individual wells dug by the Groundwater Institute (RIGW) such as the record of the wells of the Ahalya Group No. 1 (as private wells) that were drilled (800 m) in Wadi Asiouti and well No. 2 (500 m). On the other hand, the subsurface lithological log obtained from the deep drilled oil well (RWEDEA) () points that the surface Nubian sandstone extends to 850 m and represents as a reference point to surface Nubian sandstone in this study.
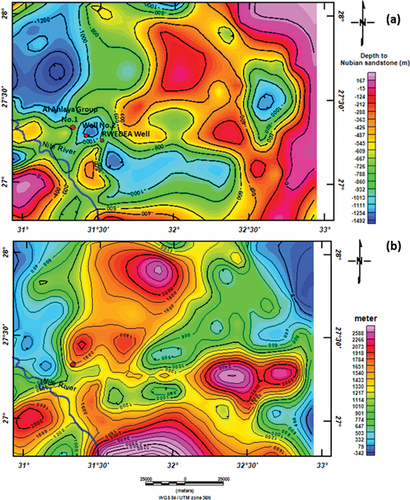
From a 2D modelling of gravity and aeromagnetic data, the depth of the Nubian sandstone surface map was extracted as a contour map (). This map shows that the depth of the Nubian sandstone layer range between −300 m and −700 m at Wadi El Assiuti and from −200 to −1500 m at Wadi Habib. The depth of the Nubian sandstone layer decreases until it reaches a zero value in the eastern direction of the area to appear on the surface.
Figure 11. (a) Nubian sandstone aquifer depth map derived from a 2D modelling of aeromagnetic and gravity data. (b) Nubian sandstone aquifer thickness map derived from a 2D modelling of aeromagnetic and gravity data.
The drawing of drilling a groundwater well on the new map of the surface of the Nubian sandstone indicates that the depth of the surface of the Nubian sandstone in the identical sites drilling boreholes (Al Ahlaya Group No. 1 and No. 2) achieved −850 m and −1100 m, respectively.
The thickness of the Nubian sandstone layer was constructed as a contour map and is shown in . This map indicates that the aquifer’s thickness increases in the direction of the Assiuti Valley and decreases upstream. This result matches with results of Sultan et al. (Citation2015) and Mohamed and Abu El-Ella (Citation2021). This fit can confirm the thickness of the Nubian sandstones that were obtained in this study.
5. Conclusions
The following are the major points that are concluded as the most significant findings of this study:
The basement rock’s depth varies from −1.5 km to −3.7 km.
The main lineament trends in the study area are WNW-ESE, whereas another small trend runs NE-SW and NW-SE.
The new map of the thickness of the Nubian sandstone aquifer was constructed. This map helps investigators and local authority in the field of water resource allocation and management.
The depth of the Nubian sandstone aquifer ranges from 200 m to over 2000 m.
Aquifer thickness increases downstream of Wadi El Assiuti and reduces upstream.
The depth of the Nubian sandstone layer ranges between 300 m and 700 m at Wadi El Assiuti and from −700 to −1200 m at the Wadi Habib and decreases in the eastern direction of the area until it appears on the surface.
Acknowledgments
Assiut University received financing from the Science and Technology Development Fund (Project ID: 25274). We would like to thank the editor and reviewers of the Arab Journal of Geosciences for their insightful comments and suggestions.
Disclosure statement
No potential conflict of interest was reported by the author(s).
Additional information
Funding
References
- Abu El-Ella E. 1999. Hydrogeochemical evolution of groundwater aquifers in the area east of Assiut Nile Basin, Egypt. Bull Fac Sci Assiut Univ. 28:1–16.
- Ashmawy MH, Nassim AS. 1998. Hydrological impacts and assessment of morphometric aspects of Wadi El Assiuti Basin, Eastern Desert, Egypt. Egypt J Remote Sens Sp Sci. 6:207–232.
- Attia FA. 1989. Use of groundwater for irrigation in the Nile Valley. Canada: Butterworth & Co. Ltd.
- At Tia MKK, Shendi MM, El-Desoky MA, Mohamed AG. 2016. The use of RS and GIS for assessment of Wadi El-Assiuty soils. Egypt Assiut J Agric Sci. 47:192–220. doi: 10.21608/ajas.2016.2100.
- Conco Corporation. 1987. The geologic map of Egypt, Scale 1:500,000. Cairo, Egypt: General Petr Corp.
- Dawoud MA (1997): The numerical simulation for groundwater condition in West Tahta region. M.Sc Thesis, Faculty of Engineering, Ain Shams University, Cairo, Egypt.
- Da Woud MA, El Arabi NE, Khater AR, van Wonderen J. 2006. Impact of rehabilitation of Assiut Barrage, Nile River, on groundwater rise in urban areas. J Afr Earth Sci. 45(4–5):395–407. doi: 10.1016/j.jafrearsci.2006.03.013.
- Dawoud MA, Ewea HAR. 2011. Sustainable development via optimal integration of surface and groundwater in arid environment: Nile River quaternary aquifer case study. J King Abdulaziz Univ: Metrol Environ Arid Land Agric Sc. 142(575):1–53.
- Diab MS. (1972): Hydrogeological and hydrochemical studies of the Nubian sandstone water bearing complex in some localities in United Arab Republic. Ph.D. Thesis, Faculty of Sciences, Assuit University, 241
- E.G.P.C. and CONOCO Coral Company. 1987. Geological Map of Egypt, Scale 1: 500,000 Cairo, Egypt.
- Elewa HH. 2008. Prediction of future drawdown of water levels of the Pleistocene aquifer system of Wadi El-Assiuti Area, Eastern Desert, Egypt, as a criterion for management and conservation. Resour Conserv Recycl. 52(7):1006–1014. doi: 10.1016/j.resconrec.2008.03.006.
- Far Rag AA. 2005. The hydraulic and hydrochemical impacts of the Nile system on the groundwater in upper Egypt. Ass Univ Bull Environ Res. 8:87–102.
- Farrag AA, (2007): On the groundwater assessment and management in Wadi El-Assiuti, Eastern Desert, Egypt. Proceedings of the Fifth International Conference on the Geology of Africa. Assiut, Egypt, pp. 15–48.
- Farrag AA, Ebraheem MO, Sawires R, Ibrahim HA, Khalil AL. 2019. Petrophysical and aquifer parameters estimation using geophysical well logging and hydrogeological data, Wadi El-Assiuoti, Eastern Desert. Egypt J Afr Earth Sci. 149:42–54. doi: 10.1016/j.jafrearsci.2018.07.023.
- Gay SP Jr. 1972. Fundamental characteristics of aeromagnetic lineaments, their geologic significance, and their significant to geology. Salt Lake City, Utah: “The New Basement Tectonics” American Stereo Map Company. p. 94 P.
- GM-SYS Programs. 2007. Gravity and magnetic modeling, version 6.4.2 (HJ), Inc Suit 500. West Toronto, ON Canada N5SIV6: Richmound St.
- Mansour HH, Philobbos IR. 1983. Lithostratigraphic classification of the surface Eocene carbonate of the Nile Valley, Egypt. Bull Fac Sci Assiut Univ. 2(2):129. 153.
- Mohamed A, Abu El-Ella E. 2021. Magnetic applications to subsurface and groundwater investigations: a case study from Wadi El Assiuti, Egypt. Int J Geosci. 12(2):77–101. doi: 10.4236/ijg.2021.122006.
- Montaj Programs O. 2014. Geosoft mapping and processing system: version 8.3 (HJ). In: c Suit 500, Richmound St. West Toronto, ON Canada N5SIV6.
- Oasis Montaj Programs. 2007. Geosoft mapping and processing system: version 6.4.2 (HJ). West Toronto, ON Canada N5SIV6: Inc Suit 500, Richmound St.
- RIGW. 1993. Hydrogeological Map of Egypt, Asyuti Sheet. Cairo: Research Institute for Groundwater, Academy of Scientific Research and Technology, Cairo.
- Rockware ver.14. 2014. Rockware incorporation for earth science and GIS software. USA.
- Said R. 1962. Geology of Egypt. Amsterdam, The Netherlands: Elsevier Publishing Company.
- Said R. 1981. The Geological evaluation of the River Nile. Springer Verlag R; p. 174. doi:10.1007/978-1-4612-5841-4.
- Said R,(1990): “The Geology Egypt”, A.A. BBalkeme. RoHerdam –Broof Field, P. 734.
- Sandwell DT, Garcia E, Soofi K, Wessel P, Smith WHF, Smith WHF. 2013. Towards 1 mGal Global Marine Gravity from CryoSat-2, Envisat, and Jason-1. The Leading Edge. 32(8):892–899. doi: 10.1190/tle32080892.1.
- Sandwell DT, Müller RD, Smith WHF, Garcia E, Francis R. 2014. New global marine gravity model from CryoSat-2 and Jason-1 reveals buried tectonic structure. Science. 346(6205):65–67. doi: 10.1126/science.1258213.
- Sandwell DT, Smith WHF. 2009. Global marine gravity from retracked Geosat and ERS-1 altimetry: ridge segmentation versus spreading rate. J Geophys Res. 114:B01411. doi: 10.1029/2008JB006008.
- Sultan SA, Sabet HS, El Zahar AM. 2015. Re-evaluation of the geophysical interpretation for groundwater exploration at Wadi Elassiuti. Int J Innovative Sci Eng Technol. 2(12). 527–544.
- Thompson DT. 1982. EULDPH: a new technique for making computer-assisted depth estimates from magnetic data. Geophysics. 47(1):31–37. doi: 10.1190/1.1441278.
- Warner JW, Gates TG, Attia FA, Mankarious WF. 1991. Vertical leakage in Egypt’s Nile Valley: estimation and implications. J Irrig Drain Eng ASCE. 117(4):515–533. doi: 10.1061/(ASCE)0733-9437(1991)117:4(515).
- Whitehead N. 2010. montaj Grav/Mag Interpretation, tutorial and user guide, Geosoft Incorporated.
- Yan E, Wagdy A, Sultan M, Becker R, (2004): Assessment of renewable groundwater resources in the Assiuti hydrologic system of the Eastern Desert, Egypt. In Second Regional Conference on Arab Water, action plans for integrated development, 1–4.
- Yousef AF. 2008. The impact of North west active fault system on the recharge of the quaternary aquifer system around the Nile valley: case study Wadi El-Assiuty, Eastern desert, Egypt. Eur Water. 21(22):41–55.