
 ?Mathematical formulae have been encoded as MathML and are displayed in this HTML version using MathJax in order to improve their display. Uncheck the box to turn MathJax off. This feature requires Javascript. Click on a formula to zoom.
ABSTRACT
Global geomagnetic models are a compilation of existing magnetic data which were reprocessed and freely made available as 2 or 3 arc minute resolution grids at 0-km or 4–5-km altitude relative to the geoid. Thus, many researchers rely on those data due to their open access. This study aims at evaluating freely released global geomagnetic models with respect to aeromagnetic data which are the original data, usually subjected to third party or commercial restrictions in Cameroon. Hence, both global geomagnetic models and aeromagnetic data were sampled along 4 profiles for assessment. The extracted data were analysed using Pearson’s correlation coefficient depicted in tables. The Power Spectrum Density curves of both aeromagnetic and their respective global geomagnetic grids were computed and displayed as graphs. The results show that the so-claimed 4–5-km altitude relative to the geoid of global geomagnetic models is heterogeneous in Cameroon since the spectral content of those models vary from 5–20 km. Besides, considerable discrepancies were observed with Earth Magnetic Anomaly Grid version 3 (EMAG2v3) data, indicating that they are not reliable for scientific studies based in Cameroon. This study provides insights on global geomagnetic models and could aid in optimizing the use of those models in Cameroon.
1. Introduction
The Earth magnetic field derives from three principal components: (1) the external field originating from the magnetosphere, mainly influenced by solar activity; (2) the field generated from the mantle, crust and anthropic activities; and (3) the internal field from the Earth core (Meyer et al. Citation1985), representing 95% of the total field. Besides, the Earth magnetic field is mathematically described from a compilation of existing marine, airborne, satellite measurements, freely made available as global geomagnetic models (Backus et al. Citation1996). The advent of those models was associated with the availability of the CHAMP satellite (Reigber et al. Citation2002) which allows the computation of global spherical harmonic models of the lithospheric field (Maus et al. Citation2008) and the substitution of longest wavelengths of more than 330 km in original magnetic data.
Global magnetic models are commonly used for resources (mineral, geothermal, etc.), geological, and tectonic investigations, and also for the study of the lithospheric evolution such as crustal-deep mantle interaction and plate tectonics (Idarraga-García and Vargas Citation2018; Oehler et al. Citation2018; Njeudjang et al. Citation2020, Citation2023; Njiteu Tchoukeu et al. Citation2021; Mohamed and Al Deep Citation2021; Pamuk and Özsöz Citation2022; Cheunteu Fantah et al. Citation2022; Lei et al. Citation2022). In addition, the consistency and higher resolution of those geomagnetic models are usually required for the regional-scale mapping of depth to the bottom of magnetic layer (DBML) also called the Curie point depth (Xu et al. Citation2017; Li et al. Citation2017; Njeudjang et al. Citation2020; Özsöz Citation2021; Prasad and Dubey Citation2023). Hence, due to their open access and broad applications, global geomagnetic models have been extensively used worldwide. Among those models, Earth Magnetic Anomaly Grid version 2 (EMAG2v2) data have mostly been utilised for DBML estimations in several areas such as: in the north China (Xu et al. Citation2017), in Turkey (Pamuk Citation2019; Pamuk and Özsöz Citation2022), in the Adamawa region, Cameroon (Njeudjang et al. Citation2020, Citation2022), and in the whole African continent (Mohamed and Al Deep Citation2021). Other studies were based on the extraction of tectonic structures from the interpretation of EMAG2v2 data (Basseka et al. Citation2016; Anaba Fotze et al. Citation2019; Cheunteu Fantah et al. Citation2022; Njeudjang et al. Citation2022). On the other hand, Earth Magnetic Anomaly Grid version 3 (EMAG2v3) data have been utilised for DBML and/or thermal structure investigations (Njiteu Tchoukeu et al. Citation2021; Lei et al. Citation2022; Solano-Acosta et al. Citation2022) and for tectonic structures enhancement as well (Lei et al. Citation2022; Solano-Acosta et al. Citation2022; Som Mbang et al. Citation2023). Likewise, WDMAM (World Digital Magnetic Anomaly Map) data were used by Vargas et al. (Citation2015), Salazar et al. (Citation2016), and Özsöz (Citation2021) for depth estimations of the Curie isotherm using spectral analyses techniques in the Northwestern South America, Southwestern Caribbean Sea and Eastern Mediterranean Region, comprehensively.
However, some studies discussed on the limitations of global geomagnetic models (Eyike et al. Citation2010; Lesur et al. Citation2016; Meyer et al. Citation2017; Oehler et al. Citation2018), involving the unavailability of complete metadata of the original datasets used, which shrinks the homogeneity of data and the assessment of their quality (e.g. some compilations are made from smaller surveys that were undertaken at different heights and epoch which are not known) (Lesur et al. Citation2016). Besides, data points are not uniform over some of the surveyed areas while other areas are illustrated by the sparseness of data (Lesur et al. Citation2016; Meyer et al. Citation2017; Özsöz Citation2021). Thus, to overcome those limitations, most global magnetic models rely on interpolation methods and/or synthetic magnetic anomalies to fill gaps (Meyer et al. Citation2017); this process of filling-gaps may not be accurate since it is more hypothetical and involves a lot of assumptions. Consequently, studies based on the use of those global geomagnetic models in un-surveyed or partially surveyed areas are likely to lead to wrong results.
Despite those uncertainties associated with global geomagnetic models in some areas, there is a paucity of studies on the accuracy assessment of those models from the original magnetic data from which they were compiled in Cameroon; the only study that exists involves Eyike et al. (Citation2010) who compared EMAG2v2 model with aeromagnetic data in Cameroon based on a single NE-SW profile located in the northern part of the country. They concluded that EMAG2v2 data were similar to 25-km resolution aeromagnetic grid in Cameroon.
Hence, this paper focuses on the assessment of three global geomagnetic models (EMAG2v2, EMAG2v3, and WDMAM v2.0) from their original aeromagnetic data in order to understand the spectral content of such global geomagnetic models in Cameroon. Hence, four sampling profiles values and power spectrum density (PSD) curves were extracted from both global geomagnetic models and aeromagnetic models for comparison. Correlation coefficients were computed between each profile data and the PSD curves of entire data grids were plotted in order to find the best matches.
2. Study area and tectonic setting
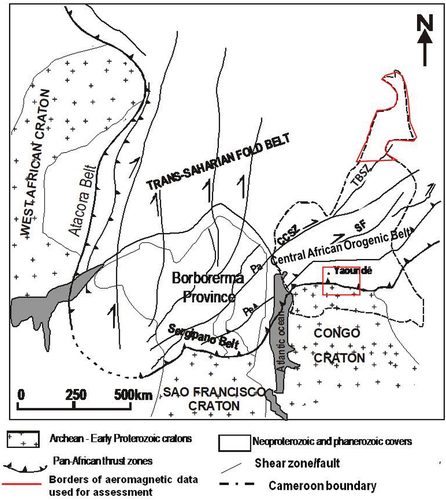
The Pan-African geological formations constitute a megastructure (), which includes the Central African Orogenic Belt (CAOB), the Trans-Saharian Fold Belt and the Brasiliano belts of NE Brazil (Oliveira et al. Citation2006; Ngako et al. Citation2008). The CAOB, also known as the Pan-African Fold Belt of Africa, covers Central African countries (Cameroon, Chad, Nigeria, Central African Republic), continues to the East through Sudan, Uganda and Tanzania (Theunissen et al. Citation1992); it is limited to the West by the Pan-African Trans-Saharian Fold Belt and to the south by the Congo Craton. This chain is oriented E-W, over a length and a width of about 5000 km and 300 km respectively. The Pan-African Fold Belt of Africa extends to the NE of Brazil by the Sergipano Belt with which it forms the Pan-African-Brazilian Fold Belt (Castaing et al. Citation1993; de Neves Bd et al. Citation2002). The convergence between the West African, Congo and Sao-Francisco cratons, and Saharan metacraton (Abdelsalam et al. Citation2002; Liégeois et al. Citation2003; Ngako et al. Citation2008) explains the general evolution of the Pan-African-Brazilian Fold Belt. The Trans-Saharian Fold Belt () goes from the Congo Craton in the West and extends to the East where it is bounded by the CAOB, which is well represented in Cameroon. Hence, Cameroon, which encompasses our study area, is divided into two main geological entities: the Congo Craton in the South and the CAOB in the North.
Figure 1. Geological reconstruction map of West African and NE Brazil Pan-African domains (Castaing et al. Citation1993). Cameroon borders are depicted as dashed lines and the aeromagnetic data used for comparison with the global geomagnetic models are represented by the red polygon. CCSZ: Central Cameroon Shear Zone; SF: Sanaga Fault; TBSZ: Tchollire Banyo shear zone; Pa: Patos shear zone; Pe: Pernambuco shear zone.
2.1. Congo Craton
The Congo Craton, is a huge geological mass composed of Archean and Paleoproterozoic terranes (Goodwin Citation1991), which extends southwards and is bordered to the north by the CAOB.
The Ntem Complex represents the NW block of the Congo Craton in Central Africa (Lasserre and Soba Citation1976; Feybesse et al. Citation1998). According to petro-structural studies, this geological entity is affected by two main deformation phases. The first deformational event, linked to successive emplacements of the mid-Archean granitoids (Shang et al. Citation2004), is illustrated by vertical stretching lineations, vertical foliation and isoclinal folds. The second deformation phase is characterised by the generation of various granite from the partial melting of tonalite-trondhjemite-granodiorite and supracrustal country rocks, also associated with the occurrence of sinistral shear planes of N0-N45; this episode is believed to be late Archean (Tchameni et al. Citation2000; Shang et al. Citation2007).
2.2. Central African Orogenic Belt (CAOB)
In Cameroon, the CAOB extends northwards the Congo Craton and is divided into the Southern, the Central, and the Northern domains (Nzenti et al. Citation1994).
The Southern domain of Cameroon is limited to the North and South by the Central domain and Congo Craton comprehensively. This domain extends to the Central African Republic. It is considered as an allochthonous entity covering a part of the Ntem complex (Toteu et al. Citation2004). Two deformational events marked this domain (Mvondo et al. Citation2003, Citation2007). The first stage is illustrated by E-W to NW-SE shortening by nappe stacking. The second deformation phase overprints the first stage and is characterised by N-S and E-W extension with orogenic collapse and exhumation of the Yaoundé series.
The Central domain of Cameroon stretches from Bafia locality to the southern part of Poli (Nzenti et al. Citation1992). It is comprised of the Lom and Bafia series (Tchakounte et al. Citation2007). According to Ngako et al. (Citation1992), the petro-structural evolution of this domain is marked by shallow-dipping S0/1 foliation associated with the early Pan-African nappe emplacement verging eastwards: this phase illustrates the deformation D1. The second deformational stage is dominated by tight and upright folds with vertical axial S2 planes (Ngako et al. Citation1992).
The Northern domain occurs along the western border of Cameroon, extending up to Poli (Poli series) (Toteu et al. Citation2006) and in SW Chad at Mayo Kebbi locality (Penaye et al. Citation2006). This domain is characterised by deformations D1 and D2 whose characteristics are similar to the ones found in the Central domain (Ngako et al. Citation1992; Nzenti et al. Citation1992). These two tectonic stages are overprinted by the occurrence of sinistral shear zone trending in the NE-SW to N-S directions, locally combined with south-vergent thrusts during deformation D3. Deformation D4 is illustrated by dextral shear zones trending WNW-ESE to NE-SW.
3. Data and methodology
3.1. Data
In this study, three global geomagnetic models were used for comparison (EMAG2v2, EMAG2v3, and WDMAM v2.0) with aeromagnetic data obtained from two different data surveys and providers.
3.1.1. Global geomagnetic models
The World Digital Magnetic Anomaly Map version 2 (WDMAM v2.0) (Lesur et al. Citation2016) data used in this work is the second version of the previous one which was launched in 2007 (Korhonen et al. Citation2007). This geomagnetic model was built by two groups belonging to “GeoForschungsZentrum” in Postdam and “Institut de Physique du Globe” in Paris. These data represent a collection of continental and marine magnetic data provided from respective owners worldwide. The available data were interpolated from the GMT function nearneighbor with various search radiuses (5, 7, 10 and 40 km) depending on data spacing. The long wavelengths of the merged grids were substituted by corresponding long wavelengths derived from satellite data using the comprehensive model CM4 (Sabaka et al. Citation2004; Quesnel et al. Citation2009). All those preprocessing and processing steps lead to the production of a homogenous grid set on a global 3 arc minute resolution (about 5.5-km cell sized grid). The data over marine and continental areas are displayed on the final grid at 0-km and 5-km altitude relative to the WGS84 datum respectively (Lesur et al. Citation2016). The WDMAM v2.0 data and associated metadata are available at http://www.wdmam.org/.
EMAG2v2 (Earth Magnetic Anomaly Grid version 2) (Maus et al. Citation2009) model, was realised from the compilation of pre-existing national scale grids recorded during airborne surveys, marine and satellite data. A directional gridding algorithm by Least Squares Collocation (LSC) was applied based on an anisotropic correlation function which allowed providing a realistic representation in sparsely surveyed areas. Besides, the long-wavelength field in merged data was substituted by magnetic field model MF6 (Maus et al. Citation2008). EMAG2v2 model is displayed as a 2 arc minute resolution (approximately 3.7-km grid cell size) grid recorded at an altitude of 4 km above the geoid. EMAG2v2 grid is freely downloadable from http://geomag.org/models/EMAG2.
Besides, the Earth Magnetic Anomaly Grid (EMAG2v3) (Meyer et al. Citation2017), which is the following version of EMAG2v2, was also used in this work. This geomagnetic model was realised from a collection of satellite, shipboard and airborne magnetic surveys. Those data were gridded using the Kriging interpolation process which was chosen due to the high variability in line azimuth and data density. Oceanic grids were obtained from the merging of original sea level data with 4-km downward-continued versions of the continental grids. Likewise, global continental grids were obtained from the compilation of original continental data with 4-km upward-continued versions of oceanic grids. Then, the MF7 field model (available at https://geomag.colorado.edu/magnetic-field-model-mf7.html) was used to replace long-wavelength anomalies found in the global grid with large-scale magnetic signals predicted by the satellite-based model. EMAG2v3 data are freely released at www.ngdc.noaa.gov/geomag/emag2.html, available at 0 and 4 km altitude with 2 arc-minute resolution.
A summary of the main characteristics of the assessed global geomagnetic models used in this study is displayed in .
Table 1. Summary of the characteristics and performance metrics of the global geomagnetic models used in the study.
3.1.2. Aeromagnetic data
The first aeromagnetic database used in this work was provided by GETECH (Green et al. Citation1992). Those data were compiled in 1992, on behalf of the African Magnetic Mapping Project (AMMP) which is a collaborative project between Paterson, Grand and Watson Ltd. (Canada), the Department of Earth Sciences (United Kingdom), and the International Institute for Aerospace Survey and Earth Sciences (Netherlands) (Green et al. Citation1992). The AMMP compiles a magnetic database for Africa from new and existing digital datasets. International Geomagnetic Reference Field (IGRF) correction and upward continuation were applied to the data to produce a 0.01 × 0.01 degree resolution Total Magnetic Intensity (TMI) grid at 1 km above the geoid. For the purpose of this study, the aeromagnetic data were collected over the Far North region of Cameroon; these data are comprised between latitudes 9–13° N and longitudes 13–16° E.
The second aeromagnetic dataset used in this work were obtained from Paterson and Ltd (Citation1976). The magnetic survey was achieved by SURVAIR in 1970 during the collaboration between the Federal Republic of Cameroon and the Canadian government. The magnetic data were taken at a nominal terrain clearance of 235 ± 20 m, with 750-m line spacing and an NW-SE flight lines direction. After diurnal corrections and high-frequency signals attenuation, Paterson and Ltd (Citation1976) compiled the aeromagnetic data as contour maps of magnetic field isovalues. For this study, we extracted and digitised aeromagnetic data over a portion of the South region of Cameroon, precisely between latitudes 2.5–4.5° N and longitudes 11–13° E. Later on, we applied the IRGF correction (year 1970) to obtain the Total Magnetic Intensity map of the study area.
3.2. Methodology
Prior to processing, the WGS84 system coordinates of geomagnetic models and aeromagnetic data were reprojected to World Mercator. Then, all those data were interpolated using Minimum Curvature and gridded to a 5 km *5 km grid cell size. The 5-km gridded aeromagnetic data were upward continued to 4, 5, 10, 15, 20, 25, and 30 km for comparison with global geomagnetic models. Two line paths were traced for each of the two aeromagnetic grids; the global geomagnetic grids were sampled along those profiles. This was done using Geosoft software 8.4. The best match between aeromagnetic and global geomagnetic models was analysed from Pearson’s correlation coefficient via OriginPro 2023.
3.2.1. Upward continuation
The Upward Continuation is an operator that enhances the effect of long-wavelength signals and reveals anomalies associated with deeper sources with respect to the continuation height (the depth to the top of the anomaly source increases with higher continuation height h). The first upward continuation expressions were given in the space domain operators (Henderson Citation1960; Fuller Citation1967), which were replaced by frequency-domain operators by recognising the utility of Fourier transform techniques in analytic continuations.
Based on Green’s third identity, Henderson (Citation1970) gave the classic derivation of the upward continuation operator. He demonstrated that for a coordinate system with z-axis oriented upward, the total field anomaly M (x, y, z) at an elevation z can be computed from the anomaly on the surface of the Earth M (x,y,0) by considering it over the z = 0 plane. The compact form of the Fourier transform formula is expressed by:
Letting be the radial wave number and u and v are the wave numbers in the x- and y-direction.
3.2.2. Pearson’s correlation coefficient
In this study, we used Pearson’s correlation coefficient (Bravais Citation1844; Chok Citation2010) in order to determine the correlation between geomagnetic models and aeromagnetic data. This process was achieved by tracing profiles along upward-continued aeromagnetic grids and sampling the geomagnetic grids along each profile. The respective datasets were exported to OriginPro 2023 for comparison via the Pearson’s correlation coefficient algorithm which is defined as the ratio of the covariance of two continuous variables to the product of their respective standard deviations as follows:
Where and
The correlation coefficient, r, is computed by inserting the sample standard deviations and the sample covariance into Equationequation (1)(1)
(1) . This coefficient ranges from −1 to + 1 (Chok Citation2010). When two variables X and Y tend to decrease or increase simultaneously, we have a positive monotonic association (ρ > 0). However, a negative monotonic association is observed when one variable (X or Y) decreases as the other increases (ρ < 0). The absence of any association (except for variables with non-monotonic relationship) is illustrated when ρ=0.
3.2.3. Power Spectrum Density (PSD)
The procedure to compute the depth to the top of magnetic sources was introduced by Spector and Grant (Citation1970) using the radial mean of the energy spectrum.
If we assume that:
the magnetisation M (x, y) is a random function of x and y, and does not depend on depth,
the thickness of the magnetic source is small compared to the horizontal scale,
the magnetic source is a layer that extends infinitely in all horizontal directions.
Blakely (Citation1996) showed that the power spectral density of the total magnetic field observed is expressed by:
Where nx, ny are the wavenumbers in the x and y directions, so that , where
is the wavelength in the x or y directions (in real discrete conditions,
, with di and k being the wavelength resolution and an integer, respectively), ΦM is the magnetisation power spectrum.
ΦM(nx,ny) is a constant if the magnetisation M(nx,ny) is a completely uncorrelated function of x and y. G is the Fourier transform of the total magnetic field given by:
Where CM is a constant, θCG is factor the direction of the geomagnetic field, θM is a factor for the direction of magnetisation, Zb and Zt are the depths to the bottom and to the top of the magnetic layer respectively, and |n| is the module of (nx, ny).
In this study, we used the 2-D radially averaged power spectrum analysis method (Tselentis et al. Citation1988) to realise the PSD curves of both global geomagnetic models and aeromagnetic data by plotting the log of the power spectrum against the wavenumber expressed in cycles/km. The global geomagnetic models used in this study were resized to the borders of aeromagnetic data () before we realised the computations on entire data set of the PSD in Geosoft software. The resulting PSD curves were drawn from Excel.
4. Results
Visual comparisons between EMAG2v2 and WDMAM v2.0 show some similarities in the spatial distribution of long-wavelength negative and positive anomalies all over the country. However, the sparseness of the data, illustrated in the West of EMAG2v2 (), is not depicted in WDMAM v2.0 (); indeed, the latter displays gaps filled dominated by synthetic anomalies derived from the lithospheric field model GRIMM_L120. Both global geomagnetic models () are consistent with aeromagnetic data () where regional features such as the transition between the Congo Craton and the CAOB (), are well discriminated. In addition, a comparison of the GETECH local aeromagnetic data () and both EMAG2v2 and WDMAM v2.0 data () shows that the latter are smoother in appearance and barely depict short-wavelength anomalies. On the other hand, EMAG2v3 () wavelength information appear to be completely different from other global geomagnetic models and aeromagnetic data, except in the central part of the maps where positive anomalies coincide. The inconsistency of these EMAG2v3 anomalies with other ones may be due an extensive and exclusive use of the Kriging interpolation process (based on observed data) to compensate data gaps, since EMAG2v3 does not integrate any a priori ocean-age or geologic structure information.
Figure 2. Total magnetic intensity maps of Cameroon extracted from geomagnetic models with the 4 profiles used for comparison superimposed on each model: (a) EMAG2v2; (b) EMAG2V3; (c) WDMAM v2.0. We can observe similarities in the extension and intensity of the magnetic signal between both EMAG2v2 and WDMAM v2.0 models.
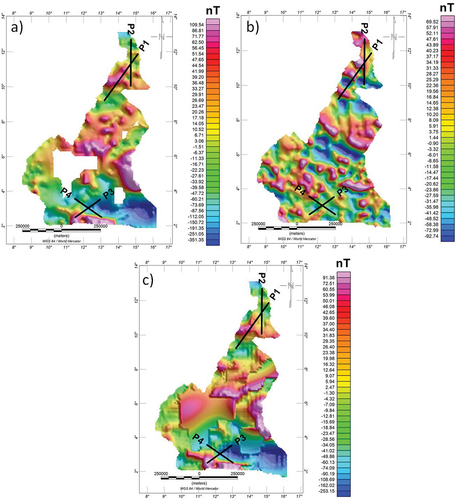
Figure 3. Aeromagnetic anomaly maps of: (a) Far North Cameroon with the two selected profiles (P1 and P2) superimposed on it; (b) part of the South region of Cameroun with the two selected profiles (P3 and P4) superimposed on it.
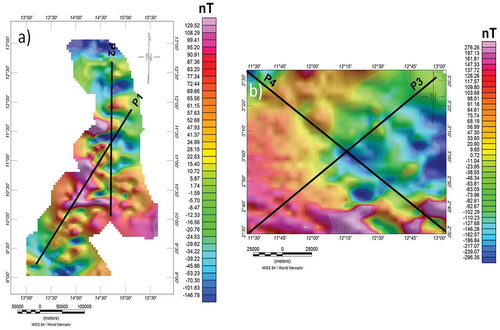
Furthermore, the comparison between the global geomagnetic models and aeromagnetic data was achieved based on 4 line paths depicted in . In the northern part of Cameroon, we have studied two profiles: P1 and P2. Orientated NE-SW, P1 is 365-km long while P2 is trending N-S with a length of 295 km. Likewise, in the southern side of the country (), our work was focused on both P3 (195 km) and P4 (205 km) which are oriented NE-SW and NW-SE comprehensively. The grid sampling of all the studied magnetic data along selected profiles allows the extraction of magnetic anomaly values (134 and 82 sampling values in northern and southern parts of the country, respectively) whose correlations were analysed. Hence, displays the correlation coefficient variation between global geomagnetic models (EMAG2v2, EMAG2v3, and WDMAM v2.0) and airborne magnetic data upward continued at 4, 5, 10, 15, 25, 30 km.
Table 2. Pearson’s correlation coefficient variation between EMAG2v3, EMAG2v2, WDMAM v2.0, and aeromagnetic data upward-continued at several heights for each profile.
In northern Cameroon (), we can notice that a close match (ρ = 0.960) is observed between EMAG2v2 and 20-km upward-continued aeromagnetic data along P1 (). WDMAM v2.0 better fits with 15-km upward-continued aeromagnetic data (ρ = 0.946). Besides, it is worth noting that at 15-km upward-continuation (), comparisons between both EMAG2v2 and WDMAM v2.0 indicate that EMAG2v2 (ρ = 0.958) is still more accurate than WDMAM v2.0 (ρ = 0.946). However, no positive correlation is found when comparing EMAG2v3 data to EMAG2v2, WDMAM v2.0 and upward-continued airborne magnetic data. When compared to other global models, EMAG2v2 data display highest correlations with upward-continued data along P1.
In addition, P2 () illustrates the strongest correlation coefficient (ρ = 0.856) between EMAG2v2 and 15-km upward-continued airborne magnetic data. WDMAM v2.0 shows a better correspondence with 10-km upward-continued aeromagnetic data (ρ = 0.891). Unlike P1, WDMAM v2.0 shows better results than EMAG2v2 in P2. Indeed, at 15-km upward-continued airborne magnetic data, WDMAM v2.0 displays a higher correlation coefficient ρ = 0.884. However, EMAG2v3 data exhibit high negative correlation coefficients, reaching up to −0.888, when compared to EMAG2v2, WDMAM v2.0 and upward-continued airborne magnetic data. WDMAM v2.0 appears to be of highest correlations with upward-continued aeromagnetic data when compared to other global models.
In southern Cameroon (), P3 () displays the highest correlation coefficient (ρ = 0.996) between EMAG2v2 and 5-km upward-continued aeromagnetic data. Besides, WDMAM v2.0 correlates well with 10-km upward-continued aeromagnetic data (ρ = 0.995). EMAG2v3 data still depict a negative correlation with EMAG2v2, WDMAM v2.0 and upward-continued airborne magnetic data. When compared to other global models, EMAG2v2 data show highest correlation coefficients with shorter wavelengths (4-5 km upward-continued aeromagnetic data), while WDMAM v2.0 data have highest coefficients from 10-30 km upward-continued airborne data; hence, the spectral content of both global models seem to be complementary in P3.
As depicted in P4 (), the correlation coefficient between EMAG2v2 and airborne magnetic data reaches its peak at ρ = 0.957, with 15-km upward-continued aeromagnetic data. WDMAM v2.0 better fits with 20-km upward-continued aeromagnetic data (ρ = 0.9797). In addition, WDMAM v2.0 shows better results than EMAG2v2 in P4. Indeed, at 15-km upward-continued airborne magnetic data, WDMAM v2.0 displays a higher correlation coefficient ρ = 0.9758. EMAG2v3 data display negative values when correlated with EMAG2v2, WDMAM v2.0 and upward-continued airborne magnetic data along P4. WDMAM v2.0 depicts highest correlations with upward-continued aeromagnetic data when compared to other global models.
Furthermore, statistics for the amplitude difference and standard deviation between global geomagnetic models and aeromagnetic data for each profile is displayed in . We can notice that higher standard deviation values in all profiles are obtained by the difference between TMI of aeromagnetic data and global geomagnetic models; these standard deviation values decrease with the difference between global geomagnetic models and upward continuation of aeromagnetic data. In profile 1, lowest standard deviation values are depicted by the difference between 20-km upward-continued aeromagnetic data and EMAG2v2 (Up20-EMAG2v2) (Std. Dev = 8.70) and WDMAM v2.0 (Up20-WDMAM v2.0) (Std. Dev = 10.10). In profile 2, lowest discrepancies are observed by difference between 15-km upward-continued aeromagnetic data and EMAG2v2 (Up15-EMAG2v2) (Std. Dev = 19.01) and WDMAM v2.0 (Up15-WDMAM v2.0) (Std. Dev = 19.98). In profile 3, the difference between 5-km upward-continued aeromagnetic data and EMAG2v2 (Up5-EMAG2v2) shows a Std. Dev = 12.63 while the difference between 10-km upward-continued aeromagnetic data and WDMAM v2.0 (Up10-WDMAM v2.0) gives a Std. Dev of 9.97. Finally, in profile 4, lowest standard deviation values of 13.88 and 13.83 are illustrated by Up15-EMAG2v2 and Up20-WDMAM v2.0 respectively. It is worth noting that differences between upward-continued aeromagnetic data and EMAG2v3 display the highest standard deviation values in all profiles, reaching up to 109.64 in profile 3.
Table 3. Statistics for the amplitude difference and standard deviation between global geomagnetic models and aeromagnetic data for each profile. Up=Upward-continuation; TMI=Total Magnetic Intensity; Std.Dev= Standard deviation.
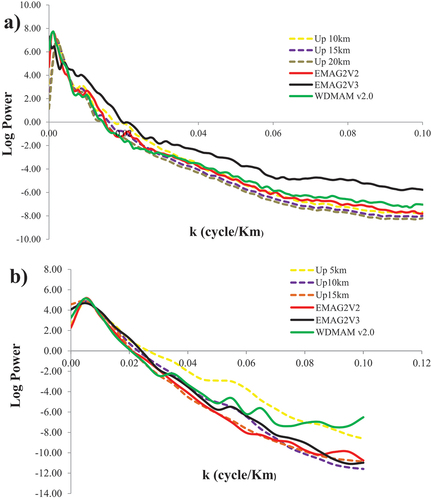
In order to provide a better comparison between both global geomagnetic models and aeromagnetic data, we did a qualitative interpretation from the spectral analysis of the different data. Since magnetic anomalies may be the effects of different sources at variable depths, we plotted the radially averaged power spectrum. displays the log of the power spectrum against the wavenumber computed for the whole gridded data with respects to assessment borders depicted in . PSD curves of upward-continued aeromagnetic data and global geomagnetic models are displayed in dashed and continuous lines comprehensively. In , PSD curves of EMAG2v2 and Up10km show similar trends. In addition, WDMAM v2.0 displays similar trend with Up10 km and Up20km for shallow and deep sources respectively. PSD curve of EMAG2v3 is distinctly different from other curves especially at the spectral peak. Likewise, shows PSD curves of EMAG2v2 and Up15km fitting each other in a similar trend. WDMAM v2.0 PSD curve coincides with both Up10km and Up15km for shallow and deep sources comprehensively. EMAG2v3 and Up10km PSD curves appear to be of the same trend.
Figure 4. Power density curves of both global geomagnetic models and aeromagnetic data of: (a) Far North Cameroon and (b) South Cameroon as depicted in .
5. Discussion
In this work, we focused on the accuracy assessment of global geomagnetic models from their original aeromagnetic in a view to provide a better comprehension of the spectral content of those models.
illustrates the similarities and discrepancies between different global geomagnetic models and the corresponding upward-continued airborne magnetic data for each profile. Hence, we can notice that the spectral content of EMAG2v2 and WDMAM v2.0 data is similar to: (a) 20-km and 15-km upward-continued aeromagnetic data respectively in P1 (), and (b) 15-km and 10-km upward-continued aeromagnetic data comprehensively in P2 (); this indicates heterogeneities in the spectral content of those models. Besides, the best standard deviations values obtained for both EMAG2v2 and WDMAM v2.0 models from profiles 1 and 2 display high consistencies with Up20km and Up15km () respectively for each profile. This is not consistent with the so-claimed altitude above the geoid of both EMAG2v2 and WDMAM v2.0 grids, being 4 and 5 km comprehensively (Maus et al. Citation2009; Lesur et al. Citation2016). Eyike et al. (Citation2010) claimed that EMAG2v2 spectra were equivalent to 25-km upward-continued aeromagnetic data based on a single NE-SW profile similar to P1 whose EMAG2v2 data have been shown to best match with 20-km airborne data in this study. It is worth nothing that when analysing the power spectrum of the whole data grids to which both profiles P1 and P2 belong, EMAG2v2 shows commonality with Up10 km while WDMAM v2.0 displays shared features with Up10km and Up20km (); indeed curves which are confused with each other or display some parallelism are of the same spectral content (Bhattacharyya and Leu Citation1977; Okubo et al. Citation1985). However, there is a negative monotonic association of EMAG2v3 data with EMAG2v2, WDMAM v2.0 and upward-continued airborne magnetic data along both P1 and P2 ().
Figure 5. Comparison of EMAG2v2, EMAG2v3, WDMAM v2.0, and aeromagnetic data (extracted in Figs. 2 and 3) for each profile: (a) profile 1, a better match is observed between WDMAM v2.0, EMAG2v2 and 15-km, 20-km upward-continued airborne magnetic data respectively; (b) profile 2, a good correlation is found between WDMAM v2.0, EMAG2v2 and 10-km, 15-km upward-continued airborne magnetic data comprehensively; (c) profile 3, a strong correlation is noticeable between WDMAM v2.0, EMAG2v2 and 5-km, 10-km upward-continued airborne magnetic data respectively; (d) profile 4, a strong match is depicted between WDMAM v2.0, EMAG2v2 and 15-km, 20-km upward-continued airborne magnetic data comprehensively.
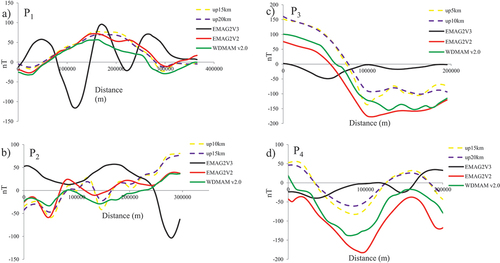
Likewise, EMAG2v2 and WDMAM v2.0 data show correspondence with: (c) 5-km and 10-km upward-continued aeromagnetic data comprehensively in P3 (), and (d) 15 km and 20-km upward-continued aeromagnetic data respectively in P4 (). Unlike P4, a consistency (±1 km) is observed between the spectral content of both EMAG2v2 (4 km height, Maus et al. Citation2009) and aeromagnetic data along P3 (5 km). Besides, the spectral content of WDMAM v2.0 whose altitude above the geoid is supposed to be 5 km (Lesur et al. Citation2016), is not in accordance with aeromagnetic data which display best matches at 10 km and 20 km along P3 and P4 respectively. Furthermore, the PSD curves of entire data grids associated with P3 and P4 () show a positive correlation between EMAG2v2 and Up15km; likewise, WDMAM v2.0 PSD curve seems to be consistent with Up10km and Up15km. Just like P1 and P2, we can notice a negative monotonic association of EMAG2v3 data with EMAG2v2, WDMAM v2.0 and upward-continued airborne magnetic data along both P3 and P4 ().
Summarily, one of the possible reasons that could explain the heterogeneity in the spectral contents of global geomagnetic models is that these models are mostly compiled from data of a nominal resolution of about 25 km (15 min grid cell size) provided by GETECH (Maus et al. Citation2009; Lesur et al. Citation2016; Meyer et al. Citation2017); this may result into areas free of short-wavelength magnetic anomalies. Other reasons explaining those discrepancies could be associated with: (1) the absence of complete metadata (epoch, flight height, terrain clearance etc.) of each flown survey used in data compilations; (2) the variability of coordinate systems and projections of original datasets; (3) models (IGRF/DGRF, or local polynomials) used to reduce the original data are not known and difficult to find out; (4) the lack of absolute reference which shrinks the restoration of long-wavelength anomalies. In addition to the limitations mentioned above, the complete inadequacy of EMAG2v3 with respect to other global geomagnetic grids and aeromagnetic data studied in Cameroon could be explained by the non-integration of a realistic synthetic magnetic model (no a priori information) in areas of less or unavailable data. The a priori information provides more reliable results which are in good accordance with areas where data are available, and stabilises the gridding process (Meyer et al. Citation2017).
6. Conclusion
The accuracy assessment of global geomagnetic models is required before their application in other fields in order to increase the reliability of results. Hence, the aim of this study was to assess freely released global geomagnetic models from available aeromagnetic data in Cameroon. The assessment of global geomagnetic models against available aeromagnetic data shows that the accuracies of the global geomagnetic models EMAG2v2, EMAG2v3, and WDMAM v2.0 over Cameroon are questionable as follows:
The data indicate that the so-claimed 4-5-km altitude relative to the geoid of global geomagnetic models is not homogeneous in Cameroon since the spectral content may vary according to the profile or the area under study.
The results obtained from correlation between both global geomagnetic models and aeromagnetic data along profiles appear to be slightly different (~5-10 km) from the correlation of power spectrum of entire data grids.
The data imply that the magnetic wavelengths of EMAG2v2 and WDMAM v.2.0 data may be linked to survey elevations varying from 5 and 20 km in Cameroon.
The spectral content of EMAG2v2 model (4 km above geoid) only appears to be consistent with aeromagnetic data along profile P3 (approximately 5 km).
Spectral analyses of entire data grids indicate a consistency between EMAG2v2 and Up10km in the Far North Cameroon, and Up15km in the South Cameroon.
WDMAM v2.0 PSD curves of entire data grids show a correspondence with Up10km and Up 20 km in the Far North Cameroon, and also with Up10km and Up15km in the South Cameroon.
Large inconsistencies are observed between the aeromagnetic data and WDMAM v.2.0 model which cannot retrieve the spectral contents with wavelengths shorter than ~10 km.
The data indicate that Earth Magnetic Anomaly Grid version 3 (EMAG2v3) data are not reliable for scientific studies based in Cameroon and are susceptible to produce misleading results.
The data imply that researchers should consider the real wavelength content of global geomagnetic models before applying depth sources computations algorithms such as Euler Deconvolution.
The data would provide the opportunity to increase the awareness of researchers on the use of global geomagnetic models and to replicate this study in their area of interest.
Acknowledgements
The author wishes to thank the scientific community and all organisations involved in either the survey of aeromagnetic data or the compilation of global geomagnetic models for providing those data. Special thanks go to GETECH for the availability of the data used in this study.
Disclosure statement
No potential conflict of interest was reported by the author(s).
Data availability statement
The data that support the findings of this study are available on request from the corresponding author. The aeromagnetic data are not publicly available due to some ethical restrictions.
References
- Abdelsalam GM, Liégeois L, Stern RJ. 2002. The Saharan Metacraton. J Afr Earth Sci. 374(34):119–136. doi: 10.1016/S0899-5362(02)00013-1.
- Anaba Fotze QM, Djieto Lordon A, Penaye J, Sep JP, Neh Fru MI. 2019. Mapping hydrothermal alteration targets from Landsat 8 OLI/TIRS and magnetic data using digital image processing techniques in Garoua, North Cameroon. J Geosci Geomatics. 7(1):28–41. doi: 10.12691/jgg-7-1-4.
- Backus G, Parker R, Constable C. 1996. Foundations of geomagnetism. Cambridge: Cambridge University Press.
- Basseka CA, Njiteu Tchoukeu CD, Eyike A, Shandini Y, Kenfack JV. 2016. Apport des données magnétiques de surface et satellitaires à l’étude des structures profondes du Sud-Cameroun. Sciences, Technologies Et Développement. 18:15–30.
- Bhattacharyya BK, Leu LK. 1977. Spectral analysis of gravity and magnetic anomalies due to rectangular prismatic bodies. Geophysics. 42(1):41–50. doi: 10.1190/1.1440712.
- Blakely RJ. 1996. Potential theory in gravity and magnetic applications. Cambridge University Press; p. 441.
- Bravais A. 1844. Analyse mathématique sur les probabilités des erreurs de situation d’un point. Paris: Imprimerie Royale.
- Castaing C, Triboulet C, Feybesse JL, Chevremont P. 1993. Tectono-metamorphic evolution of Ghana, Togo and Benin in the light of the Pan-African/Brasiliano orogeny. Tectonophysics. 218(4):323–342. doi: 10.1016/0040-1951(93)90322-B.
- Cheunteu Fantah CA, Adiang Mezoue C, Mouzong M, Tokam Kamga AP, Nouayou R, Nguiya S. 2022. Mapping of major tectonic lineaments across Cameroon using potential field data. Earth Planets Space. 74(1):59. doi: 10.1186/s40623-022-01612-7.
- Chok NS. 2010. Pearson’s versus Spearman’s and Kendall’s correlation coefficients for continuous data. Pennsylvania: University of Pittsburgh.
- de Neves Bd B, Van Schmus WR, Fetter A. 2002. North-western Africa–North-eastern Brazil. Major tectonic links and correlation problems. J Afr Earth Sci. 34(3–4):275–278. doi: 10.1016/S0899-5362(02)00025-8.
- Eyike A, Werner S, Ebbing J, Manguelle Dicoum E. 2010. On the use of global potential field models for regional interpretation of the West and Central African Rift System. Tectonophysics. 492(1–4):25–39. doi: 10.1016/j.tecto.2010.04.026.
- Feybesse JL, Johan V, Triboulet C, Guerrot C, Mayaga-Minkolo F, Bouchot V, Eko N’dong J. 1998. The West Central African belt: a model of 2.5–2.0Ga accretion and two-phase orogenic evolution. Precamb Res. 87(3–4):161–216. doi: 10.1016/S0301-9268(97)00053-3.
- Fuller BD. 1967. Two-dimensional frequency analysis and design of grid operators. In: Mining Geophysics. Tulsa (OK): Society of Exploration Geophysicists, II; p. 658–708.
- Goodwin AM. 1991. Precambrian Geology. The dynamic evolution of the continental crust 1–666. (NY): Academic Press, Harcourt Brace Jovanovich Publishers.
- Green CM, Barritt SD, Fairhead JD, Misener DJ. 1992. The African magnetic mapping project. Extended abstract. European Association of Geoscientists & Engineers (EAGE) 54th Meet Technical Exhibition. Paris.
- Henderson RG. 1960. A comprehensive system of automatic computation in magnetic and gravity interpretation. Geophysics. 25(3):569–585. doi: 10.1190/1.1438736.
- Henderson RG. 1970. On the validity of the use of the upward continuation integral for total magnetic intensity data. Geophysics. 35(5):916–919.
- Idarraga-García J, Vargas CA. 2018. Depth to the bottom of magnetic layer in South America and its relationship to Curie isotherm, Moho depth and seismicity behavior. Geod Geodyn. 9(1):93–107. doi: 10.1016/j.geog.2017.09.006.
- Korhonen J, Fairhead JD, Hamoudi M, Hemant K, Lesur V, Mandea M, Maus S, Purucker M, Ravat D, Sazonova T, et al. 2007. Magnetic anomaly map of the world—carte des anomalies magnétiques du monde. 1st Edition ed. Paris, France: Commission for Geological Map of the World.
- Lasserre M, Soba D. 1976. Age liberien des granodiorites et des gneiss à pyroxènes du Cameroun Meridional. Bull BRGM. 2(4):17–32.
- Lei Y, Jiao L, Tu J, Zhao J, Huang Q. 2022. Magnetic structure and its tectonic implication around longmenshan fault zone revealed by EMAG2v3. Front Earth Sci. 10:848824. doi: 10.3389/feart.2022.848824.
- Lesur V, Hamoudi M, Choi Y, Dyment J, Thebault E. 2016. Building the second version of the World Digital Magnetic Anomaly Map (WDMAM). Earth Planets Space. 68(1):1–13. doi: 10.1186/s40623‑016‑0404‑6.
- Liégeois JP, Latouche L, Boughrara M, Navez J, Guiraud M. 2003. The LATEA metacraton, (central Hoggar, Tuareg shield, Algeria): behaviour of an old passive margin during the Pan-African orogeny. J Afr Earth Sci. 37(3–4):161–190. doi: 10.1016/j.jafrearsci.2003.05.004.
- Li CF, Lu Y, Wang J. 2017. A global reference model of Curie point depths based on EMAG2. Sci Rep. 7(1):19. doi: 10.1038/srep45129.
- Maus S, Barckhausen U, Berkenbosch H, Bournas N, Brozena J, Childers V, Dostaler F, Fairhead JD, Finn C, von Frese RRB, et al. 2009. EMAG2: a 2–arc min resolution earth magnetic anomaly grid compiled from satellite, airborne, and marine magnetic measurements. Geochem Geophys Geosyst. 10(8):Q08005. doi: 10.1029/2009GC002471.
- Maus SF, Yin H, Luhr C, Manoj M, Rother J, Rauberg I, Michaelis C, Stolle M, Müller RD. 2008. Resolution of direction of oceanic magnetic lineations by the sixth-generation lithospheric magnetic field model from CHAMP satellite magnetic measurements. Geochem Geophys Geosyst. 9(7):Q07021. doi: 10.1029/2008GC001949.
- Meyer B, Chulliat A, Saltus R. 2017. Derivation and error analysis of the Earth magnetic anomaly grid at 2 arc min resolution version 3 (EMAG2v3). Geochem Geophys Geosyst. 18(12):4522–4537. doi: 10.1002/2017GC007280.
- Meyer J, Hufen JH, Siebert M, Hahn A. 1985. On the identification of Magsat anomaly charts as crustal part of the internal field. J Geophys Res: Solid Earth. 90(B3):2537–2541. doi: 10.1029/JB090iB03p02537.
- Mohamed A, Al Deep M. 2021. Depth to the bottom of the magnetic layer, crustal thickness, and heat flow in Africa: Inferences from gravity and magnetic data. J Afr Earth Sci. 179:104204. ISSN 1464-343X. 10.1016/j.jafrearsci.2021.104204.
- Mvondo H, Den Brok DB, Mvondo Ondoa J. 2003. Evidence for extension and exhumation of the Yaounde nappe (Pan-African fold belt, Cameroon). J Afr Earth Sci. 36(3):215–231. doi: 10.1016/S0899-5362(03)00017-4.
- Mvondo H, Owona S, Mvondo OJ, Essono J. 2007. Tectonic evolution of the Yaoundé segment of the Neoproterozoic Central African Orogenic belt in southern Cameroon. J Earth Sci. 44(4):433–444. doi: 10.1139/e06-107.
- Ngako V, Affaton P, Njonfang E. 2008. Pan-African tectonics in northwestern Cameroon: implication for the history of western Gondwana. Gondwana Res. 14(3):509–522. doi: 10.1016/j.gr.2008.02.002.
- Ngako V, Jegougo P, Nzenti JP. 1992. Champ de raccourcissement et cratonisation du Nord Cameroun du Proterozoique superieur au Paleozoique moyen. Comptes Rendus Academie des Sciences de Paris. 315:371–377.
- Njeudjang K, Djousse Kanouo BM, Bouba A, Nitcheu M, Teikeu W, Soh Tamehe L, Djongyang N, Njandjock Nouck P. 2023. Estimation of radiogenic heat production of the Adamawa region in Cameroon, Central Africa: an insight from spectral analysis of EMAG2 data. Arabian J Geosci. 16:442. doi: 10.1007/s12517-023-11533-8.
- Njeudjang K, Domra KJ, Ahmat T, Abate Essi JM, Djongyang N, Tchinda R. 2020. Curie point depth and heat flow deduced from spectral analysis of magnetic data over Adamawa volcanic region (Northern Cameroon): geothermal implications. SN Appl Sci. 2(8):1–16. doi: 10.1007/s42452-020-3099-z.
- Njeudjang K, Yandjimain J, Bouba A, Kanouo Djousse BM, Teikeu Assatse W, Djongyang N, Ndougsa-Mbarga T. 2022. Subsurface tectonic inferences of the Adamawa Region of Cameroon from EMAG2 magnetic data. Hindawi, Int J Geophys. 2022:13. Article ID 8451725. doi: 10.1155/2022/8451725.
- Njiteu Tchoukeu CD, Basseka CA, Poudjom Djomani Y, Rousse S, Etame J, Llubes M, Seoane L, Som Mbang C, Eyike Yomba A. 2021. Crustal thickness, depth to the bottom of magnetic sources and thermal structure of the crust from Cameroon to Central African Republic: Preliminary results for a better understanding of the origin of the Bangui magnetic anomaly. J Afr Earth Sci. 179:104206. doi: 10.1016/j.jafrearsci.2021.104206.
- Nzenti JP, Barbey P, Bertrand JML, Macaudiere J. 1994. La chaîne panafricaine au Cameroun: cherchons suture et modèle. S.G.F. édit.15ème réunion des Sciences de la Terre; Nancy, France; p. 99.
- Nzenti JP, Ngako V, Kambou R, Penaye J, Bassahak J, Njel UO. 1992. Structures régionales de la chaîne panafricaine au Nord-Cameroun. Comptes Rendus de l’Académie des Sciences. 611:115–119.
- Oehler JF, Rouxel D, LequentrecLalancette MF. 2018. Comparison of global geomagnetic field models and evaluation using marine datasets in the north eastern Atlantic Ocean and western Mediterranean Sea. Earth Planets Space. 70(1):99. doi: 10.1186/s40623-018-0872-y.
- Okubo Y, Graf RJ, Hansen RO, Ogawa K, Tsu H. 1985. Curie point depths of the island of Kyushu and surrounding areas, Japan. Geophysics. 50(3):481–494. doi: 10.1190/1.1441926.
- Oliveira EP, Toteu SF, Araujo MNC, Carvalho MJ, Nacimento RS, Buen JF, McNaughton N, Basilici G. 2006. Geologic correlation between the Neoproterozoic Sergipano belt (NE Brazil) and the Yaoundé belt (Cameroon, Africa). J Afr Earth Sci. 44(4–5):470–478. doi: 10.1016/j.jafrearsci.2005.11.014.
- Özsöz İ. 2021. Combined qualitative and quantitative regional interpretation of the thermal results of magnetic data in the Eastern Mediterranean Region. Turkish J Earth Sci. 30(5):665680. doi: 10.3906/yer-2102-11.
- Pamuk E. 2019. Investigating edge detection, Curie point depth, and heat flow using EMAG2 magnetic and EGM08 gravity data in the northern part of Eastern Anatolia, Turkey. Turkish J Earth Sci. 28(6):805821.
- Pamuk E, Özsöz I. 2022. Estimation of CuriePoint depths and heat flow from spectral analysis of EMAG2 magnetic data in Cyprus Island. Ann Geophys-Italy. 65. doi: 10.4401/ag-8741.
- Paterson G, Ltd W. 1976. Études aéromagnétiques sur certaines régions de la république unie du Cameroun. Rapport d’interprétation Agence Canadienne de Développement International; Toronto, Canada.
- Penaye J, Kröner A, Toteu SF, Van Schmus WR, Doumnang JC. 2006. Evolution of the Mayo Kebbi region as revealed by zircon dating: an early (ca. 740 Ma) Pan-African magmatic arc in southwestern Chad. J Afr Earth Sci. 44(4–5):530–542. doi: 10.1016/j.jafrearsci.2005.11.018.
- Prasad M, Dubey CP. 2023. Tectonic and structural elements of Southern granulite terrane, South India: inferences from gravity and magnetic studies. J Asian Earth Sci. 256:105823. doi: 10.1016/j.jseaes.2023.105823.
- Quesnel Y, Catalàn M, Ishihara T. 2009. A new global marine magnetic anomaly data set. J Geophys Res: Atmosph. 114(B04106). doi: 10.1029/2008JB006144.
- Reigber C, Luhr H, Schwintzer P. 2002. CHAMP mission status. Adv Space Res. 30(2):129–134. doi: 10.1016/S0273-1177(02)00276-4.
- Sabaka TJ, Olsen N, Purucker ME. 2004. Extending comprehensive models of the Earth’s magnetic field with Ørsted and CHAMP data. Geophysical Journal International. 159(2):521–547. doi: 10.1111/j.1365-246X.2004.02421.x.
- Salazar JM, Vargas CA, Leon H. 2016. Curie point depth in the SW Caribbean using the radially averaged spectra of magnetic anomalies. Tectonophysics. 694:400–413. doi: 10.1016/j.tecto.2016.11.023.
- Shang CK, Satir M, Nsifa EN, Liegeois JP, Siebel W, Taubald H. 2007. Archaean high-K granitoids produced by remelting of earlier Tonalite–Trondhjemite–Granodiorite (TTG) in the Sangmelima region of the Ntem complex of the Congo Craton, southern Cameroon. Int J Earth Sci. 96(5):817–841. doi: 10.1007/s00531-006-0141-3.
- Shang CK, Wolfgang S, Muharrem S, Funken C, Mvondo Ondoa J. 2004. Zircon Pb-Pb and U-Pb systematics of TTG rocks in the Congo Craton: Constraints on crust formation, magmatism, and Pan-African lead loss. Bull Geosci. 79(4):205–219.
- Solano-Acosta JD, Soesoo A, Hints R. 2022. New insights of the crustal structure across Estonia using satellite potential fields derived from WGM-2012 gravity data and EMAG2v3 magnetic data. Tectonophysics. 229656. doi: 10.2139/ssrn.4133490.
- Som Mbang CM, Mouzong M, Cheng LZ, Megne Tafone JL, Basseka CA, Kamguia J, Etame J. 2023. Spatial relations between geological structures and precious and base metal deposits from magnetic investigation of the Pangar-Djérem Zone, Cameroon. Int J Geophys. 2023:1–15. Article ID 4872249. doi: 10.1155/2023/4872249.
- Spector A, Grant F. 1970. Statistical models for interpreting magnetic data. Geophysics. 35(2):293–302. doi: 10.1190/1.1440092.
- Tchakounte JN, Toteu SF, Van Schmus WR, Penaye J, Deloule E, Mvondo Ondoua J, Houketchang MB, Ganwa AA, White WM. 2007. Evidence of ca. 1. 6-Ga detrital zircon in the Bafia Group (Cameroon): Implication for the chronostratigraphy of the Pan-African Belt north of the Congo Craton. C R Geosci. 339(2):132–142. doi: 10.1016/j.crte.2007.01.004.
- Tchameni R, Mezger K, Nsifa EN, Pouclet A. 2000. Neoarchean evolution in the Congo Craton: evidence from. K rich granitoids of the Ntem complex, Southern Cameroon. J Earth Sci. 30(1):113–147. doi: 10.1016/S0899-5362(00)00012-9.
- Theunissen K, Lenoir JL, Liégéios JP, Delvaux D, Murma A. 1992. Empreinte panafricaine majeure dans la chaîne ubendienne de Tanzanie sud occidentale: géochronologie U-Pb sur zircon et contexte structural. Comptes Rendus l’Académie des Sciences de Paris. 314:1355–1362.
- Toteu SF, Penaye J, Deloule E, Van Schmus WR, Tchameni R. 2006. Diachronous evolution of volcano-sedimentary basins north of the Congo Craton: Insights from U–Pb ion microprobe dating of zircons from the Poli, Lom and Yaoundé Groups (Cameroon). Afr Earth Sci. 44(4–5):428–442. doi: 10.1016/j.jafrearsci.2005.11.011.
- Toteu SF, Penaye J, Poudjom Djomani YH. 2004. Geodynamic evolution of the pan-African belt in Central Africa with special reference to Cameroon. Can J Earth Sci. 41(1):73–85. doi: 10.1139/E03-079.
- Tselentis G-A, Drakopoulos J, Dimitriadis K. 1988. A spectral approach to Moho depths estimation from gravity measurements in Epirus (NW Greece). J Phys Earth. 36(6):255–266. doi: 10.4294/jpe1952.36.255.
- Vargas CA, Idarraga-Garcia J, Salazar JM. 2015. Curie point depths in northwestern South America and the southwestern Caribbean Sea.
- Xu Y, Hao T, Zeyen H, Nan F. 2017. Curie point depths in North China Craton based on spectral analysis of magnetic anomalies. Pure Appl Geophys. 174(1):339347. doi: 10.1007/s00024-016-1421-x.