
 ?Mathematical formulae have been encoded as MathML and are displayed in this HTML version using MathJax in order to improve their display. Uncheck the box to turn MathJax off. This feature requires Javascript. Click on a formula to zoom.
ABSTRACT
Studies have compared the chemical properties of tobacco smoke to those of cannabis smoke, with the objective of identifying the chemical attributes responsible for the mutagenicity and carcinogenicity of cannabis smoke. Comparative studies have included small sample sizes and produced conflicting results. The aim of this study was to assess the major chemical and physical variations of cannabis smoke across a range of cannabis samples of different potencies and origins, sourced from the illegal market in New Zealand. Twelve cannabis samples were studied ranging from 1.0% to 13.4% delta-9-tetrahydrocannabinol (Δ9THC) content. A smoking machine was used to smoke “joints” (cannabis cigarettes) and the chemical/physical properties of the smoke assessed. The chemical constituents of the smoke extracts were analysed by gas chromatography/mass spectrometry. A range of different chemical constituents (in addition to Δ9THC) were identified and their concentrations estimated. Terpenoids were identified as the major variable in cannabis smoke, showing a 40-fold range in total terpenoid content. Analysis of the total particulate matter showed that significantly different levels of particulate matter were produced between the different cannabis samples, ranging from 14.6 to 66.3 mg/g of cannabis smoked. The Δ9THC delivery efficiency during smoking was also investigated and produced consistent results showing a mean and median of 12.6% and 10.8%, respectively, of the theoretically available Δ9THC (ranging from 7.2% to 28.0%).
Introduction
Cannabis sativa L. (herein referred to as “cannabis”) is a plant that has a long international history of therapeutic and recreational application [Citation1]. One major concern of cannabis use as a medicine is that the most common route of administration is inhalation via smoking. Literature available on the smoke chemistry of tobacco, leaves little doubt that smoking any plant material produces a range of compounds that have toxic effects on the human body, in particular, carcinogens [Citation2]. Negative health consequences of smoke carcinogens raise questions about smoking cannabis for medicinal purposes.
Like tobacco, the smoking of cannabis has been associated with a diverse range of cancers [Citation3,Citation4]. Work conducted in North Africa found an association between lung cancer and cannabis smoking [Citation5–7], whereas USA case-control [Citation8] and retrospective cohort [Citation9] studies failed to find an association between cannabis smoke and lung cancer. These studies may have been influenced by confounding variables such as the combining of cannabis and tobacco in cannabis joints, or the fact that cannabis smokers are often also tobacco smokers [Citation10]. Furthermore, a large pooled analysis of published and unpublished data found little evidence to suggest an increased risk in lung cancer [Citation11]. A case-control study undertaken in New Zealand (NZ), where the use of tobacco/cannabis mixtures is less common, showed an 8% increase in the risk of lung cancer for a cannabis smoker per joint year (one “joint year” being the equivalent of one joint per day for one year) [Citation10].
Research has focused on the effects that smoking cannabis has on the function of human lungs, as it is reasonable to assume that they will be similar to that of tobacco smoke, which is known to lead to conditions such as chronic obstructive pulmonary disease [Citation12]. It has been suggested that the effects of one joint are equivalent to that of 2.5–5 tobacco cigarettes in terms of airflow obstruction and hyperinflation, due to the way cannabis is smoked, i.e. without a filter, with a shorter butt length, and with deeper/longer inhalation [Citation13].
A review of molecular biological techniques to assess the toxicity of cannabis smoke showed contradictory results. These studies also used a limited variety of cannabis samples [Citation14–16]. Maertens et al. [Citation16] noted that although their results suggested a higher level of toxicity in cannabis smoke than tobacco smoke, it would be necessary to experiment across a variety of cannabis samples.
To date, studies have investigated the composition and properties of cannabis smoke [Citation17–21], and have compared it to cigarette smoke [Citation22–27]. Studies have also examined the composition and properties of cannabis smoke produced by different methods of smoking [Citation28–34]. Most studies have been limited to the comparison of one or two cannabis materials and tobacco products. When two or more cannabis varieties have been compared, only limited quantitative and qualitative differences have been demonstrated [Citation35]. The results are also contradictory. For example, some studies have reported benzo[a]pyrene (B[a]P) at greater levels in cannabis smoke than tobacco smoke [Citation22], whilst others report cannabis smoke to have less B[a]P [Citation27]. A reason for disagreement between the studies of cannabis smoke may be the source or variety of the cannabis being tested, just as different tobacco products show different smoke properties [Citation36]. Cannabis smoke studies have provided substantial information on the constituents of cannabis smoke, however it is difficult to draw any conclusions regarding the variability from different sources of cannabis.
Most research investigating cannabis smoke has used a single source of cannabis [Citation23,Citation27], and in studies where more than one cannabis sample was used, the sample size and range were limited with respect to relative potency (e.g. two cannabis samples with potencies of 1.3% and 4.5% delta-9-tetrahydrocannabinol (Δ9THC) [Citation25], or 1.3% and 4.4% Δ9THC [Citation26]). Other than the single study by Fischedick et al. [Citation33], using medicinal cannabis from a single source (6.2%, 10.3% and 21.7% Δ9THC), the highest plant Δ9THC content previously tested was 4.5% [Citation25] and the lowest was 0.3% [Citation35]. A study by Sparacino et al. [Citation26] states that, despite knowledge of higher Δ9THC levels, the cannabis sample potencies tested were a practical representation of the market.
With contradicting conclusions and results on the use, toxicity and constituents of cannabis smoke, we chose to investigate the composition of cannabis smoke from a larger sample set and greater variety of cannabis samples. It may be that some strains, potencies or growing conditions of cannabis contribute variability to smoke constituents, and the delivery of active constituents to the smoker. The primary aim of this study was to compare the differences in cannabis smoke composition when a range of cannabis samples were analysed in the same laboratory, under the same conditions, using the same techniques. The present study fills in the gaps of the analysis of cannabis smoke from a broader range of cannabis potencies and cannabis samples available in NZ, from the illicit street market from different sources and growing conditions, as opposed to cannabis grown under strict pharmaceutical conditions or smoked under different conditions.
Materials and methods
Smoking machine
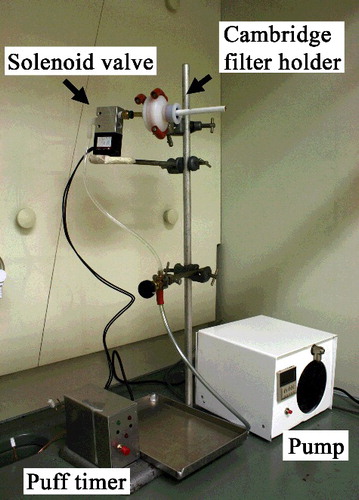
A smoking machine was used, which was made in-house with parts adapted from a TE-2 smoking machine, purchased from Teague enterprises (Woodland, USA), and parts purchased from Cerulean (Milton Keynes, UK) to meet as many criteria as possible of the International Organization for Standardization (ISO) standard for routine analytical cigarette-smoking machines [Citation37]. Smoking experiments, performed under the ISO conditions of 35 mL puffs with a duration of 2 s at intervals of 60 s, used Kentucky reference cigarettes (3R4F) as controls. We measured the total particulate matter (TPM) weights and nicotine levels in the TPM in order to validate the in-house smoking machine and repeatability of nicotine quantitation using the gas chromatography/mass spectrometry (GC/MS) methods described [Citation38]. The repeatability of nicotine quantitation and the expected amount of TPM agreed with the expected variability from smoking machines found in international studies [Citation39]. shows the smoking machine used in this study.
Figure 1. The smoking machine used in this study.
Cannabis samples were ground in a SharpStone® grinder specifically designed for the task of grinding cannabis, and purchased from Cosmic Corner in Wellington, NZ. We inserted approximately 650 mg of each ground cannabis sample into Gizeh Silver tip King Size Cigarette tubes™ using an Aztec Ezyfil Tube filling machine™ purchased from Gentlemen's Corner, Auckland, NZ. Following preliminary experiments, the mass of 650 mg of cannabis was chosen as the most consistent that could be packed into the cigarette tubes used. To ensure smoking consistency, each joint was stopped after the puff that would leave the butt length as close as possible to 20 mm.
Chemicals and standards
Certified Δ9THC (1.000 ± 0.043) mg/mL and nicotine (1.000 ± 0.006) mg/mL reference standards in MeOH were purchased from Cerilliant® Analytical Reference Standards (Round Rock, USA). Isopropyl alcohol (IPA) and MeOH (analytical grade) were purchased from Thermo Fisher (North Shore City, NZ). The Cambridge filter holder (used to collect TPM from the cigarette smoke) was purchased from Cerulean.
Cannabis plant samples
Cannabis plant samples (a total of 12) acquired from the Institute of Environmental Science and Research (ESR), NZ came from police cannabis seizures in the North Island of NZ. We selected cannabis samples, using limited information, to reflect different areas of NZ, different growing conditions and different types of plant material (full sample information cannot be provided due to legal restrictions).
Δ9THC Content of cannabis plant samples
The Δ9THC content of the cannabis plant samples was measured by air-drying a sub-sample overnight in the laboratory before accurately weighing 100 mg into 10 mL test tubes [Citation40]. The samples were extracted by sonication for 15 min in 5 mL of IPA. The solvent was transferred to a 50 mL volumetric flask via a 0.45 µm nylon syringe filter. This extraction was repeated three times and the extracts added to the same volumetric flask. The sample tubes were washed three more times and combined with the previous extracts, and the 50 mL flasks were made up to volume with IPA. Semi-quantitation of Δ9THC content by GC/MS used the parameters listed in [Citation41,Citation42]. The Δ9THC content of the cannabis plant material is hereafter referred to as CTHC. Preliminary experiments with Δ9THC extraction showed that the procedure produced consistent results for CTHC from the same cannabis sample (when extracted in triplicate). Given limited sample sizes, we tested each cannabis sample for CTHC once from a sub-sample that represented the cannabis smoked in the smoking experiments.
Table 1. Gas chromatography/mass spectrometry (GC/MS) parameters for the analysis of Δ9THC.
A semi-quantitation using the Δ9THC standard diluted in IPA to concentrations of 50, 100 and 200 µg/mL was performed. Samples were diluted with IPA when necessary to obtain a result inside the calibration curve.
The cannabis Δ9THC extract concentration from a sample requiring a two-fold dilution is used in the following example to demonstrate how we calculated the CTHC of the plant material:(1)
(1)
(2)
(2)
Joint smoking parameters, extraction and analysis of TPM
Joints were analysed in batches of five after pre-conditioning for a minimum of 48 h at 25 °C and 60% relative humidity. Before smoking, we cut the cigarette filter from the end to represent smoking without a filter [Citation10]. During smoking, the TPM of the mainstream smoke (MSS) of all five joints was collected on a single pre-weighed Cambridge filter holder (containing a filter). The holder and joint butts of the joints were re-weighed to determine the mass of the TPM and the total amount of cannabis smoked. Because of the inability to stop a joint being smoked at an exact butt length or after a consistent number of puffs, we recorded the total mass of cannabis smoked in each session and calculated the TPM per gram of cannabis smoked to normalize the amount of TPM. After removing the “TPM” filter, a second filter was used to wipe any remaining TPM from the inside [Citation43]. Both filters were placed in a 50 mL conical flask and 20 mL of MeOH added, before shaking at 200 rpm for 30 min, filtering using 0.45 µm polyvinylidene difluoride syringe filters and transferring to 2 mL amber vials for GC/MS analysis using the conditions listed in .
Table 2. Gas chromatography/mass spectrometry (GC/MS) parameters for the analysis of cannabis smoke extracts.
Compounds in the methanolic extraction of the TPM were identified by comparison with a Wiley MS library (7th edition, 80% spectral match). We used a response factor from an external nicotine standard curve, run at concentrations of 3.1, 12.5 and 25.0 µg/mL (R2 ≥ 0.98), to estimate the concentration of compounds, other than Δ9THC, identified in the smoke extracts [Citation36]. Interpretation of results for compounds other than nicotine and Δ9THC should therefore be considered semi-quantitative and for comparative purposes between the samples of cannabis. Nicotine was not found in the cannabis samples.
As we found Δ9THC at high concentrations in all the TPM extracts, we determined the Δ9THC concentration using appropriate dilutions. We analysed each cannabis sample in duplicate and assessed the variability using the appropriate statistics [Citation44].
To estimate the concentrations of the different chemical constituents in the cannabis smoke extracts, we selected 3 cannabis samples (1.0%, 13.4% and 9.0% CTHC) from the 12 samples and analysed them in duplicate to determine identifiable compounds. We integrated peaks in the total ion chromatograms (TICs) with parameters set to a minimum total ion current peak height of 200 000. We chose this peak height to represent approximately five times the signal-to-noise ratio. Limitations of the MS library meant that the identification of the cannabinoids eluting close to Δ9THC could not be completed, and is therefore excluded. This method was used as a pragmatic way of screening, given the number of different compounds/standards available and the unknown variation.
Delivery efficiency of Δ9THC in cannabis smoke
The Δ9THC concentrations measured in the TPM allowed us to calculate the total amount of Δ9THC delivered in the joint-smoking process, referred to as the “delivery efficiency”. The delivery efficiency is calculated by determining the total amount of Δ9THC in the TPM and dividing this by the amount of Δ9THC theoretically available in the mass of cannabis smoked:(3)
(3) Measuring the Δ9THC delivery efficiency is important because previous studies have suggested that most of the Δ9THC in the joint does not transfer to the MSS [Citation32,Citation45], whilst others have reported that over 60% is transferred to the MSS under different combustion conditions [Citation30,Citation46].
TPM Accounted for by Δ9THC
We also determined the percentage of TPM, for all duplicate results, accounted for by Δ9THC, i.e. the percentage of the TPM by mass that was Δ9THC:(4)
(4)
Determining the percentage of TPM that is accounted for by Δ9THC is important because it may provide information regarding harm reduction, i.e. cannabis materials that release higher levels of Δ9THC in smoke relative to other particulates. Similar studies have investigated this idea using vaporizers [Citation29].
Statistical analysis
Analysis of variance (ANOVA) and the t-test were used in this study to determine if the variables measured were statistically different between cannabis samples. ANOVA is a statistical method commonly used to determine if there are significant differences between the sample means of data-sets. To test for significant differences between only two means, the t-test can be performed. Using either test, results are generally considered significant if the P-value < 0.05 (95% probability) and this was deemed appropriate for the results in this study [Citation47]. Statistical tests were performed using Microsoft Excel 2010, version: 14.07194.5000.
Results
Cannabis sample Δ9THC content
There was a range (1.0%–13.4%) in CTHC in the 12 cannabis samples, as shown in . One sample, which consisted mainly of cannabis leaf material (as opposed to flowering heads), had the third lowest level of CTHC (1.9%). Whilst we had some information regarding the geographical location of the cannabis, our sample numbers prohibit meaningful regional comparisons.
Table 3. The Δ9THC content (CTHC), total particulate matter (TPM), delivery efficiency and mass of terpenoid data for the cannabis samples in this study.
TPM Collected from joints
The mass of TPM produced from the cannabis samples ranged from 14.6 to 66.3 mg/g (). We observed, using ANOVA of the duplicate results in , significant differences in the levels of TPM per gram of cannabis smoked between the different cannabis samples (P < 0.001), although there was no clear relationship to a factor other than the samples being different sources of cannabis.
Δ9THC Levels in the cannabis smoke TPM
The percentage of TPM accounted for by Δ9THC appears to separate into two groups; four cannabis samples with CTHC < 5.8% produced one group where the Δ9THC accounts for a lower percentage of the TPM (mean 8.8%), and the higher CTHC samples (CTHC ≥ 5.8%) produced TPM where the Δ9THC accounts for a much higher percentage (mean 25.5%) (see EquationEquation (4)(4)
(4) ). The groups were treated as independent means and a two-tailed unpaired t-test was performed showing a strong significant difference between the two: tstat = −9.14, tcrit = 2.11, P < 1 × 10⁻⁷ (see for individual sample results).
The delivery efficiency of Δ9THC during smoking is reasonably consistent across all the cannabis samples (). The mean and median delivery efficiencies are 12.6% and 10.8%, respectively (range 7.2–28.0%). The cannabis sample with CTHC = 5.8% differs from the other samples, delivering a higher percentage of the theoretically available Δ9THC. The 5.8% CTHC sample is also isolated from the other cannabis samples in terms of potency, with the nearest potencies being 2.7% and 9.0% CTHC [Citation38]. The numerical results are listed in .
Compounds detected in the cannabis smoke TPM
As expected, we found the most abundant groups of compounds in the cannabis smoke TPM to be cannabinoids. is an example TIC of a cannabis smoke TPM extract with labels indicating the areas of cannabinoids and other classes of identifiable compounds. We examined all of the cannabis smoke extract chromatograms, with three chosen for thorough interpretation (1.0%, 13.4% and 9.0% CTHC) to cover the range of Δ9THC potencies observed.
Figure 2. An example of a total ion chromatogram (TIC) of the total particulate matter (TPM) collected from five cannabis joints of a single cannabis sample (12.2% CTHC).
Terpenoids
We investigated all 12 cannabis samples further for terpenoid content. The region in the chromatograms associated with terpenoids showed a general increase in both number and total concentration of terpenoids detected with increasing CTHC. ANOVA of the results showed that the number of measurable terpenoids in the lowest CTHC sample is significantly lower than the number in samples with higher CTHC (P < 0.001). In the three lowest CTHC cannabis samples (1.0%, 1.4% and 1.9% CTHC), only three or fewer terpenoids were measureable. At higher CTHC levels (12.2% CTHC), we detected 25 different terpenoids and estimated their yields. The total mass of terpenoids (µg) per gram of cannabis smoked can be used as an indicator of the total variability of terpenoid content in different cannabis samples ().
The variability observed in the total mass of terpenoids per gram of cannabis smoked vs. CTHC may be a natural variable of the smoking process. The results strongly indicate a general increase with increasing CTHC ( and ). Variability in the identity of the different terpenoids from each cannabis TPM extract can also be seen. shows the terpenoids identified in all 12 samples. Some terpenoids in are listed multiple times due to the lack of readily available standards, and ambiguity in the identification of terpenoids in cannabis as there are more than 20 000 known terpenoids [Citation48]. However, based on the order of elution, retention times (RTs) and library matching, any repeats of minor isomers are distinguishable as different terpenoids.
Figure 3. Scatter diagram of the estimated total mass of terpenoids in the TPM vs. the Δ9THC content (CTHC).
Table 4. Terpenoids identified and their estimated mass in the cannabis smoke TPM extracts, presented as µg/g of cannabis smoked (Rep 1, Rep 2).
Discussion
The analysis of a range of cannabis samples has identified novel properties of cannabis smoke, which may be linked to the source or type of cannabis material.
The cannabis CTHC levels obtained indicate that the cannabis samples used cover a realistic range, based on national and international work [Citation40–42,Citation49–53]. It has often been noted in international studies that over time, there has been an increase in the CTHC of cannabis. A published NZ study, analysing cannabis from the illegal market, reported cannabis CTHC levels between 1976 and 1996 [Citation40], and indicated that at the time of publication (2000), no cannabis above 10% CTHC had been tested in NZ. More recent testing in NZ has shown a maximum of 18.1% CTHC cannabis (Personal communication, Robyn Somerville ESR, 2016). This study contains five samples that are above 10%, with a maximum of 13.4% CTHC and may indicate an increasing trend in cannabis CTHC levels on the NZ market. A grow study performed in NZ showed that cannabis sourced in NZ has the potential to produce flowering heads containing up to 30% CTHC [Citation54], although this has yet to be seen.
Our results indicate significant differences in the levels of TPM received by a smoker from different cannabis samples. There is some suggestion from our results of a general increase in TPM with increasing CTHC; however, exceptions, notably, that the lowest CTHC material (1.0%) produced a significantly higher level of TPM when compared with the two closest CTHC samples (1.4% and 1.9%). A possibility for this observation may be the growing conditions of the cannabis samples, or the type of plant material.
The percentage of TPM accounted for by Δ9THC correlated to CTHC, shows that the smoker is receiving more Δ9THC per unit of TPM when smoking cannabis material with a higher CTHC. This is expected, as the higher CTHC accounts for an increased proportion of TPM in the smoke.
As mentioned above, the Δ9THC delivery efficiencies are reasonably consistent across all the cannabis samples, but it is not clear why the 5.8% CTHC cannabis sample is an outlier (although not statistically so). A study by Fehr and Kalant [Citation46] reported higher Δ9THC delivery efficiencies (between 34.2% and 62.2%) however, they used different flow-rates/puffing conditions for a single cannabis sample, rather than constant smoking behaviour for multiple cannabis samples. Fehr and Kalant also combusted the entire cannabis material in the joint (including the butt) and thus their results are not directly comparable with ours. The results reported here represent, in our view, realistic delivery efficiencies under the smoking conditions used. Estimations that up to 50% of the Δ9THC is lost in sidestream smoke, up to 30% is destroyed by pyrolysis and 10% is trapped in the butt of the joint have been reported [Citation32,Citation45]. The present study fills in the gaps of accessing Δ9THC recovery from multiple cannabis samples with a diverse range of potencies. Our results indicate that the percentage of available Δ9THC delivered in the MSS remains consistent when the joints are smoked in a consistent way. When the Δ9THC delivery efficiencies and percentages of TPM accounted for by Δ9THC are considered together, it suggests that the combustion and composition of cannabis smoke are not consistent between samples from varying sources.
There have been suggestions that terpenoids play an important role in the therapeutic effects of cannabis [Citation33,Citation55,Citation56]. Some research promotes the concept that cannabis has other herbal and synergistic components, as well as Δ9THC, and therefore medicinal products containing only Δ9THC are potentially less effective therapeutically [Citation56]. Various terpenoids that are found in cannabis are known to have pharmacological properties themselves. For example, caryophyllene (detected in this research) is reported to be an agonist to the CB2 receptor and to provide anti-inflammatory effects [Citation57]. β-Elemene (also detected) has been shown to have anti-carcinogenic properties [Citation58]. In contrast to the potential therapeutic applications of terpenoids, there is also evidence that they are precursors for poly-aromatic hydrocarbons [Citation59], which raises the question of toxic side-effects. The results of the terpenoids analysis in this study show that not only is the total mass of terpenoids greater in cannabis samples with higher CTHC levels, but there is a significant variability in the terpenoids in each sample. Previous research showed similar correlations between terpenoid and cannabinoid composition in cannabis plant material [Citation55], and there are also reports of terpenoids as a major constituent of cannabis smoke [Citation33]. In contrast, our results suggest that terpenoids are one of the most variable constituents of cannabis smoke with potentially a 40-fold variation between samples. Whilst the study by Fischedick et al. [Citation33] identified terpenoids as a major constituent of cannabis smoke, it was not directed at the variability of terpenoids, but rather the binding affinity of smoke extracts to cannabinoid receptors. Hence, Fischedick et al. [Citation33] may not have identified the variability of terpenoids presented here.
The terpenoids identified in this study are primarily sesquiterpenoids, but monoterpenoids are also present. This could be due to the taxonomy of the cannabis samples grown in NZ or a consequence of cannabis storage. It has been shown that the composition of terpenoids in the production of essential oils not only depends on the method of production of the oil but also on growing conditions such as soil, climate, growth stage, harvest time and previous storage of the plant material [Citation60].
Conclusion
In conjunction with cannabinoids, we found terpenoids to be the most variable component of cannabis smoke. Our results show that in cannabis smoke, terpenoids show a total increase with increasing Δ9THC content. The potential for terpenoids to be precursors for carcinogens highlights the question of smoking technique, as smoking cannabis joints with higher levels of Δ9THC may lead to higher levels of carcinogens such as B[a]P.
There is a general increase in the TPM of cannabis smoke with increasing cannabis plant Δ9THC content. An increased level of TPM may have detrimental effects on the user, including carcinogenicity and respiratory irritation, and the Δ9THC results from this study also show that when cannabis is smoked under the same conditions, the Δ9THC delivery efficiency is consistent across a range of cannabis potencies. In terms of delivery efficiency, we found the cannabis sample with a potency of 5.8% CTHC to be more efficient than the other cannabis samples (approximately 25% delivery efficiency). Other than the single outlier, the mean and median delivery efficiencies of Δ9THC are approximately 13% and 11%, respectively, and the 5.8% CTHC sample lies in a potency gap between the other samples.
The results also showed that the percentage of TPM accounted for by Δ9THC has a tendency to reach a maximum at higher potencies. This suggests that once the cannabis reaches a certain Δ9THC level, the smoker receives a consistently higher ratio of Δ9THC to TPM, whereas at lower potencies the smoker receives less Δ9THC per unit of TPM, and this raises the question of whether or not there are health benefits in smoking cannabis with a higher CTHC.
The cannabis samples tested showed a range of 1.0–13.4% CTHC content. Not only has this range of cannabis potencies allowed us to uncover trends in the chemistry of cannabis smoke, but it also validates that the findings are relevant to the toxicology of cannabis smoke produced from a representative sample of the cannabis available in national and international markets.
Compliance with ethical standards
No human participants or animals were used in this study.
Acknowledgments
This work was carried out in fulfilment of the Master of Science (Forensic Science) programme through the University of Auckland, New Zealand.
Thanks go to Stewart Edwards and Robyn Somerville for their suggestions and approval of the article, with extra thanks to Robyn for her provision of data relating to cannabis potency.
The authors would also like to thank the two anonymous reviewers for their helpful comments and suggestions.
Disclosure statement
The authors declare no potential conflicts of interest with respect to the research, authorship and/or publication of this article.
Additional information
Funding
References
- Russo EB. History of cannabis and its preparations in saga, science, and sobriquet. Chem Biodivers. 2007;4:1614–1648.
- Gray NJ. Nicotine yesterday, today, and tomorrow: a global review. Nicotine Tob Res. 2014;16:128–136.
- Tomar RS, Beaumont J, Hsieh JCY. Evidence on the carcinogenicity of marijuana smoke. Sacramento (CA): Office of Environmental Health Hazard Assessment; 2009. Available from: http://oehha.ca.gov/prop65/hazard_ident/pdf_zip/FinalMJsmokeHID.pdf
- Melamede R. Cannabis and tobacco smoke are not equally carcinogenic. Harm Reduct J. 2005;2:21–24.
- Hsairi M, Achour N, Zouari B, et al. Etiologic factors in primary bronchial carcinoma in Tunisia. Tunis Med. 1993;71:265–268.
- Sasco AJ, Merrill RM, Dari I, et al. A case-control study of lung cancer in Casablanca, Morocco. Cancer Causes Control. 2002;13:609–616.
- Voirin N, Berthiller J, Benhaïm-Luzon V, et al. Risk of lung cancer and past use of cannabis in Tunisia. J Thorac Oncol. 2006;1:577–579.
- Hashibe M, Morgenstern H, Cui Y, et al. Marijuana use and the risk of lung and upper aerodigestive tract cancers: results of a population-based case-control study. Cancer Epidemiol Biomark Prev. 2006;15:1829–1834.
- Sidney S, Quesenberry CP, Friedman GD, et al. Marijuana use and cancer incidence (California, United States). Cancer Causes Control. 1997;8:722–728.
- Aldington S, Harwood M, Cox B, et al. Cannabis use and risk of lung cancer: a case-control study. Eur Resp J. 2008;31:280–286.
- Zhang LR, Morgenstern H, Greenland S, et al. Cannabis smoking and lung cancer risk: pooled analysis in the International Lung Cancer Consortium. Int J Cancer. 2015;136:894–903.
- Tashkin DP. Does smoking marijuana increase the risk of chronic obstructive pulmonary disease? Can Med Assoc J. 2009;180:797–798.
- Aldington S, Williams M, Nowitz M, et al. Effects of cannabis on pulmonary structure, function and symptoms. Thorax. 2007;62:1058–1063.
- Busch FW, Seid DA, Wei ET. Mutagenic activity of marihuana smoke condensates. Cancer Lett. 1979;6:319–324.
- Wehner FC, Vanrensburg SJ, Thiel PG. Mutagenicity of marijuana and Transkei tobacco smoke condensates in the salmonella/microsome assay. Mutat Res. 1980;77:135–142.
- Maertens RM, White PA, Rickert W, et al. The genotoxicity of mainstream and sidestream marijuana and tobacco smoke condensates. Chem Res Toxicol. 2009;22:1406–1414.
- Adams TC, Jones LA. Long-chain hydrocarbons of cannabis and its smoke. J Agric Food Chem. 1973;21:1129–1131.
- Chait LD, Pierri J. Some physical characteristics of NIDA marijuana cigarettes. Addict Behav. 1989;14:61–67.
- Fentiman AF Jr., Foltz RL, Kinzer GW. Identification of noncannabinoid phenols in marihuana smoke condensate using chemical ionization mass spectrometry. Anal Chem. 1973;45:580–583.
- Haq MZ, Rose SJ, Deideric LR, et al. Identification and quantitative mesurement of some N-heterocyclics in marijuana smoke condensates. Anal Chem. 1974;46:1781–1785.
- Patel AR, Gori GB. Preparation and monitoring of marijuana smoke condensate samples. Bull Narc. 1975;27:47–54.
- Hoffmann D, Brunnermann KD, Gori GB, et al. On the carcinogenicity of marijuana smoke. In: Runeckles VC, editor. Recent advances in phytochemistry. New York (NY): Plenum Press; 1975. p. 63–81.
- Lee ML, Novotny M, Bartle KD. Gas chromatography/mass spectrometric and nuclear magnetic resonance spectrometric studies of carcinogenic polynuclear aromatic hydrocarbons in tobacco and marijuana smoke condensates. Anal Chem. 1976;48:405–416.
- Novotny M, Merli F, Wiesler D, et al. Composition of the basic fraction of marijuana and tobacco condensates: a comparative study by capillary GC/MS. Chromatographia. 1982;15:564–568.
- Rickert WS, Robinson JC, Rogers B. A comparison of tar, carbon monoxide and pH levels in smoke from marihuana and tobacco cigarettes. Can J Public Health. 1982;73:386–391.
- Sparacino CM, Hyldburg PA, Hughes TJ. Chemical and biological analysis of marijuana smoke condensate. NIDA Res Monogr. 1990;99:121–140.
- Moir D, Rickert WS, Levasseur G, et al. A comparison of mainstream and sidestream marijuana and tobacco cigarette smoke produced under two machine smoking conditions. Chem Res Toxicol. 2008;21:494–502.
- Gieringer D. Waterpipe study. MAPS Bull. 1996;6:59–63.
- Pomahacova B, Van der Kooy F, Verpoorte R. Cannabis smoke condensate III: the cannabinoid content of vaporised Cannabis sativa. Inhal Toxicol. 2009;21:1108–1112.
- Van der Kooy F, Pomahacova B, Verpoorte R. Cannabis smoke condensate I: the effect of different preparation methods on tetrahydrocannabinol levels. Inhal Toxicol. 2008;20:801–804.
- Van der Kooy F, Pomahacova B, Verpoorte R. Cannabis smoke condensate II: influence of tobacco on tetrahydrocannabinol levels. Inhal Toxicol. 2009;21:87–90.
- Gieringer D, St. Laurent J, Goodrich S. Cannabis vaporizer combines efficient delivery of THC with effective suppression of pyrolytic compounds. J Cannabis Ther. 2004;4:2–27.
- Fischedick JT, Van Der Kooy F, Verpoorte R. Cannabinoid receptor 1 binding activity and quantitative analysis of Cannabis sativa L. smoke and vapor. Chem Pharm Bull. 2010;58:201–207.
- Lanz C, Mattsson J, Soydaner U, et al. Medicinal cannabis: in vitro validation of vaporizers for the smoke-free inhalation of cannabis. PLoS One. 2016;11:e0147286.
- Maskarinec MP, Alexander G, Novotny M. Analysis of the acidic fraction of marijuana smoke condensate by capillary gas chromatography–mass spectrometry. J Chromatogr. 1976;126:559–568.
- Marcilla A, Martínez I, Berenguer D, et al. Comparative study of the main characteristics and composition of the mainstream smoke of ten cigarette brands sold in Spain. Food Chem Toxicol. 2012;50:1317–1333.
- International Organization for Standardization (ISO). Routine analytical cigarette smoking machine – definitions and standard conditions. Geneva: ISO; 2000. Standard No. ISO 3308:2000(E ).
- Sheehan TJ. The chemical and physical variations of cannabis and synthetic cannabis smoke [master's thesis]. Auckland: University of Auckland; 2014.
- Thomsen H, Boder JB, Kroeger R, et al. CORESTA report 91/1: determination of repeatability and reproducibility for the measurement of nicotine-free dry particulate matter, nicotine, water, using CRMs 7, 8, 21, 22, 23 and 25 1991. Paris: Cooperation Centre for Scientific Research Relative to Tobacco; 2007. Available from: https://www.coresta.org/determination-repeatability-and-reproducibility-measurement-nicotine-free-dry-particulate-matter.
- Poulsen HA, Sutherland GJ. The potency of cannabis in New Zealand from 1976 to 1996. Sci Just. 2000;40:171–176.
- Tsumura Y, Aoki R, Tokieda Y, et al. A survey of the potency of Japanese illicit cannabis in fiscal year 2010. Forensic Sci Int. 2012;221:77–83.
- Bruci Z, Papoutsis I, Athanaselis S, et al. First systematic evaluation of the potency of Cannabis sativa plants grown in Albania. Forensic Sci Int. 2012;222:40–46.
- International Organization for Standardization (ISO). Cigarettes – determination of total and nicotine-free dry particulate matter using a routine analytical smoking machine. 2000. Standard No. ISO 4387: 2000(E)
- Synek V. Evaluation of the standard deviation from duplicate results. Accred Qual Assur. 2008;13:335–337.
- Truitt EB. Biological disposition of tetrahydrocannabinols. Pharmacol Rev. 1971;23:273–278.
- Fehr KO, Kalant H. Analysis of cannabis smoke obtained under different combustion conditions. Can J Physiol Pharmacol. 1972;50:761–767.
- Clewar AG, Scarisbrick DH. Practical statistics and experimental design for plant and crop science. Chichester (UK): Wiley; 2001.
- Hazekamp A, Tejkalová K, Papadimitriou S. Cannabis: from cultivar to chemovar II – a metabolomics approach to cannabis classification. Cannabis Cannabinoid Res. 2016;1:202–215.
- ElSohly MA, Ross SA, Mehmedic Z, et al. Potency trends of Δ9THC and other cannabinoids in confiscated marijuana from 1980–1997. J Forensic Sci. 2000;45:24–30.
- McLaren J, Swift W, Dillon P, et al. Cannabis potency and contamination: a review of the literature. Addiction. 2008;103:1100–1109.
- Mehmedic Z, Chandra S, Slade D, et al. Potency trends of Δ9-THC and other cannabinoids in confiscated cannabis preparations from 1993 to 2008. J Forensic Sci. 2010;55:1209–1217.
- Swift W, Wong A, Li KM, et al. Analysis of cannabis seizures in NSW, Australia: cannabis potency and cannabinoid profile. PLoS One. 2013;8:e70052.
- Zamengo L, Frison G, Bettin C, et al. Cannabis potency in the Venice area (Italy): update 2013. Drug Test Anal. 2015;7:255–258.
- Knight G, Hansen S, Connor M, et al. The results of an experimental indoor hydroponic cannabis growing study, using the ‘Screen of Green’ (ScrOG) method – yield, tetrahydrocannabinol (THC) and DNA analysis. Forensic Sci Int. 2010;202:36–44.
- Fischedick JT, Hazekamp A, Erkelens T, et al. Metabolic fingerprinting of Cannabis sativa L., cannabinoids and terpenoids for chemotaxonomic and drug standardization purposes. Phytochemistry. 2010;71:2058–2073.
- Russo EB, McPartland J. Cannabis is more than simply Δ9-tetrahydrocannabinol. Psychopharmacology. 2003;165:431–432.
- Gertsch J, Leonti M, Raduner S, et al. Beta-caryophyllene is a dietary cannabinoid. Proc Natl Acad Sci USA. 2008;105:9099–9104.
- Lu JJ, Dang YY, Huang M, et al. Anti-cancer properties of terpenoids isolated from Rhizoma Curcumae – a review. J Ethnopharmacol. 2012;143:406–411.
- Rodgman A, Smith CJ, Perfetti TA. The composition of cigarette smoke: a retrospective, with emphasis on polycyclic components. Hum Exp Toxicol. 2000;19:573–595.
- Turek C, Stintzing FC. Stability of essential oils: a review. Compr Rev Food Sci Food Saf. 2013;12:40–53.