
ABSTRACT
Introduction: Plant communities and soil factors might interact with each other in different temporal and spatial scales, which can influence the patterns and processes of the wetland ecosystem. To get a better understanding of the distribution of plants in wetlands and analyze their associations with environmental soil factors, the structure and types of plant communities in the eastern shore area of Lake Taihu were analyzed by two-way indicator species analysis and canonical correspondence analysis (CCA) ordination. The spatial distribution patterns of vegetation and the main factors affecting the distributions were investigated.Outcomes: Sixty-six sampling sites were selected to obtain vegetation species and soil environmental factor data. Results showed that 22 species from the 66 sites could be divided into seven communities: I: Arundo donax; II: A. donax + Phragmites australis; III: Zizania latifolia + Typha orientalis; IV: P. australis + Alternanthera philoxeroides + Polygonum hydropiper; V: P. australis; VI: P. australis + Humulus scandens; and VII: Erigeron acer + Ipomoea batatas + Rumex acetosa. Plant species and soil factors in the CCA analysis showed that I. batatas, E. acer, Chenopodium album, Polygonum lapathifolium, and Acalypha australis were mainly affected by pH, whereas Echinochloa crus-galli, Setaria viridis, and H. scandens were mainly affected by soil total phosphorus. Mentha canadensis and A. donax were mainly affected by soil conductivity, A. philoxeroides was mainly affected by soil organic matter and, Z. latifolia, Metaplexis japonica and P. hydropiper were mainly affected by available phosphorus.Conclusion:These results indicated that different plants adapted to different soil environmental factors and provided basic information on the diversity of Lake Taihu wetland vegetation.
Introduction
Wetlands are important habitats for many species of plants and animals at both national and international levels (Skeffington et al. Citation2006; Hebb et al. Citation2013; Wetser et al. Citation2015). A contribution to our understanding of how a community is put together, how it works, what determines the relative proportions of community members, and their spatial and temporal relationships with each other might contain something of value for describing wetlands. The vegetation in wetlands has been described by a number of authors who distinguished a variable number of wetland plant communities (Casanova and Brock Citation2000; Dekeyser, Kirby, and Ell Citation2003; O’Connell et al. Citation2012; Williams and Ahn Citation2015); these works suggested various aspects of soil conditions to be the main environmental factors affecting wetland plant communities, namely soil water content and soil nutrients including nitrogen, phosphorus, and organic carbon (Gilliam Citation2006; Li et al. Citation2010; Zheng, Chen, and Wu Citation2013; Jager et al. Citation2015; Wang et al. Citation2016). Wetland vegetation can effectively absorb nutrients from the surrounding soil.
As early as Citation1947, Watt wanted to know how the vegetation structure affected the microclimate and soil conditions; he found that the plants in his study areas were obviously patchy and the patches were irregular in size and shape and their juxtaposition varied. Benning and Seastedt (Citation1995) emphasized how vegetation patterns affected the soil moisture, nutrients, and other processes detailed. The relationship between vegetation and soil environmental factors has been widely discussed (Juan, Carlos, and Donaldo Citation2011; Mellado and Zamora Citation2015; Liu et al. Citation2016; Lucie, Jana, and Zuzana Citation2016). Soil environmental factors have important effects on plant growth and reproduction. Kang, Kang, and Ko (Citation2002) found that wetland ecosystems dominated by Phragmites japonica absorbed more than 66% of the inorganic nitrogen from the soil, concluding that the study area had strong absorption ability for soil nitrogen. The demand for nutrients in wetland plants also changes with the seasons (Picard, Fraser, and Steer Citation2005). Previous studies also showed that wetland vegetation was the main factor influencing nutrient retention, and the biodiversity of the wetland vegetation community was significantly correlated with nutrient retention (Hammersmark et al. Citation2009; Zhang, Yu, and Hu Citation2013). Gao, Yang, and Ou (Citation2007) showed that the type of vegetation growing affected wetland hydrological processes (such as hydrological conditions, nutrient cycling, and sediment deposition rate); for coastal wetlands, they concluded that the different soil environmental factors determined the pattern and process of the wetland vegetation. Wang et al. (Citation2011) studied the relationships between typical wetland vegetation and soil factors in Chaohu, which showed that soil nutrients were positively correlated with the biological diversity index and the uniformity index. Soil nutrients and salinity were the main factors influencing development and succession of salt marsh vegetation. Dong et al. (Citation2014) thought that soil moisture was the most important factor influencing vegetation distribution in the Poyang lake wetland; soil pH and total potassium content were also important soil environmental factors affecting the wetland vegetation distribution. Wang et al. (Citation2015) focused on the newly formed coastal wetland in the Yellow River Delta to analyze the distribution pattern of the plant community and found that soil salinity was the most important factor affecting the vegetation distribution pattern in the newly formed coastal wetland in the Yellow River Delta. Luo et al. (Citation2016) concluded that soil total nitrogen, soil total phosphorus, and soil water content were the main factors influencing vegetation type in the Huihe riparian wetland.
Previous studies generally focused on coastal or river wetlands; studies on fresh water lake wetland plant community composition and correlations with soil environmental factors were relatively infrequent. Lake Taihu plays an important role in China in supplying water for human consumption, industry, and agricultural production; it is a typical large shallow lake and is one of the five great lakes in the East China Plain. Its ecosystem has been deteriorating because of increasing levels of water pollution and eutrophication since the late 1970s. The deterioration of the ecological health of Lake Taihu has caused increasing concern and has been the subject of a number of studies. The eastern shore of Lake Taihu is one of the most economically developed regions in the Yangtze River Delta. The demand for geological environment including space and mineral resources is increasing with the growth of the economy; economic growth is likely to destroy the balance of the geological environment. Numerous investigations have been carried out to understand water quality, aquatic vegetation, ecosystem health assessment, and blue-green algae outbreaks in Lake Taihu (Kamrani et al. Citation2011; Li et al. Citation2012; Li et al. Citation2015). Unfortunately, studies have rarely considered the relationships between the spatial distribution of vegetation and soil factors, particularly in the eastern section of the Taihu lakeshore. In this study, we applied two-way indicator species analysis (TWINSPAN) to classify the types of plant communities in the eastern shore of Lake Taihu and used canonical correspondence analysis (CCA) to explain the spatial distribution of wetland vegetation and its response to soil environmental factors. A quantitative assessment of species co-occurrence and their relationship with environmental soil factors has not been carried out to date, and the aim here is to address this using multivariate analyses. It is important to gain as full an understanding as possible for the main environmental soil factors affecting wetland plant communities in terms of conservation importance and to prescribe relevant management recommendations.
The objective of this study, therefore, was to get a better understanding of the distribution patterns of plant communities and to investigate the main environmental soil factors affecting some of these communities. This paper deals with the vegetation aspect of a wider study that aimed to classify and evaluate the wetland with respect to soil factors as well as plant communities.
Materials and methods
Study area
The eastern shore of Lake Taihu is located approximately 150 km west of Shanghai, and its center has coordinates of 31°10ʹ0ʺN, 120°9ʹ0ʺE. Lake Taihu is a typical large shallow lake with an area of 2338 km2 and a mean depth of 1.89 m (Wang et al. Citation2016). The lake is very important for flood control, water supply, cultivation, irrigation, navigation, and tourism. The annual mean temperature of the eastern lake shore of Taihu is around 15°C and the mean annual rainfall is in the range of 1000–1500 mm (Ke et al. Citation2007; Yang et al. Citation2008; Hu et al. Citation2011). The main vegetation in the Eastern Taihu lakeshore includes Zizania latifolia, Phragmites australis, Arundo donax, Alternanthera philoxeroides, and Typha orientalis. Lake Taihu plays an important role in supplying water for drinking and industrial and agricultural production (Yang et al. Citation2008). Lake Taihu has a long history, and this region has been protected for a long time, so the vegetation communities have remained relatively stable for a long period.
Field survey
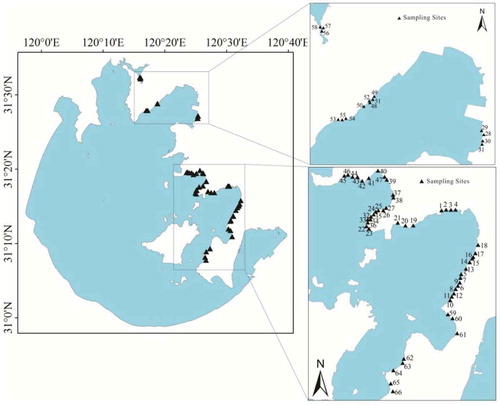
Vegetation data were collected at each site in August 2010. Sixty-six sites were established (), with three small plots (1 m × 1 m) at each site. All vascular plant species were surveyed, and species identification was carried out. The information recorded at each site included plant species, height, abundance, density, plant frequency, total coverage, and coverage of each species. The 66 sites were set up to systematically measure the characteristic parameters of the plants. At each site, the geographic location (LAT and LONG) was recorded with a handheld GPS unit (Garmin GPS62sc, Taiwan, China). The main plant species in the different sampling plots are presented in .
Table 1. Main plant species in the study area.
Figure 1. Sampling sites in the study area.
Soil types are mainly yellow and black soils in the study area. In each vegetation sample plot, three sample plots (10 cm × 10 cm) were randomly established to demonstrate the representativeness of each plot. Soil samples (0–20 cm) were collected and placed in new clean polythene bags. Soil samples were air-dried and the three soil samples from each sampling plot were evenly mixed and taken to the laboratory for analysis. Soil moisture content (MC), pH, conductivity (Cond), soil organic matter (SOM), total nitrogen, total phosphorus, potassium (K+), ammonium-nitrogen (NH4-N), available phosphorus (A-P), available nitrogen (A-N), and nitrate-N were analyzed, which together formed a 66 × 11 matrix of environmental factors. The soil analytical methods used for MC and environmental chemical factors were those described by Pansu and Gautheyrou (Citation2006).
Data analyses
The following equation (Qiu and Zhang Citation2000) was used to calculate species importance value of an herb:
TWINSPAN is internationally accepted as a hierarchical classification method that can simultaneously complete plot and species classifications and is widely used in vegetation ecology (Niall et al. Citation2007; Nkosi, Barrett, and Brown Citation2016). Ordination techniques reveal correlations between the spatial distribution of plant communities and environmental factors, which might have extremely important ecological significance (Kajsa and Johanna Citation2005). Ordination methods applied to plant communities can be divided into two types: direct and indirect (Zdravko Citation2005). Ordination theory has become an indispensable method in modern ecological vegetation studies because it objectively reflects the relationships between the spatial distribution of vegetation and environmental factors (Juan, Carlos, and Donaldo Citation2011). Canoco for Windows v4.5 was used in the CCA analysis to investigate the relationships between vegetation distribution and environmental factors. The nature of the relationships is shown in the ordination diagram by vectors with lengths proportional to their importance and directions showing their correlations with each axis. Soil variables were centered, standardized, and submitted to the Canoco “forward selection of explanatory variables” to avoid any artificial increase in the explained variation (Peres-Neto et al. Citation2006). A Monte Carlo permutation test was performed to determine the accuracy of the relationship (999 randomizations) between the two data sets.
Results
TWINSPAN classification
The abundance matrix of 22 plant species at the 66 sampling sites was used to analyze the vegetation communities by TWINSPAN. The study area average MC was 29% and average elevation about 4 m in the Eastern Taihu lakeshore, China. The phytosociological table is shown in the Appendix. The plant communities in the study area were divided into seven types (), with each being named based on the dominant species at each level and the indicator species classified by TWINSPAN.
Community I: A. donax
Figure 2. TWINSPAN classification of the 22 plant species.
P1 E. crus-galli, P2 M. canadensis, P3 I. batatas, P4 E. acer, P5 S. viridis, P6 B. pilosa, P7 C. album, P8 L. japonica, P9 Z. latifolia, P10 E. hirsutum, P11 P. australis, P12 A. donax, P13 H. scandens, P14 M. japonica, P15 P. hydropiper, P16 R. acetosa, P17 P. lapathifolium, P18 S. cannabina, P19 A. australis, P20 A. philoxeroides, P21 T. orientalis, and P22 G. max.
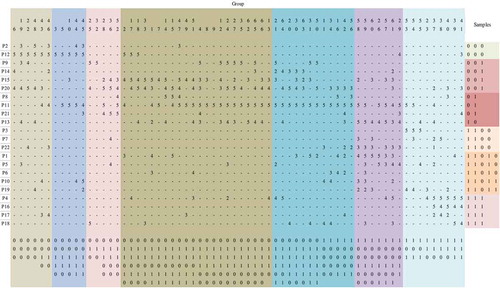
Community I included sampling sites 6, 19, 22, 48, 43, and 46. Other associated species included A. australis, A. philoxeroides, E. hirsutum, G. max, H. scandens, M. canadensis, M. japonica, P. australis, S. viridis, and Z. latifolia.
(2) Community II: A. donax + P. australis
Community II included sampling sites 3, 5, 10, 44, and 45. Other associated species included P. hydropiper, M. canadensis, E. hirsutum, and T. orientalis.
(3) Community III: Z. latifolia + T. orientalis
Community III included sampling sites 25, 32, 28, 36, and 52. Other associated species included A. philoxeroides, C. album, L. japonica, P. australis, P. hydropiper, S. cannabina, and S. viridis.
(4) Community IV: P. australis + A. philoxeroides + P. hydropiper
Community IV included sampling sites 2, 17, 18, 33, 1, 7, 14, 15, 47, 49, 51, 4, 8, 9, 12, 24, 27, 35, 62, 65, 66, and 13. Other associated species included A. donax, Bidens pilosa, E. crus-galli, E. acer, H. scandens, L. japonica, M. canadensis, M. japonica, P. lapathifolium, S. cannabina, S. viridis, T. orientalis, and Z. latifolia.
(5) Community V: P. australis
Community V included sampling sites 21, 64, 20, 30, 63 and 31, and 50, 11, 34, 16, 42 and 56. Other associated species included A. philoxeroides, E. crus-galli, E. hirsutum, E. acer, G. max, H. scandens, M. japonica, P. hydropiper, S. cannabina, S. viridis, and Z. latifolia.
(6) Community VI: P. australis + H. scandens
Community VI included sampling sites 58, 59, 60, 26, 57, 61, and 29. Other associated species included A. australis, A. philoxeroides, A. donax, B. pilosa, C. album, E. crus-galli, E. hirsutum, E. acer, G. max, M. japonica, P. hydropiper, S. cannabina, S. viridis, and T. orientalis.
(7) Community VII: E. acer + I. batatas + R. acetosa
Community VII included sampling sites 53, 54, 55, 23, 37, 38, 40, 39, and 41. Other associated species included A. australis, A. philoxeroides, A. donax, C. album, E. crus-galli, H. scandens, L. japonica, P. australis, P. lapathifolium, S. cannabina, S. viridis, and T. orientalis.
When the seven plant communities were analyzed, we found that A. donax distributed in both Communities I and II including 11 sites. P. australis distributed in Communities IV, V, and VI including 41 sites. These two plants were present in more communities and more sites than the other plants. Communities I and V were dominated by one plant: A. donax and P. australis, respectively. Communities II, III, and VI were dominated by two main plant types, and Communities IV and VII were dominated by three main plant types.
Relationship between vegetation spatial distribution and environmental factors
CCA was used to analyze the relationship between the 11 soil factors and wetland vegetation distribution on the Taihu lakeshore. is based on the species importance value and presents the results of CCA ordination of the species–environment relationships in the region (). The distribution of I. batatas, E. acer, C. album, P. lapathifolium, and A. australis was mainly affected by soil pH. The distribution of E. crus-galli, S. viridis, and H. scandens was mainly affected by soil TP (total phosphorus). The distribution of M. canadensis and A. donax was mainly affected by soil Cond. The distribution of A. philoxeroides was mainly affected by SOM. The distribution of Z. latifolia, M. japonica, and P. hydropiper was mainly affected by A-P.
Figure 3. Canonical correspondence analysis (CCA) ordination diagram for vegetation species and soil environmental variables.
CCA ordination diagram with plant species (Δ) and environmental variables (arrows); the first axis is horizontal, and the second is vertical. Abbreviations for the environmental variables as: SPX1 = the first vegetation species axis; SPX2 = the secondary species axis; SPX3 = the tertiary species axis; SPX4 = the fourth species axis; ENX1 = the first environmental factor axis; ENX2 = the secondary environmental factor axis; ENX3 = the tertiary environment factors axis; ENX4 = the fourth environmental factors axis. The vectors represent environmental variables. The length of the vector is proportional to its importance, and the angle between two vectors reflects the degree of correlation between variables. The angle between a vector and each axis is related to its correlation with the axes.
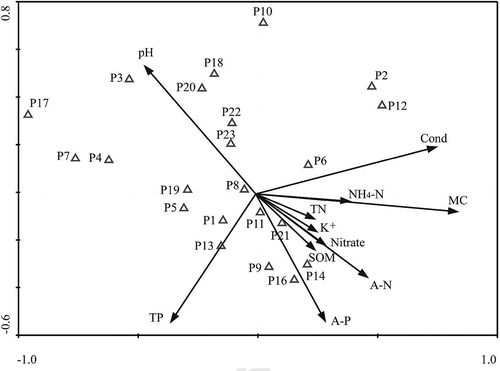
The eigenvalues of the first two ordination axes are 0.358 and 0.258, respectively, and the correlation coefficients for the first three vegetation species axes and environmental factor axes are 0.793, 0.747, and 0.680, respectively (). CCA ordination of the first three vegetation axes retained only 16.6% of the total variance of data, so the analysis might be missing a large part of the species information.
Table 2. Eigenvalues, species–environment correlation coefficients, and cumulative percentage for the first four axes.
Discussion
Relationship between vegetation and soil factors
The relationship between vegetation and environmental soil factors was assessed with CCA ordinations. The results of the ordination analysis showed that the cumulative percentage for the correlations between species and environmental factors for the first two axes explained 57.6% of the total variance. This indicated that soil environmental factors had a large impact on the distribution pattern of wetland plant communities. It has been suggested that the results of this type of analysis can be useful if the variance of eigenvectors represents over 40% of the total variance. Consequently, the first two axes are sufficient to reflect the relationship of vegetation species and environmental factors.
Vegetation and soil are the most conspicuous resources of wetlands. Quantifying the variation in species diversity and community composition with location provided the opportunity to infer possible mechanisms of vegetation community assembly (Kadowaki et al. Citation2014; Reid, Reid, and Thoms Citation2016; Yamaji et al. Citation2016). Similar results were found in lowlands, temperate forests, arid grasslands, beech forests, and natural forest (Peres-Neto et al. Citation2006; Dwirek, Kauffman, and Baham Citation2006). We found that the main factors affecting vegetation distribution were SOM, Cond, pH, TP, and A-P. SOM provides nutrients to plants, ensures plant production and development, and plays an important role in the sustainable development of the wetland. Cond contains rich information about physical properties and soil quality, which is crucial for plant growth (Jager et al. Citation2015). Soil pH was an important determinant of the productivity of a site and in the separation of plant groups (Dong et al. Citation2014). The effects of soil pH were both direct and indirect; direct effects were evidenced by the plant shape, material metabolism, growth, quality, and yield, while indirect effects were reflected in the impact of soil physical, chemical, and biological characteristics on plant growth (Kashian et al. Citation2003; Rola, Osyczka, and Nobis Citation2015). Phosphorus plays a fundamental role in plant nutrition and the concentration and availability of P determines to great extent the soil fertility and site productivity as P is required in relatively large amounts by plants. Bigelow and Canham (Citation2002) observed a direct correlation between P and the distribution of plant species in northeastern America. Amorim and Batalha (Citation2007) reported that P was the main factor that defined plant communities in Brazil, and nutrients in general played a major role in the classification of plant groups. A-P in the soil can be absorbed by the plant component; many other studies have noted the role of A-P in the distribution pattern of plant communities (Hammersmark et al. Citation2009; Mellado and Zamora Citation2015; Onur and Suha Citation2016).
The study of vegetation distribution in the eastern shore of Lake Taihu is important, as it is one of the key watershed wetlands in China. In addition to soil factors, the distribution of plant communities might be related to the specific geographical location providing unique habitats (Wassen, Peeters, and Venterink Citation2002; Dwirek, Kauffman, and Baham Citation2006; Mellado and Zamora Citation2015; Oliveira, Torezan, and Cunha Citation2015; Zellweger et al. Citation2015; Whitworth et al. Citation2016). The plant communities in the study area were divided into seven types, which had substantial differences in their growth requirements. The ordination analysis showed the correlation between wetland vegetation composition, species distribution, and the soil environment.
One of the main factors responsible for the separation of Communities I and II was soil conductivity. This was consistent with the finding that soil conductivity was one of the most important factors in structuring plant communities (Peres-Neto et al. Citation2006; Corriale, Picca, and Francescantonio Citation2013) and that A. donax, growing in Community I, tended to occur on clay soils. Only certain species, such as Z. latifolia and T. orientalis, were able to grow in Community III, and A-P was important in structuring this community; A-P was usually an important factor for vegetation development and distribution in wetlands and therefore it was significant in vegetation restoration in such areas (Ladányi et al. Citation2016). SOM might be rich in Community IV, and it characteristically had a high adsorption capability, which increased the exchange capacity of the soil and therefore improves its fertility levels (Zhang, Yu, and Hu Citation2013). Total phosphorus was important in structuring Community VI, while pH was the most important factor in structuring Community VII.
Guiding significance for wetland restoration
In soil–vegetation systems, soil and vegetation are interdependent on each other. Soil influences vegetation and vegetation restricts soil (Sarah, Zhevelev, and Atar Citation2015; Zielke et al. Citation2015). The results not only showed that the soil factors played an important role in the vegetation community succession process, but also revealed that the vegetation community played an important role in soil restoration and reconstruction.
Besides the factors examined in this paper, there are many other factors with the potential to affect the plant communities in wetlands. For example, soil microbes are considered to be a key determinant of the aboveground plant community (Zuo et al. Citation2016). They do not distribute uniformly in the environment and their activity, abundance, and ecosystem functioning could vary across localities characterized by different pH, TP, Cond, SOM, and A-P. So, wetland management must work with vegetation communities by taking into account all of the interrelated biotic and abiotic influences. Understanding the relationships between such environmental variables and vegetation distribution can help improve the management, reclamation, and development of wetland ecosystems.
In the process of succession, the spatial distribution and aggregation of vegetation communities corresponded to the vegetation community dynamic state and spatial heterogeneity (Sui et al. Citation2010; Boy et al. Citation2016). So, understanding the current vegetation and the distribution patterns of plant communities can promote the succession of vegetation restoration. Vegetation acted as one of the most important factors in wetland ecosystems, and distribution patterns of plant communities strongly affected wetland ecosystem properties (Zelnik, Haler, and Gaberščik Citation2015; Hwang et al. Citation2016; Zuo et al. Citation2016). According to Zuo et al. (Citation2016), the recovery of vegetation succession can provide theoretical support for wetland restoration and health evaluation. Vegetation classification is the key step to choosing suitable plant species and formulating reasonable vegetation restoration measures. By understanding the differences between and the characteristics of different soil conditions in Lake Taihu, we can choose the most appropriate plant species for vegetation restoration and highlight the crucial role of local variation in soil properties for regulating plant trait selection and species composition.
The CCA model is nonlinear, which has several advantages that have been confirmed in several previous studies (Sui et al. Citation2010; Zhang, Yu, and Hu Citation2013; Sarah, Zhevelev, and Atar Citation2015). The limitation of CCA is that the direction of the second axis can vary from that of the first axis in many cases, known as the “arch effect” or “horse-shoe effect.” Arch effects will influence the accuracy of sorting, especially for the environmental variables in this study; this is one reason why CCA only explains 16.6% of variation with the first three axes in this paper. Future studies could use detrended canonical correspondence to overcome the “Arch effects” observed in this study. Although we used CCA to analyze the relationship between the vegetation distribution and soil environmental factors in this paper, the complexity of the natural environment and the long-term nature of vegetation restoration succession make wetland vegetation restoration research very difficult. In the future, we should base our studies on wetland soil properties in areas of restored wetland vegetation, consider using artificial methods to promote vegetation restoration, and combine artificial and natural vegetation recovery methods to facilitate wetland restoration.
In this paper, we mainly analyzed the interaction between the distribution pattern of plant communities and environmental soil factors; the results also presented some relatively remarkable effects. However, we did not analyze other environmental factors including atmosphere, water level, climate, rainfall, or others, which resulted in some uncertainty in this paper. To achieve better theoretical support, future studies should aim to include more environmental factors with multiple analyses.
Acknowledgments
The research in this article was funded by the Special Forestry Project of Public Interests (201404305 and 200904001). We thank Amjad Ali and Abel Ramoelo for valuable comments on the draft of the paper and John Wasige from the University of Twente, The Netherlands, for his linguistic help. We also thank Edanz Editing China for linguistic assistance.
Disclosure statement
No potential conflict of interest was reported by the authors.
Additional information
Funding
References
- Amorim, P. K., and M. A. Batalha. 2007. “Soil-Vegetation Relationships in Hyperseasonal Cerrado, Seasonal Cerrado, and Wet Grassland in Emas National Park (Central Brazil).” Acta Oecologica 32: 319–327. doi:10.1016/j.actao.2007.06.003.
- Benning, T. L., and T. R. Seastedt. 1995. “Landscape-Level Interactions between Topoedaphic Features and Nitrogen Limitation in Tallgrass Prairie.” Landscape Ecology 10 (6): 337–348. doi:10.1007/BF00130211.
- Bigelow, SW, and CD Canham. 2002. “Community Organization of Tree Species Along Soil Gradients in a North-eastern USA Forest.” Journal of Ecology 90: 188–200. doi:10.1046/j.0022-0477.2001.00655.x.
- Boy, J., R. Godoy, O. Shibistova, D. Boy, R. Mcculloch, and A. A. D. L. Fuente. 2016. “Successional Patterns along Soil Development Gradients Formed by Glacier Retreat in the Maritime Antarctic, King George Island.” Revista Chilena de Historia Natural 89 (1): 1–17. doi:10.1186/s40693-016-0056-8.
- Casanova, M. T., and M. A. Brock. 2000. “How Do Depth, Duration and Frequency of Flooding Influence the Establishment of Wetland Plant Communities?” Plant Ecology 147 (2): 237–250. doi:10.1023/A:1009875226637.
- Corriale, M. J., P. I. Picca, and D. D. Francescantonio. 2013. “Seasonal Variation of Plant Communities and Their Environments along a Topographic Gradient in the Iberá Wetland, Ancient Paraná Floodplain, Argentina.” Phytocoenologia 43 (1): 53–69. doi:10.1127/0340-269X/2013/0043-0539.
- Dekeyser, E. S., D. R. Kirby, and M. J. Ell. 2003. “An Index of Plant Community Integrity: Development of the Methodology for Assessing Prairie Wetland Plant Communities.” Ecological Indicators 3 (2): 119–133. doi:10.1016/S1470-160X(03)00015-3.
- Dong, L., L. G. Xu, J. X. Xu, J. Xu, X. L. Wang, and Q. Zhang. 2014. “Effects of Soil Environmental Factors on Vegetation Distribution in Shoaly Wetlands Typical to Poyang Lake.” Acta PedologicaSinica 51 (3): 618–626.
- Dwirek, A., J. B. Kauffman, and J. E. Baham. 2006. “Plant Species Distribution in Relation to Water-Table Depth and Soil Redox Potential in Montane Riparian Meadows.” Wetlands 26: 131–146. doi:10.1672/0277-5212(2006)26[131:PSDIRT]2.0.CO;2.
- Gao, J. H., G. S. Yang, and W. X. Ou. 2007. “The Influence after Introduction of Spartina Alterniflora on the Distribution of TOC, TN and TP in the National Yancheng Rare Birds Nature reserve, Jiangsu Province, China.” Geographical Research 26 (4): 799–808. [In Chinese.].
- Gilliam, F. S. 2006. “Response of the Herbaceous Layer of Forest Ecosystems to Excess Nitrogen Deposition.” Journal of Ecology 94: 1176–1191. doi:10.1111/jec.2006.94.issue-6.
- Hammersmark, C. T., M. C. Rains, A. C. Wickland, and J. F. Mount. 2009. “Vegetation and Water-Table Relationships in a Hydrologically Restored Riparian Meadow.” Wetlands 29: 785–797. doi:10.1672/08-15.1.
- Hebb, A. J., L. D. Mortsch, P. J. Deadman, and A. R. Cabrera. 2013. “Modeling Wetland Vegetation Community Response to Water-Level Change at Long Point, Ontario.” Journal of Great Lakes Research 39 (2): 191–200. doi:10.1016/j.jglr.2013.02.001.
- Hu, W. P., E. J. Sven, F. B. Zhang, Y. Chen, Z. Hu, and L. Yang. 2011. “A Model on the Carbon Cycling in Lake Taihu, China.” Ecological Modelling 222: 2973–2991. doi:10.1016/j.ecolmodel.2011.04.018.
- Hwang, J.-S., D.-G. Choi, S.-C. Choi, H.-S. Park, Y.-M. Park, and -J.-J. Bae. 2016. “Relationship between the Spatial Distribution of Coastal Sand Dune Plants and Edaphic Factors in a Coastal Sand Dune System in Korea.” Journal of Ecology & Environment 39: 17–29. doi:10.5141/ecoenv.2016.003.
- Jager, N. R. D., J. J. Rohweder, Y. Yao, and E. Hoy. 2015. “The Upper Mississippi River Floodscape: Spatial Patterns of Flood Inundation and Associated Plant Community Distributions.” Applied Vegetation Science 19: 164–172. doi:10.1111/avsc.12189.
- Juan, J. G., R. L. Carlos, and E. B. Donaldo. 2011. “Vegetation Composition and Its Relationship with the Environment in Mallines of North Patagonia, Argentina.” Wetlands Ecology and Management 19: 121–130. doi:10.1007/s11273-010-9205-z.
- Kadowaki, K., H. Sato, S. Yamamoto, A. S. Tanabe, A. Hidaka, and H. Toju. 2014. “Detection of the Horizontal Spatial Structure of Soil Fungal Communities in a Natural Forest.” Population Ecology 56: 301–310. doi:10.1007/s10144-013-0424-z.
- Kajsa, A., and M. Johanna. 2005. “Variation in Vegetation Communities in Shallow Bays of the Northern Baltic Sea.” Aquatic Botany 83 (1): 1–13.
- Kamrani, A., A. Jalili, A. Naqinezhad, F. Attar, A. A. Maassoumi, and S. C. Shaw. 2011. “Relationships between Environmental Variables and Vegetation across Mountain Wetland Sites, N. Iran.” Biologia 66: 76–87. doi:10.2478/s11756-010-0127-2.
- Kang, S., H. Kang, and D. Ko. 2002. “Nitrogen Removal from A Riverine Wetland: A Field Survey and Simulation Study of Phragmites japonica.” Ecological Engineering 18: 467–475. doi:10.1016/S0925-8574(01)00107-0.
- Kashian, D. M., B. V. Barnes, and W. S. Walker. 2003. “Ecological Species Groups of Landform-Level Ecosystems Dominated by Jack Pine in Northern Lower Michigan, USA.” Plant Ecology 166: 75–91. doi:10.1023/A:1023265012964.
- Ke, Z. X., P. Xie, L. G. Guo, Y. Liu, and H. Yang. 2007. “In Situ Study on the Control of Toxic Microcystis Blooms Using Phytoplanktivorous Fish in the Subtropical Lake Taihu of China: A Large Fish Pen Experiment.” Aquaculture 265: 127–138. doi:10.1016/j.aquaculture.2007.01.049.
- Ladányi, Z., V. Blanka, J. D. Áron, J. Rakonczai, and G. Mezősi. 2016. “Assessment of Soil and Vegetation Changes Due to Hydrologically Driven Desalinization Process in an Alkaline Wetland, Hungary.” Ecological Complexity 25: 1–10. doi:10.1016/j.ecocom.2015.11.002.
- Li, C. H., C. Ye, X. F. Zhao, Q. Wang, X. Chen, and X. Kong. 2012. “The Ecosystem Health Assessment of the Littoral Zone of Lake Taihu.” Acta EcologicaSinica 32: 3806–3815. [In Chinese.].
- Li, W., L. J. Cui, X. S. Zhao, M. Y. Zhang, C. J. Gao, Y. Zhang, and Y. F. Wang. 2015. “Community Structure and Diversity of Soil Animals in the Lake Taihu Lakeshore Wetland.” Acta EcologicaSinica 35 (4): 944–955. [In Chinese.].
- Li, W., L. J. Cui, X. S. Zhao, M. Y. Zhang, and Y. F. Wang. 2010. “Spatial Distribution of Vegetation and Soil Interpretation in the Process of Wetland Restoration with the Type of Sand-Mining Land.” Ecology and Environmental Sciences 19: 2325–2331. [In Chinese.].
- Liu, Q. S., G. H. Liu, C. Huang, Z. J. Yao, and H. Q. Huang. 2016. “Spatial Distribution of Vegetation and Soil Properties on the Ulan Bator-Fengzhen Transect on the Mongolian Plateau.” Resources Science 38 (5): 982–993. [In Chinese.].
- Lucie, H., K. Jana, and M. Zuzana. 2016. “Assessment of Habitat Suitability Is Affected by Plant-Soil Feedback: Comparison of Field and Garden Experiment.” PLOS One 11: 1–26.
- Luo, Y., D. Su, S. H. Lu, H. Bu, J. He, and J. J. Xie. 2016. Relationship Between Plant Species Diversity of Riparian Zone in Hui River Wetlands and Soil Factors. Wetland Science 14(3): 396–402. doi:10.13248/j.cnki.wetlandsci.2016.03.014
- Mellado, A., and R. Zamora. 2015. “Spatial Heterogeneity of a Parasitic Plant Drives the Seed-Dispersal Pattern of a Zoochorous Plant Community in a Generalist Dispersal System.” Functional Ecology 30: 459–467. doi:10.1111/1365-2435.12524.
- Niall, G. B., B. J. Chris, P. Elle, and D. M. Scott. 2007. “Use of Vegetation Classification and Plant Indicators to Assess Grazing Abandonment in Estonian Coastal Wetlands.” Journal of Vegetation Science 18: 645–654. doi:10.1111/j.1654-1103.2007.tb02578.x.
- Nkosi, S. E., A. S. Barrett, and L. R. Brown. 2016. “Vegetation Ecology of the Nooitgedacht Section of Loskop Dam Nature Reserve, Mpumalanga.” South African Journal of Botany 105: 79–88. doi:10.1016/j.sajb.2016.02.199.
- O’Connell, J. L., L. A. Johnson, L. M. Smith, S. T. Mcmurry, and D. A. Haukos. 2012. “Influence of Land-Use and Conservation Programs on Wetland Plant Communities of the Semiarid United States Great Plains.” Biological Conservation 146 (1): 108–115. doi:10.1016/j.biocon.2011.11.030.
- Oliveira, P. C. D., J. M. D. Torezan, and C. N. D. Cunha. 2015. “Effects of Flooding on the Spatial Distribution of Soil Seed and Spore Banks of Native Grasslands of the Pantanal Wetland.” Acta Botanica Brasilica 29 (3): 400–407. doi:10.1590/0102-33062015abb0027.
- Onur, S., and B. Suha. 2016. “Crop Yield Prediction under Soil Salinity Using Satellite Derived Vegetation Indices.” Field Crops Research 192: 134–143. doi:10.1016/j.fcr.2016.04.028.
- Pansu, M, and J. Gautheyrou. 2006. “Handbook of Soil Analysis.” Mineralogical, Organic and Inorganic Methods. U.S. Government Printing Office 603–624.
- Peres-Neto, P. R., P. Legendre, S. Dray, and D. Borcard. 2006. “Variation Partitioning of Species Data Matrices: Estimation and Comparison of Fractions.” Ecology 87: 2614–2625. doi:10.1890/0012-9658(2006)87[2614:VPOSDM]2.0.CO;2.
- Picard, C. R., L. H. Fraser, and D. Steer. 2005. “The Interacting Effects of Temperature and Plant Community Type on Nutrient Removal in Wetland Microcosms.” Bioresource Technology 96: 1039–1047. doi:10.1016/j.biortech.2004.09.007.
- Qiu, Y., and J. T. Zhang. 2000. “The Ordination Axes Clustering Based on Detrended Canonical Correspondence Analysis Ordination and Its Application to the Analysis of Ecological Gradients of Plant Communities.” Acta Ecologica Sinica 20: 199–206.
- Reid, M. A., M. C. Reid, and M. C. Thoms. 2016. “Ecological Significance of Hydrological Connectivity for Wetland Plant Communities on a Dryland Floodplain River, MacIntyre River, Australia.” Aquatic Sciences 78 (1): 139–158. doi:10.1007/s00027-015-0414-7.
- Rola, K., P. Osyczka, and M. Nobis. 2015. “How Do Soil Factors Determine Vegetation Structure and Species Richness in Post-Smelting Dumps?” Ecological Engineering 75: 332–342. doi:10.1016/j.ecoleng.2014.11.026.
- Sarah, P., H. M. Zhevelev, and O. Z. Atar. 2015. “Urban Park Soil and Vegetation: Effects of Natural and Anthropogenic Factors.” Pedosphere 25: 392–404. doi:10.1016/S1002-0160(15)30007-2.
- Skeffington, M. S., J. Moran, Á. O. Connor, E. Regan, C. E. Coxon, and N. E. Scott. 2006. “Turloughs – Ireland’s Unique Wetland Habitat.” Biological Conservation 133 (3): 265–290. doi:10.1016/j.biocon.2006.06.019.
- Sui, Z., Y. Chang, Y. H. Li, H. Y. Man, L. Miao, and C. H. Wei. 2010. “Relationships of Arctiumlappa Community Distribution and Species Composition With Eco-environmental Factors.” Chinese Journal of Ecology 29 (2): 215–220.
- Wang, X. H., Y. Z. Li, H. Meng, H. Dong, Y. Guo, and S. Tong. 2015. “Distribution Pattern of Plant Community in New-born Coastal Wetland in the Yellow River Delta.” Scientia Geographica Sinica 35 (8): 1021–1026.
- Wang, X. L., L. F. Chang, H. P. Li, and Q. Zhang. 2011. “Study on Community Characteristics and Soil Properties of Typicavegetations in Chaohu Hill Region.” Soils 43 (6): 981–986. [In Chinese.].
- Wang, Y., J. C. Huang, R. H. Yan, and J. Gao. 2016. “Nutrient Removal Efficiency of Lake Wetlands: A Case Study of Sanshan Wetland in Lake Taihu, Eastern China.” Journal of Lake Sciences 28: 124–131. doi:10.18307/2016.0114.
- Wassen, M. J., W. H. M. Peeters, and H. O. Venterink. 2002. “Patterns in Vegetation, Hydrology, and Nutrient Availability in an Undisturbed River Floodplain in Poland.” Plant Ecology 165: 27–43. doi:10.1023/A:1021493327180.
- Watt, A. S. 1947. “Pattern and Process in the Plant Community.” Nature 314 (6009): 324.
- Wetser, K., J. Liu, C. Buisman, and D. Strik. 2015. “Plant Microbial Fuel Cell Applied in Wetlands: Spatial, Temporal and Potential Electricity Generation of Spartina Anglica, Salt Marshes and Phragmites Australis, Peat Soils.” Biomass & Bioenergy 83: 543–550. doi:10.1016/j.biombioe.2015.11.006.
- Whitworth, A., J. Villacampa, A. Brown, R. P. Huarcaya, R. Downie, and R. Macleod. 2016. “Past Human Disturbance Effects upon Biodiversity are Greatest in the Canopy; a Case Study on Rainforest Butterflies.” PLOS One 11 (3): 1–20. doi:10.1371/journal.pone.0150520.
- Williams, L. D., and C. Ahn. 2015. “Plant Community Development as Affected by Initial Planting Richness in Created Mesocosm Wetlands.” Ecological Engineering 75: 33–40. doi:10.1016/j.ecoleng.2014.11.030.
- Yamaji, Y., H. Honda, R. Hanai, and J. Inoue. 2016. “Soil and Environmental Factors Affecting the Efficacy of Pyroxasulfone for Weed Control.” Journal of Pesticide Science 41 (1): 1–5. doi:10.1584/jpestics.D15-047.
- Yang, J., H. Harino, H. B. Liu, and N. Miyazaki. 2008. “Monitoring the Organotin Contamination in the Taihu Lake of China by Bivalve Mussel Anodonta Woodiana.” Bulletin of Environmental Contamination and Toxicology 81: 164–168. doi:10.1007/s00128-008-9464-z.
- Zdravko, B. 2005. “Vegetation-environment Relationships and Classification of the Seasonal Savannas in Venezuela.” Ecology of Plants 200 (1): 49–64.
- Zellweger, F., V. Braunisch, F. Morsdorf, A. Baltensweiler, M. Abegg, and T. Roth. 2015. “Disentangling the Effects of Climate, Topography, Soil and Vegetation on Stand-Scale Species Richness in Temperate Forests.” Forest Ecology & Management 349: 36–44. doi:10.1016/j.foreco.2015.04.008.
- Zelnik, I., M. Haler, and A. Gaberščik. 2015. “Vulnerability of a Riparian Zone Towards Invasion by Alien Plants Depends on Its Structure.” Biologia 70 (7): 869–878. doi:10.1515/biolog-2015-0110.
- Zhang, Q. J., X. B. Yu, and B. H. Hu. 2013. “Research on the Characteristics of Plant Communities in the Poyang Nanji Wetlands, China.” Resources Science 35: 42–49.
- Zheng, J.-G., Y.-W. Chen, and G.-X. Wu. 2013. “Association of Vegetation Patterns and Environmental Factors on the Arid Western Slopes of the Helan Mountains, China.” Mountain Research and Development 33: 323–331. doi:10.1659/MRD-JOURNAL-D-12-00088.1.
- Zielke, M., B. Solheim, S. Spjelkavik, and R. A. Olsen. 2015. “Nitrogen Fixation in the High Arctic: Role of Vegetation and Environmental Conditions.” Arctic Antarctic & Alpine Research 37 (3): 372–378. doi:10.1657/1523-0430(2005)037[0372:NFITHA]2.0.CO;2.
- Zuo, X., S. Wang, P. Lv, X. Zhou, X. Zhao, and T. Zhang. 2016. “Plant Functional Diversity Enhances Associations of Soil Fungal Diversity with Vegetation and Soil in the Restoration of Semiarid Sandy Grassland.” Ecology & Evolution 6: 318–328. doi:10.1002/ece3.1875.