
ABSTRACT
Introduction: Mountains occupy 24% of the global land surface and are home to 12% of the world’s population; they host the world’s principal biomes and supply a diverse array of ecosystem services. But they are also highly sensitive to both natural and human induced changes, which can affect service provision meant for one third of humanity. Systematic research on impacts of land cover change from mountains at the local scale are limited, especially in developing countries, which poses a barrier to informed planning for sustainable management. Bhutan being in the forefront as contributor towards global conservation goals, a case study following a systematic research framework considering quantitative, qualitative and geospatial tools was experimented.
Outcome: Respondents identified and ranked 24 ecosystem services, among which the provisioning services were the most important, followed by cultural, regulating, and supporting services. Forest was the most important land cover type for services, followed by marsh, scrub, water bodies, and agriculture. The area of forest declined by 2% and marsh by 7% over the 32-year period, suggesting a potential decrease in ecosystem services, which was also observed by the local community.
Discussion: It was observed that 80% of the local people are still directly dependent on the diverse ecosystems for services. Though subtle, the decrease in land cover has implications for livelihoods of the people and the rich biodiversity of the area. Aspiring communities for local development needs guidance for identifying trade-offs in land cover types in sustainable management. An integrated and holistic approach focusing on both conservation and community development should be used to manage and develop the valley and the region sustainably.
Conclusion: We recommend diversifying the limited livelihood strategies (potato farming and livestock grazing) to reduce the potential vulnerability of the local community and reduce the pressure on forest and marsh. Proper land use planning in the valley would be beneficial to maintain and regulate land uses in an effective way and avoid possible conflicts between settlement, agriculture, forest, and marsh.
Introduction
Mountains occupy 24% of the global land surface and are home to 12% of the world’s population (Schild Citation2008). They are also home to a great diversity of species, are rich in endemics, and support the world’s principal biomes from hyperarid hot desert and tropical forest to arid polar ice caps (CBD Citation2010). They are hotspots of biodiversity (Schroter et al. Citation2005), and the diverse ecosystems found in mountain areas help to stabilize headwaters, prevent flooding, and maintain steady year-round flows of water resources (Hamilton Citation2015). Mountain areas provide a myriad of goods and services for the people living in and beyond the mountain regions (MEA Citation2005, TEEB Citation2010) and are vital for maintaining human life in the densely populated areas downstream (Hamilton Citation2015). About 12% of the world’s population depend directly on mountain ecosystem services for their livelihoods and well-being, and an estimated 40% indirectly (Korner and Ohsawa Citation2005; Schild Citation2008).
However, mountain regions are also highly sensitive to both climatic and non-climatic change (Bugmann et al. Citation2007; Huber et al. Citation2013), with the impact often more rapid and recovery either slow or impossible (Halada Citation2010). The change in weather patterns together with anthropogenic pressure is affecting mountain landscape dynamics and the ecosystem services that mountains provide (Pedrono et al. Citation2016). Unplanned land use practices, infrastructure development, unsustainable tourism, and climate change are all leading to rapid change (EEA Citation2006), with land cover change, in particular, one of the most important drivers (Furst, Lorz, and Makeschin Citation2011; Maxwell et al. Citation2016). The transformation of traditional land use practices by modern agriculture and habitat fragmentation are threatening the fragile mountain ecosystems (Spehn et al. Citation2010).
Information on change and impacts is very limited, however, especially at the local scale (Reyers et al. Citation2009). The lack of information on past and present land transformations in fragile mountain landscapes is a challenge for land managers and policy makers (Balsiger and Debarbieux Citation2015) and poses a significant barrier to understanding and managing ecosystems sustainably and making effective decisions for conservation and sustainable development in remote mountain regions (Reyers et al. Citation2009). Regular assessment is recommended to understand and monitor change (Nelson et al. Citation2010), help maintain ecosystem integrity, and guide management strategies for conservation and sustainable development that will benefit mountain ecosystems and the people they serve (Tovar et al. Citation2013). A detailed understanding of ecosystem services and changing land cover and its implications are increasingly seen as important steps at the local and regional scales (Martin-Lopez et al. Citation2012; Mendez-Lopez et al. Citation2014).
The present study aimed to analyze the impacts of land cover change on the ecosystems and (local) ecosystem services of a mountain landscape, using the Phobjikha valley in Bhutan in the Eastern Himalayas as an example. The Phobjikha valley is one of the most important wetland ecosystems in Bhutan and has a high conservation value (ICIMOD and RSPN Citation2014). Reports indicate that the wetland has been subjected to a range of unplanned development activities such as building roads and hotels, change to intensive farming practices, land fragmentation, and building of unsustainable tourism infrastructure, at the expense of forest and wetlands (RSPN Citation2007). These are gradually influencing the landscape dynamics of the valley and affecting its fragile ecosystems and the people dependent on them (RSPN Citation2007). To validate this, we seek to understand people’s dependency on ecosystems for ecosystem services; land cover change, and its implications on ecosystem services and people’s dependency identified as important by the local community. Ecosystem services in the local context were taken to be the “actual production of services used or experienced by local people” following Villamagna, Angermeier, and Bennett (Citation2013) and explicitly articulated based on people’s perception on the ecosystem in general as sources of ecosystem services without any spatial consideration on its use pattern due to time and resources limitations.
Methods
Study area
The Phobjikha valley is a glaciated valley in Bhutan located between 89°57ʹ54” and 90°17ʹ30” N and 27°13ʹ50” and 27°31ʹ27 E at a mean elevation of 3500 m above sea level. The valley forms a small watershed with an area of 161.9 km2. Annual rainfall recorded for the 11 years 1992–2003 ranged from 1472 to 2189 mm. The annual mean minimum temperature in the period 2001–2011 was −4.8°C, and the annual mean maximum temperature 19.9°C. The land cover comprises agriculture, forest, marsh, scrub, settlements, water bodies, and other (grassland, sand/gravel); close to two-thirds is forest (ICIMOD and RSPN Citation2014).
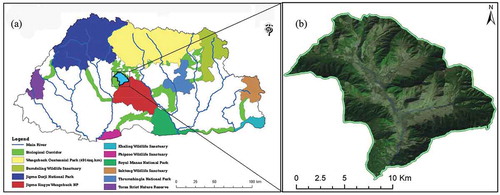
The Phobjikha valley contains one of the largest high-altitude wetlands in Bhutan and has high biodiversity with 254 species of flora from 43 families; 90 species of birds including the endangered black-necked crane (Grus nigricollis), which migrates from the Tibetan Plateau, and threatened white-bellied heron (Ardea insignis); and 20 mammalian species, including the globally threatened red panda (Ailurus fulgens) (Pradhan Citation2010; RSPN Citation2007). The wetland is conserved as the Phobjikha Conservation Area (PCA) (), and its wider stretches include part of the biological corridor between Jigme Dorji National Park and Jigme Singye Wangchuck National Park (ICIMOD and RSPN Citation2014). The valley is further surrounded by an important watershed which has been proposed as the Phobjikha Landscape Conservation Area (Pradhan Citation2010). The landscape’s scenic beauty is enhanced by the revered 16th century Gangtey Monastery, which makes Phobjikha valley a popular destination for both domestic and international tourists (RSPN Citation2007). The provision of habitat in winter for the black-necked crane (Grus nigricollis), which migrates from the Tibetan-Qinghai Plateau, is of special importance (ICIMOD Citation2014). Black-necked cranes have a recognized place in the local community and play an integral part in the local culture (Dorji and Jigme Citation2003). They are mentioned in local folklore, dances, and stories and are closely linked with everyday life, for example, farmers finish harvesting their crops when the birds arrive leaving the land open for cranes to feed and roost (RSPN Citation2007).
Figure 1. Location of the Phobjikha Conservation Area: (a) protected areas map of Bhutan; (b) the PCA (Source: RSPN Citation2007).
The valley has two gewogs (the smallest geographic administrative unit), Gangtey and Phobji, with a population of 3600 in 701 households, and average family size of 5.5 (ICIMOD and RSPN Citation2014). The majority of household heads are male (57.6%); the literacy rate is 39.1% for women and 34.8% for men (ICIMOD and RSPN Citation2014). Agriculture and livestock are the main sources of livelihood; 97% of households are engaged in agriculture, especially potato farming and livestock grazing (RSPN Citation2007); the average per capita holdings of agricultural land is 0.1 ha (ICIMOD and RSPN Citation2014). The most common livestock are cows, pigs, poultry, horses, and yaks, with farming households owning 2.6 livestock on average. The valley is ethnically homogenous with more than 90% of residents belonging to the Ngalop ethnic community, a matrilineal society in which property is inherited by daughters and men and women have equal access to decision-making and resources. Historically, the Phobjikha valley was summer pastureland used by the Ngalop community for their livestock (RSPN Citation2007). Before they settled permanently, the community practiced transhumance, migrating to the lower parts of the valley in winter to grow paddy. In addition, the majority also practiced “jow pang” (burning off and ploughing fallow open grasslands each year to cultivate buckwheat) (Phuntsho Citation2010). The transhumance system was transformed into permanent settlement after the introduction of potatoes around the 1980s. The potato cultivation also attracted residents from nearby areas (Pradhan Citation2010). There are also older settlements in the valley dating from the construction of the Gangtey gompa (monastery) in the 16th century when new residents came to the valley from nearby. The recent settlements and changes in the farming system have considerably changed the land cover of the wetlands (Phuntsho Citation2010).
Data collection and analysis
We used both qualitative and quantitative methods to collect data. Key informant interviews, household survey, and a focus group discussion were conducted from February to July 2011 to collect primary data; secondary data were obtained from reports by the government, donors, and not-for-profit organizations. We used remote sensing, geographic information system (GIS) tools, and the Statistical Package for Social Science 19 (SPSS 19) to analyze the primary data and land cover change following the methodological framework shown in .
Figure 2. Methodological framework.
Key informant interviews
We interviewed 20 key informants to explore the history, community lifestyle, interaction with nature, and recent developments and their impact in the valley. Both open- and closed-ended questions were asked such as “what are the recent development trends and conservation strategies” and “what benefits do local people get from their nearby ecosystems.” The interviews were conducted by the Royal Society for Protection of Nature (RSPN)—a local nongovernmental organization mandated by the Royal Government of Bhutan to conserve and manage the Phobjikha valley since 1987. The informants were local leaders, business representatives (shopkeepers), forest officials, spiritual leaders, and representatives of nongovernmental organizations working in the valley. The interviews were transcribed and the contents analyzed by coding with themes shaped by the research questions (ecosystem services, land cover change, implications).
Household survey
Following the interviews, a household survey was conducted. A questionnaire was designed in collaboration with RSPN and tested with 10 households; the feedback was used to adjust the questionnaire. The four data collectors were briefed about the research objectives, ecosystem services, sampling methods, and the questionnaire. A total of 218 households (31% of the total) were randomly chosen for the survey; of these, six households did not participate for various reasons including health issues leaving a total of 212. The surveys were conducted during morning and evening at home in the local language. The head of the household was interviewed irrespective of gender (above 18 years); 60% were women and 40% men with an average age of 42 years. Most of the respondents were born in the area or had lived there for at least 11 years. The survey focused on the perceptions on importance of ecosystems, supply of ecosystem services, and the impact of changes on the supply of ecosystem services. The average time per interview was 45 minutes. The completed questionnaires were collected and checks carried out in close consultation with the data collectors. The questionnaire information was then entered into SPSS 19 for analysis.
Focused group discussion
An assessment matrix was prepared following completion of the household questionnaire to assess the capacity of particular types of land cover to supply the ecosystem services identified by questionnaire respondents. Land cover types (agriculture, forest, marsh, scrub, settlements, water bodies, and other [mix of grassland, sand/gravel]) were listed on the y-axis and ecosystem services (provisioning, regulating, supporting, and cultural services, as obtained from key informant interviews) on the x-axis (). Classification of types of ecosystem service was based on MEA (Citation2005). The assessment matrix was filled out by local experts—members of the local community who had lived in the area for at least 15 years and had knowledge about their local environment (Burkhard, Kroll, and Müller Citation2010; Chaudhary et al. Citation2016; Sohel, Ahmed Mukul, and Burkhard Citation2015). A total of 25 local people agreed to be involved in the assessment. They ranked each land cover type based on their degree of access and use of each type of service on a scale of 0–3, where 3 = very important, 2 = moderately important, 1 = least important, and 0 = not important. For example, for fuelwood, forest was assigned 3 (very important) by those who used fuelwood from the forest, and 0 by those who did not, while water bodies were always assigned 0 for fuelwood and 3, 2, 1, or 0 for water services (). The values assigned to each land cover class for all services within each type (provisioning, regulating, supporting, and cultural) were summed; the total was taken as an indicator of the capacity of the land cover type to supply this type of ecosystem service to the local community (the total ecosystem services value with higher values equal to greater importance).
Table 1. The calculation of error matrix used in mapping process.
Land cover change analysis
Land cover in the Phobjikha valley was analyzed through image analysis of medium spatial resolution Landsat satellite images from 1978 and 2010 using a classification scheme from RSPN (Citation2007) with seven land cover classes (agriculture, forest, marshes, scrub, settlements, water bodies, other [mix of grassland, sand/gravel]). The Landsat Multispectral Scanner, Thematic Mapper, and Enhanced Thematic Mapper Plus images were rectified into Universal Transverse Mercator Zone 46. The images were of different resolution; thus, all images were first resampled into 15-m resolution using resolution merge method. After rectifying, eCognition developer software was used for object-based image analysis (a methodological framework for machine-based interpretation of complex classes using both spectral and spatial information (Lang et al. Citation2011). The seven land cover types were classified using a multiresolution segmentation algorithm which consecutively merged pixels by identifying image objects of one pixel and merging them with neighbors using relative homogeneity criteria (Blaschke and Hay Citation2001). A land water mask was created during class modeling using band ratio and texture information based on spectral values and vegetation indices like the Normalized Difference Vegetation Index (NDVI). An NDVI image was created in a preprocessing stage using customized features: NDVI = (RED – IR)/(RED + IR). The land and water mask was created using the formula IR/Green*100. The image objects were labeled according to attributes such as NDVI, land water mask, layer value, and color, and relative position to other objects, using user-defined rules. Objects with an area smaller than the defined minimum mapping unit were merged with other objects. The classified land cover map was then exported to a raster file format for further analysis. To validate the accuracy of the maps, both field sampling and references through high resolution map were used. About 60% of the reference points were collected from the field and 40% from high resolution map due to inaccessibility of some parts of the study area. The sampling points were randomly selected representing each of the land use types. The overall accuracy of the land cover map was 90.71%, assessed using 140 reference points (see error matrix in ).
Implications of land cover change on ecosystem services: Land cover area was used as a proxy to analyze the change in ecosystem services based on the reported levels in 2010. The changes in ecosystem service values resulting from the land cover change between 1978 and 2010 were analyzed as described in Chaudhary et al. (Citation2016). Briefly, the total ecosystem services (ES) value for each category (provisioning, regulating, supporting, and cultural) obtained from the assessment matrix () was divided by the total land cover area in the valley to give the ES value per hectare (Equation 1). This value was then multiplied by the land cover area (ha) for each land cover type (agriculture, forest, marsh, scrub, settlement, water bodies, and others) to give the value of provisioning, regulating, supporting, and cultural services for each land cover type in 1978 and 2010. The calculated values for 1978 and 2010 were then compared; the observed change was taken to be an indicator of the impact of land cover change on ecosystem services over the 32-year period.
Table 2. Assessment matrix for provisioning, regulating, supporting, and cultural ecosystem services with land cover.
ArcGIS spatial analyst was then used to relate and merge the values obtained for provisioning, regulating, supporting, and cultural services with the land cover maps for 1978 and 2010. The analysis and mapping process showed visual changes in each category of ecosystem service from each land cover type over the 32 years. It is to be noted here that the mapping was done on the basis of broad understanding of ecosystems as sources of varied ecosystem services and not with actual access of biophysical characteristic considering the overall objectives and limitations mentioned above.
Results
Ecosystem services and their ranking
A total of 24 key ecosystem services were identified through the key informant interviews and household survey: 14 provisioning, 4 regulating, 2 supporting, and 4 cultural (). Provisioning services were ranked as most important (53%), followed by cultural (44%), regulating (37%), and supporting (28%). shows the overall ranking of importance of all services. Among the provisioning services, grazing (for livestock) was ranked as most important, followed by fuelwood (cooking and heating), timber (house construction), and leaflitter (livestock bedding and fertilizer). The most important cultural service was provision of historical and cultural importance, which linked to festivals and ancestral history. The regulating services of water regulation and erosion control were also highly valued, as was provision of water, while the most valued supporting service was the conservation of endangered flora and fauna, especially the black-necked crane.
Table 3. Key ecosystem services, use, and ranking.
Capacity of land cover types to provide ecosystem services
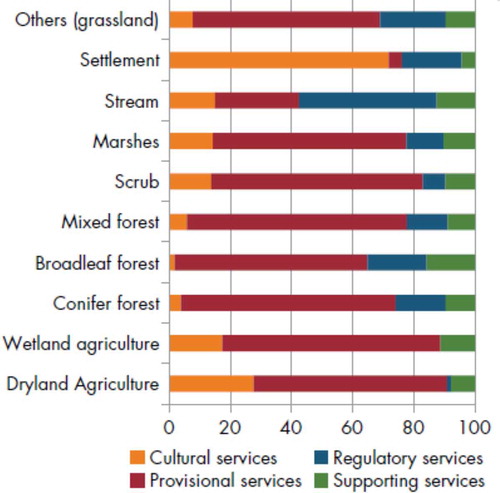
Each of the land cover types provided a range of provisioning, regulating, supporting, and cultural services (). Forest was considered to have the highest capacity to provide services, especially provisioning services of fuelwood, leaflitter, timber, and grazing, and regulating services of water regulation, erosion control, fresh air, and pest/disease control (). Marshes were considered important for drinking water (provisioning) and water regulation (regulating); scrub for grazing, leaflitter, and medicinal plants (provisioning), and erosion control, air regulation, and water recharge (regulating); water bodies were mainly considered important as providers of drinking water and irrigation; grassland and stone/gravel for erosion control and water recharge; agriculture for potatoes and cash crops; and settlements for historical importance and tourism ().
Figure 3. People’s perceptions in terms of their dependency on ecosystems for ecosystem services.
Land cover change
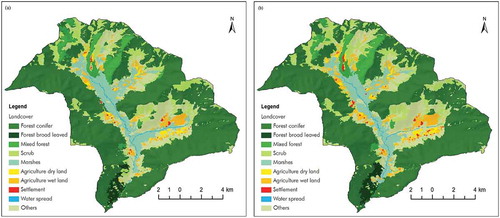
shows the distribution of land cover classes in 1978 and 2010 and the area and change as a proportion of land cover class and total land cover. In 1978, the valley had 4% agriculture, 63% forest, 8% marsh, 12% scrub, 0.2% settlement, 0.3% water bodies, and 12% other (grassland, sand/gravel). Over the 32 years, the agricultural area increased by 30%, water bodies by 12%, and settlements by 100%, while the area of forest decreased by 2% and marshes by 7%. As a proportion of the total land cover, changes were less marked with forest and marsh decreasing by 1.1% and 0.6%, and agriculture increasing by 1.3% ().
Table 4. Land cover change between 1978 and 2010.
Figure 4. Land cover map of the study area: (a) 1978 and (b) 2010.
Impacts of land cover change on ecosystem services
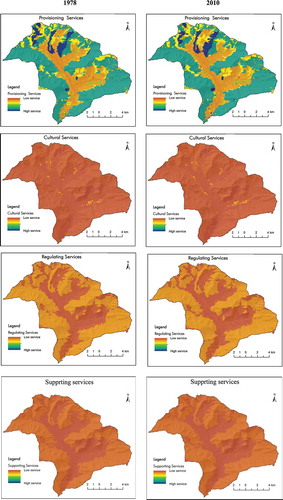
shows the spatial distribution of the four types of ecosystem service from the different classes of land cover in 1978 and 2010, and the values for the two years calculated over the whole area. The ecosystem services from forest and marsh declined (by 2% and 7%), while ecosystem services from other land cover classes increased, in line with the change in area of the different land cover classes.
Table 5. Ecosystem service values in 1978 and 2010.
Figure 5. State of four major ecosystem services in 1978 and 2010.
Perceived impacts of land cover changes on provisioning services
The decline in ecosystem services from forest suggests a decline in provisioning services (such as fuelwood, fodder, timber, and forest grazing), and regulating services (such as flood control and pest control). Many in the local community had perceived changes in the availability of provisioning services, especially fuelwood, fodder, leaflitter, wildfood, drinking water, and irrigation, with 39% reporting a decrease, 17% an increase, and 27% no change, while 17% were uncertain. In particular, people felt there had been a significant decrease in the quantity of fuelwood, fodder, and wild food available and area for grazing. Availability of water for drinking was not much changed, but some reported a decrease in the quantity of water available for irrigation. The local community had observed a considerable increase in tourism, which was supported by other reports; close to 9000 international tourists were reported to visit the valley in 2011 up from 7000 in 2009 (ICIMOD and RSPN Citation2014).
Discussion
The analysis of the effect of land cover change from 1978 to 2010 on the ecosystem services provided in the Phobjikha valley of Bhutan showed a subtle reduction in services mainly related to the reduction in area of forest (2%) and marsh (7%). This has implications for both people and biodiversity.
Close to 80% of the local community depend on the valley forests for their needs (ICIMOD and RSPN Citation2014). A decline in services such as timber, fuelwood, litter, and fodder, which contribute to subsistence livelihoods, could increase people’s vulnerability (Sandhu and Sandhu Citation2014; Wangchuk, Siebert, and Belsky Citation2014). It could also force the community to overexploit the remaining resources, further reducing availability and resulting in a poverty trap, as reported for mountain communities elsewhere in the region (Gerlitz et al. Citation2014). Vulnerability is a serious concern in remote mountain areas like the Phobjikha valley, where the livelihood options are mainly limited to agriculture and livestock, bolstered by emerging tourism.
The Phobjikha valley, positioned between the Jigme Dorji National Park and Jigme Singye Wangchuck National Park, is an important corridor for globally threatened species like red panda (A. fulgens), which could also be affected by loss of forest cover. Endangered species with specific habitat requirements, like red panda and white-bellied heron, are vulnerable to land cover change, as shown elsewhere for other species like the Bengal florican (Houbaropsis bengalensis) in the Koshi Tappu Wildlife Reserve in Nepal (Chettri et al. Citation2013). The endangered black-necked crane, in particular, could be at risk from an increasing decline in regulating and supporting services from marsh and forest. The increase in sedimentation from intensive potato farming and contamination of water bodies from increased pesticide use (ICIMOD and RSPN Citation2014) could pose further challenges to the survival of the species in the valley. Thousands of domestic and international tourists visit the valley to see the crane, and a reduction in numbers could also impact the cultural services in the valley (RSPN Citation2007).
The observed changes in the valley are in line with changes in ecosystem services resulting from land cover change observed across the Eastern Himalayas between 1970 and 2000 (Chettri et al. Citation2007; Chettri et al. Citation2010), which in turn mirror an observed decline in wetland ecosystems around the world (MEA Citation2005). The contribution to the overall picture is an important aspect to be considered; even a small change in ecosystems can have a large impact at the landscape level (Belisle Citation2005). Recovery can be slow or impossible in mountain landscapes (Halada Citation2010); thus, mountain areas are prioritized for conservation (UNEP Citation2002). The Convention on Biological Diversity (CBD) recognizes the mountain ecosystem in its special Programme of Work on Mountain Biodiversity and strongly advocates the conservation of mountain ecosystems and their biodiversity for sustainable mountain development (CBD Citation2010).
Our study incorporated local knowledge to provide information about the interaction between people and ecosystem services, which is important for planning and sustainable management of mountain ecosystems. The study has some limitations, however. A household survey and land cover assessment matrix were used to gather local people’s knowledge and provide implications of land use change to different ecosystems and the importance of these services for the community, but the analysis did not take the biophysical characteristics of the landscape into account to assess the capacity to supply services. The reasons being it was beyond the scope of this study and evaluating biophysical characteristics is time-consuming, expensive, and difficult (Zhang, Shidong, and Rongchao Citation2014). The main objective of the study was to rationalize implications of land use change to ecosystems and ecosystem services in the simplest way possible and not on the capacity of ecosystems based on structure, diversity, processes, and functions. However, the engagement of local people is important for environmental decision-making (Corburn Citation2003), and local people’s knowledge has been recognized as a useful source of information for understanding the complex interactions between humans and ecosystems (Pereira et al. Citation2005). A second limitation was the use of land cover area as a proxy to analyze the change in ecosystem services. Some authors have expressed limitations on the use of proxy-based methods for mapping ecosystem services (Eigenboard et al. Citation2010), but such methods are widely used in the assessment of complex human-nature systems for landscape planning (Burkhard, Kroll, and Müller Citation2010; Paudyal et al. Citation2015; Chaudhary et al. Citation2016; Zhao et al. Citation2017).
Notwithstanding the limitations, the results provide a useful contribution to understanding of the interaction between land cover change and the use of ecosystem services from the landscape, and a useful input to decision-making in ecosystem management in the area and region. The area is fragile, but at present there are few data available to support planning. The limited information available in remote mountain regions like the Phobjikha valley is a key barrier in planning interventions at local, national, and regional scales (Hamilton Citation2015). Such information is necessary for informed planning, decision-making, and interventions (Xu and Grumbine Citation2014). The results of the present study help fill the information gap and can help in identifying trade-offs in ecosystem services and prioritizing ecosystems and services for sustainable management (De Groot et al. Citation2010). Incorporating the views of local people helps understanding of their dependence on land cover types, which can be used in identifying trade-offs in land cover types in sustainable management (e.g., forest versus agricultural land or settlements), for example, by reducing the burden on a particular land cover type. An integrated and holistic approach focusing on both conservation and community development should be used to manage and develop the valley sustainably. We recommend diversifying the limited livelihood strategies (potato farming and livestock grazing) to reduce the potential vulnerability of the local community and reduce the pressure on forest and marsh. Proper land use planning in the valley would be beneficial to maintain and regulate land uses in an effective way and avoid possible conflicts between settlement, agriculture, forest, and marsh. Alternative energy initiatives such as biogas from livestock dung should be promoted to reduce pressure on forests for fuelwood.
Conclusions
In this study, we assessed the ecosystem services provided to the local community by specific land cover classes in the Phobjikha valley and analyzed the impact of land cover change. A reduction in the area of forest and marsh over a 30-year period meant a decline in ecosystem services. The local community had perceived a decrease in the provisioning services which shape their subsistence livelihoods, especially fuelwood, fodder, and forest grazing. Loss of forest and marshland also has implications for ecosystem services supporting biodiversity, especially species with a specific habitat range such as the endangered black-necked crane and red panda. The findings of the study can contribute to management of ecosystem integrity by providing information to support identification of trade-offs in ecosystem services and land cover and development of an integrated and holistic approach to conserve and develop the valley sustainably.
Acknowledgments
We express our gratitude to David Molden and Eklabya Sharma from ICIMOD for their overall guidance and support for our work in the Phobjikha Valley of Bhutan. We also thank the Ministry of Agriculture and Forests, Royal Government of Bhutan, and Lam Dorji from RSPN for their continuous cooperation in this study and the overall project. Our sincere thanks go to the local people for their valuable time and effort during the household survey. Special thanks go to Eric Lambin from Stanford University, United States, for reviewing the article and providing insightful suggestions. Financial support received from the MacArthur Foundation and German Federal Ministry for Economic Cooperation and Development (BMZ) through its German Society for International Cooperation (GIZ) for conducting the analysis is highly appreciated. None of the authors have conflict of interest in this article. We express our special gratitude to the two anonymous reviewers for their constructive comments which help us to bring the article in its present form. Our special thanks go to Beatrice Murray for editing the manuscript.
Disclosure statement
No potential conflict of interest was reported by the authors.
Additional information
Funding
References
- Balsiger, J., and B. Debarbieux. 2015. “Should Mountains (Really) Matter in Science and Policy?” Environmental Science & Policy 49: 1–7. doi:10.1016/j.envsci.2015.03.015.
- Belisle, M. 2005. “Measuring Landscape Connectivity: The Challenge of Behavioral Landscape Ecology.” Ecology 86: 1988–1995. doi:10.1890/04-0923.
- Blaschke, T., and G. J. Hay. 2001. “Object-Oriented Image Analysis and Scale-Space: Theory and Methods For Modeling and Evaluating Multiscale Landscape Structure.” International Archives of Photogrammetry and Remote Sensing 34 (4), 22–29.
- Bugmann, H., A. B. Gurung, F. Ewert, W. Haeberli, A. Guisan, D. Fagre, A. Kääb, and G. Participants. 2007. “Modeling the Biophysical Impacts of Global Change in Mountain Biosphere Reserves.” Mountain Research and Development 27: 66–77. doi:10.1659/0276-4741(2007)27[66:MTBIOG]2.0.CO;2.
- Burkhard, B., F. Kroll, and F. Müller. 2010. “Landscapes‘ Capacities to Provide Ecosystem Services – A Concept for Land-Cover Based Assessments.” Landscape Online 1–22. doi:10.3097/LO.
- CBD. 2010. Programme of Work on Mountain Biodiversity. Montreal, Canada: Convention on Biological Diversity.
- Chaudhary, S., N. Chettri, K. Uddin, T. B. Khatri, M. Dhakal, B. Bajracharya, and W. Ning. 2016. “Implications of Land Cover Change on Ecosystems Services and People’s Dependency: A Case Study from the Koshi Tappu Wildlife Reserve, Nepal.” Ecological Complexity 28: 200–211. doi:10.1016/j.ecocom.2016.04.002.
- Chettri, N., E. Sharma, B. Shakya, and B. Bajracharya. 2007. “Developing Forested Conservation Corridors in the Kanchenjunga Landscape, Easternn Himalayas.” Mountain Research and Development 27: 211–214. doi:10.1659/mrd.0923.
- Chettri, N., E. Sharma, B. Shakya, R. Thapa, B. Bajracharya, K. Uddin, K. P. Oli, and D. Choudhury. 2010. “Biodiversity in the Eastern Himalayas: Status, Trends and Vulnerability to Climate Change”. ICIMOD: Kathmandu.
- Chettri, N., K. Uddin, S. Chaudhary, and E. Sharma. 2013. “Linking Spatio-Temporal Land Cover Change to Biodiversity Conservation in Koshi Tappu Wildlife Reserve, Nepal.” Diversity 5: 335–351. doi:10.3390/d5020335.
- Corburn, J. 2003. “Bringing Local Knowledge into Environmental Decision Making.” Journal of Planning Education and Research 22: 420–433. doi:10.1177/0739456X03022004008.
- De Groot, R. S., R. Alkemade, L. Braat, L. Hein, and L. Willemen. 2010. “Challenges in Integrating the Concept of Ecosystem Services and Values in Landscape Planning, Management and Decision Making.” Ecological Complexity 7: 260–272. doi:10.1016/j.ecocom.2009.10.006.
- Dorji, L., and T. Jigme. 2003. “Considering Economic Needs of the Community of Phobjikha, Bhutan: Constraints and Challenges.” Journal of National Sciene Foundation of Sri Lanka 31: 249–260.
- EEA. 2006. Biogeographical Regions in Europe. The Alpine Region—Mountains of Europe. Report: 1–52. Sweden: European Environment Agency.
- Eigenboard, F., A. Pr, B. Anderson, A. Heinemeyer, S. Gillings, D. Roy, C. Thomas, and K. Gaston. 2010. “The Impacts of Proxy-Based Methods on Mapping the Distribution of Ecosystem Services.” Journal of Applied Ecology 47: 377–385. doi:10.1111/j.1365-2664.2010.01777.x.
- Furst, C., C. Lorz, and F. Makeschin. 2011. “Integrating Land Management and Land Cover Classess to Assess Impacts of Land Use Change on Ecosystem Services.” International Journal of Biodiversity Science, Ecosystem Services and Management 7: 168–181. doi:10.1080/21513732.2011.611119.
- Gerlitz, J. Y., S. Banerjee, B. Hoermann, K. Hunzai, M. Macchi, and S. Tuladhar. 2014. Poverty and Vulnerability Assessment: A Survey Instrument for the Hindu Kush Himalayas. Kathmandu: ICIMOD.
- Halada, L. 2010. Ecosystem Services of Mountains: An Urgent Research Area. ALTERNet. Slovakia: Institute of Landscape Ecology.
- Hamilton, L., S. 2015. “When the Sacred Encounters Economic Development in Mountains.” George Wright Forum 32 (2): 132–140.
- Huber, R., H. Bugmann, A. Buttler, and A. Rigling. 2013. “Sustainable Land-Use Practices in European Mountain Regions under Global Change: An Integrated Research Approach.” Ecology and Society 18 (3): 37. http://dx.doi.org/10.5751/ES-05375-180337.
- ICIMOD, M. 2014. “An Integrated Assessment of the Effects of Natural and Human Disturbances on A Wetland Ecosystem: A Restrospective from the Koshi Tappu Wildlife Reserve, Nepal.” In An Integrated Assessment of the Effects of Natural and Human Disturbances on A Wetland Ecosystem: A Restrospective from the Koshi Tappu Wildlife Reserve, Nepal, edited by ICIMOD, Kathmandu, Nepal: ICIMOD, MoFSC.
- ICIMOD and RSPN. 2014. An Integrated Assessment of Effects of Natural and Human Disturbances on A Wetland Ecosystem: A Retrospective from Phobjikha Conservation Area, Bhutan In: edited by ICIMOD, Kathmdnu: ICIMOD.
- Korner, C., and M. Ohsawa. 2005. “Mountain Systems”. In: Ecosystems and Human Well-being: Current State and Trends, edited by R. Hassan, R. Scholes, N. Ash, 681–716, vol. 1. Washington, DC: Millennium Ecosystem Assessment.
- Lang, S., L. Pernkopf, J. B.Vanden, M. Förster, B. Haest, O. Buck, and A. Frick. 2011. “Fostering Sustainability in European Nature Conservation - NATURA 2000 Habitat Monitoring Based on Earth Observation Services.” Proceeding of 1st World Sustainable Forum, 1–8.
- Martin-Lopez, B., I. Iniesta-Arandia, M. Garcia-Llorente, I. Palomo, I. Casado-Arzuaga, D. G. Amo, E. Gomez-Baggethun, et al. 2012. “Uncovering Ecosystem Service Bundles through Social Preferences.” Plos One 7: e38970. doi:10.1371/journal.pone.0038970.
- Maxwell, S. L., R. A. Fuller, T. M. Brooks, and J. E. Watson. 2016. “Biodiversity: The Ravages of Gungs, Nets and Bulldozers.” Nature 536: 143–145. doi:10.1038/536143a.
- MEA, 2005. Millennium Ecosystem Assessment, Synthesis. Washington, DC.
- Mendez-Lopez, M. E., E. Garcia-Frapolli, D. J. Pritchard, M. C. Sanchez Gonzalez, I. Ruiz-Mallen, L. Porter-Bolland, and V. Reyes-Garcia. 2014. “Local Participation in Biodiversity Conservation Initiatives: A Comparative Analysis of Different Models in South East Mexico.” J Environ Manage 145: 321–329. doi:10.1016/j.jenvman.2014.06.028.
- Nelson, E., H. Sander, P. Hawthorne, M. Conte, D. Ennaanay, S. Wolny, S. Manson, and S. Polasky. 2010. “Projecting Global Land-Use Change and Its Effect on Ecosystem Service Provision and Biodiversity with Simple Models.” Plos One 5: e14327. doi:10.1371/journal.pone.0014327.
- Paudyal, K., H. Baral, B. Burkhard, S. P. Bhandari, and R. J. Keenan. 2015. “Participatory Assessment and Mapping of Ecosystem Services in a Data-Poor Region: Case Study of Community-Managed Forests in Central Nepal.” Ecosystem Services 13: 81–92.
- Pedrono, M., B. Locatelli, D. Ezzine-de-Blas, D. Pesche, S. Morand, and A. Binot. 2016. “Impact of Climate Change on Ecosystem Services.” In Climate Change and Agriculture Worldwide, edited by E. Torquebiau, 251–261. Netherlands: Springer.
- Pereira, E., C. Queiroz, H. Pereira, and L. Vicente. 2005. “Ecosystem Services and Human Well-Being: A Participatory Study in a Mountain Community in Portugal.” Ecology and Society 10: 1–23.
- Phuntsho, T. 2010. Socioeconomic Changes and Their Impacts on the Wetland Ecosystem of Phobjikha Valley, Bhutan: Towards a Balanced Use of Ecosystems? Wageningen: Wageningen University.
- Pradhan, R. 2010. Biodiversity Report: Phobjikha Landscape Conservation. Thimpu: Royal Society for Protection of Nature.
- Reyers, B., P. J. O’ Farrell, R. M. Cowling, B. N. Egoh, D. C. Le Maitre, and J. H. J. Vlok. 2009. “Ecosystem Services, Land Cover Change and Stakeholders: Finding a Sustainable Foothold for a Semiarid Biodiversity Hotspot.” Ecology and Society 14: 38. doi:10.5751/ES-02867-140138.
- RSPN. 2007. Phobjikha Landscape Conservation Area: Management Plan 2006–2010. Thimpu: Royal Society for Protection of Nature.
- Sandhu, H., and S. Sandhu. 2014. “Linking Ecosystem Services with the Constituents of Human Well-Being for Poverty Alleviation in Eastern Himalayas.” Ecological Economics 107: 65–75. doi:10.1016/j.ecolecon.2014.08.005.
- Schild, A. 2008. “ICIMOD’s Position on Climate Change and Mountain Systems.” Mountain Research and Development 28: 328–331. doi:10.1659/mrd.mp009.
- Schroter, D., W. Cramer, R. Leemans, I. C. Prentice, M. B. Araujo, N. W. Arnell, A. Bondeau, et al. 2005. “Ecosystem Service Supply and Vulnerability to Global Change in Europe.” Science 310 (5752): 1333–1337.
- Sohel, M.S.I., S.A. Mukul, and B. Burkhard. 2015. “Landscape׳ s Capacities to Supply Ecosystem Services in Bangladesh: A Mapping Assessment for Lawachara National Park.” Ecosystem Services 12: 128–135.
- Spehn, E., K. Rudmann-Maurer, C. Korner, and D. Maselli. 2010. Mountain Biodiversity and Global Change. Basel, Switzerland: GMBA-DIVERSITAS.
- TEEB, 2010. The Economics of Ecosystems and Biodiversity: Mainstreaming the Economics of Nature – A Synthesis of the Approach, Conclusions and Recommendations of TEEB. Switzerland: TEEB.
- Tovar, C., C. A. Arnillas, F. Cuesta, and W. Buytaert. 2013. “Diverging Responses Of Tropical Andean Biomes Under Future Climate Conditions.” PloS One 8 (5): e63634.
- UNEP. 2002. Mountain Ecosystems Fundamental to Life but Extremely Fragile. Nairobi: UNEP.
- Villamagna, A. M., P. L. Angermeier, and E. M. Bennett. 2013. “Capacity, Pressure, Demand and Flow: A Conceptual Framework for Analyzing Ecosystem Service Provision and Delivery.” Ecological Complexity 15: 114–121. doi:10.1016/j.ecocom.2013.07.004.
- Wangchuk, S., S. Siebert, and J. Belsky. 2014. “Fuelwood Use and Availability in Bhutan: Implications for National Policy and Local Forest Management.” Human Ecology 42 (1): 127–135. doi:10.1007/s10745-013-9634-4.
- Xu, J., and R. E. Grumbine. 2014. “Building Ecosystem Resilience for Climate Change Adaptation in the Asian Highlands.” Wiley Interdisciplinary Reviews: Climate Change 5 (6): 709–718. doi:10.1002/wcc.302.
- Zhang, Y., Z. Shidong, and G. Rongchao. 2014. “Recent Advances and Challenges in Ecosystem Service Research.” Journal of Resources and Ecology 5 (1): 82–90. doi:10.5814/j.issn.1674-764x.2014.01.010.
- Zhao, Z., W. Xue, Z. Yili, and G. Jungang. 2017. “Assessment of Changes in the Value of Ecosystem Services in the Koshi River Basin, Central High Himalayas Based on Land Cover Changes and the CA-Markov Model.” Journal of Resources and Ecology 8 (1): 67–76. doi:10.5814/j.issn.1674-764x.2017.01.009.