
ABSTRACT
Introduction: The application of remote-sensing techniques for water quality assessment has become increasingly popular in China. However, existing reviews are often limited to qualitative description and are quite fragmented.
Outcomes: We conducted a quantitative systematic review to display current research status and identify the existing challenges and future directions. Our review revealed that the application of remote-sensing techniques in water quality research has expanded dramatically in China, but the spatial distribution is quite uneven. Second, the ground object spectrometer is the most widely applied data source. Water color indicators such as chlorophyll a and suspended solid are the most widely investigated in China. Third, semiempirical method is the most commonly used inversion method. Existing studies rarely considered the anthropogenic factors, which limited the model robustness and its application in human-dominated aquatic ecosystems.
Discussion and Conclusion: We concluded that, in the past several decades, China has made notable progresses in monitoring and evaluation of water quality using the remote-sensing techniques (especially in inland lakes). We proposed that further improvements would be needed in terms of temporal and spatial coverage, indicator list, the incorporation of human–nature interactions, inversion accuracy, and model generalization.
Introduction
Rapid urbanization and socioeconomic development are causing China to encounter severe water problems (Ma, Xu, and Wang Citation2014; Zhang Citation2014). The uneven distribution of freshwater resources is making some parts of China to experience water shortages intermittently (Zhang et al. Citation2013; Wang et al. Citation2014). The water shortage problems in China are further exacerbated by water pollution, not only for the inland freshwater but also for the coastal water resources (Ministry of Ecology and Environment of the People’s Republic of China Citation2018). According to the most recent national survey in 2017, bad quality (Grade IV or worse) surface freshwater accounted for 22.1% of total freshwater resources in China. In addition, of the total 109 assessed lakes, 33 (30.3%) were experiencing eutrophication. For coastal water resources, only 34.5% was reported to be clean with little pollution (Grade I). Given the escalating anthropogenic activities and water pollution issues, there are growing needs to perform integrated and regular water monitoring as a benchmark for achieving systematic water management in China. However, the traditional in situ water sampling and measurements are time-consuming, laborious, and costly (Cai et al. Citation2008). Rapid development of remote-sensing techniques, especially the launch of hyper-resolution satellites, enables the application of remotely sensed data for monitoring large-scale and long-term water quality. Conceptually, the basic idea of water quality remote-sensing inversion is to first establish a model using the empirical water quality monitoring data and corresponding remote-sensing image data (i.e., forward modeling) and then obtain the water quality distribution in a longer time or wider space according to the model (i.e., inverse modeling). With appropriate in situ validation, remotely sensed satellite images can provide high-accuracy interpolation, generating spatially explicit water quality maps more efficiently (i.e., it consumes less time, labor, and financial inputs), even for places with limited in situ sampling (Giardino et al. Citation2010; Wang et al. Citation2012; Gholizadeh, Melesse, and Reddi Citation2016).
Over the past several decades, scholars mainly paid attention to the application of various remote-sensing data sources and improvement of numerous inversion methods to pursue high-accuracy estimations. On the one hand, the remote-sensing data have evolved from multispectral sensors to hyperspectral sensors. Briefly, Multispectral Scanner (MSS) is the earliest used sensor for monitoring both chlorophyll a (Chla) and suspended solid (SS). For example, Williamson and Grabau (Citation1974) developed an empirical algorithm to retrieve SS concentration in Chesapeake Bay using the Landsat-1 MSS. A decade later, Carpenter and Carpenter (Citation1983) applied the Landsat MSS data to simulate the Chla of inland water. In 1990s, the application of Thematic Mapper (TM) became the common choice in water quality remote sensing. Since the late twentieth century, the emergence of Landsat-7 ETM (enhanced TM), SPOT (Système Probatoire d’ Observation de la Terre), MODIS (Moderate-resolution Imaging Spectroradiometer), and more multispectral sensors greatly enhanced the data resource series, which were widely adopted in different inversion models (Han Citation2004; Wu and Wang Citation2005; Xu Citation2006). More recently, the establishment of China’s environmental monitoring satellites provided detailed and accessible remote-sensing data for studying the water resources of China. To offer targeted data products for the users, HJ-1A/B CCD (a Chinese satellite for environmental and disaster monitoring and forecasting) and HJ-1A HIS (hyperspectral imager) acquired the multispectral and hyperspectral remote-sensing data, respectively. For example, Wang, Yang, and Wu (Citation2009) found that the three-band model based on the HJ-1A HIS data could give a better estimate of Chla concentration in Chaohu Lake. Xue et al. (Citation2014) used the HJ-1 CCD data to systematically analyze the Chla and eutrophication index in Dongting Lake. In addition, GF-1 (Gaofen-1 satellite) is also a popular satellite data resource equipped with high-resolution panchromatic band (2 m) and high temporal resolution (4 days). Based on the GF-1 WFV4 (a multispectral sensor) image, Zhu et al. (Citation2016) developed a BP (Back Propagation) neural network model to estimate Chla in Taihu Lake.
On the other hand, researchers have made efforts to improve the inversion accuracy of different models. Regarding the inversion methods, the application of remotely sensed data for water quality monitoring and evaluation can be performed using four methods, i.e., empirical, semiempirical, semi-analytical, and analytical methods (Zhou et al. Citation2004; Wang et al. Citation2012). Despite the different terminologies used for these inversion methods (e.g., the analytical method is also called the physical method [Zhou et al. Citation2004]), the definition above is generally accepted by majority of the scholars. Empirical and semiempirical methods primarily involve statistical analyses, while analytical and semi-analytical methods require theoretical analyses of spectral information. For the empirical method, the correlations between the water quality parameters and corresponding remote-sensing reflectance are calculated to obtain characteristic bands or band combinations. Then the inversion algorithm is obtained via the statistical analyses (e.g., regression models) between the water quality parameters and selected characteristic bands or band combinations (Qi et al. Citation2014; Cheng et al. Citation2015; Zhou and Wang Citation2015). Typical empirical methods include linear regression, single-band method, band-combination method (e.g., band-ratio, band difference), artificial neural network, principal component analysis, and so on. Semiempirical method also requires the measured spectral analysis in addition to the statistical analyses (Liu, Kuang, and Yin Citation2004; Feng et al. Citation2014; Xu, Shi, and Li Citation2014; He et al. Citation2015). It means that it is necessary to analyze the spectral characteristics of the water quality parameters when selecting the characteristic bands or choosing suitable models, which integrates the water spectral theory with traditional statistical analyses (Li Citation2009). The utilization of hyperspectral remote-sensing technology has accelerated the advancement of semiempirical method, which often shares the same model set as corresponding empirical method. By contrast, analytical method completely follows the radiation transmission theory to establish models between water-leaving radiance and water quality parameters (Tian et al. Citation2015; Wu Citation2015). Similarly, semi-analytical method involves a certain amount of statistical analysis to obtain the model parameters (Zhou et al. Citation2008, Citation2011; Chen et al. Citation2013; Lu Citation2016). Meanwhile, the most commonly applied semi-analytical model is the three-band model (Pang Citation2010). The basic principle of the three-band method is to find the three-band combinations that are most relevant to the absorption coefficient and determine the quantitative relationship with the water quality parameters through the absorption coefficient. It was first applied to estimate the chlorophyll content of terrestrial vegetation (Gitelson, Yuri, and Merzlyak Citation2003). Later Dall’Olmo, Rundquist, and Gitelson (Citation2003) found that this model can also be used to estimate the concentration of Chla in turbid water.
The development of the above four methods is accompanied by the pursuit of model inversion accuracy. Gordon, Brown, and Jacobs (Citation1975) explored the relationships between the inherent and apparent optical properties of water to build the theoretical basis for model construction. Later, studies made efforts to identify the correct feature band and more types of models in various water quality assessments. As for Chla, for example, red band and near-infrared band as well as their band ratio are typically used for constructing different inversion algorithms. In China, Shu, Yin, and Kuang (Citation2000) reported a rather good correlation between the reflection of near 700 nm and the chlorophyll concentration when the Chla concentration is above 5 µg/L. Besides, to obtain more accurate models, scholars have made various small improvements such as band combination, analysis of the measured spectra, water space division, time segmentation, etc. For example, Wang, Ma, and Deng (Citation2007) discussed Taihu Lake’s water quality by dividing the research area into different parts in accordance to the MODIS image tone after principal component transformation. Using Landsat-9 OLI data, Yan (Citation2016) established three types of models including single-band model (i.e., band-combination model and the least squares support vector machine model) for summer and winter periods. Nonetheless, most of the existing improvements on models and inversion algorithms are limited to specific periods and case studies. To our knowledge, very few studies explored the theoretical aspect of optical properties of water quality parameters.
As stated above, China has a large number of case studies which applied remote-sensing techniques to study water quality and most of them focus on the empirical monitoring of water quality problems. Whilst there is increasing need and interest for water quality monitoring using remote sensing in China, there is a lack of quantitative review on this topic. To promote further understanding and application of remote-sensing techniques in water quality monitoring and evaluation in China, we systematically synthesize the research status and general trend through literature review. The objectives of this review are (1) to understand the temporal and spatial patterns of case studies in China, (2) to summarize the main satellite images used in the literature, and (3) to synthesize the major water quality indicators and analytic methods applied in existing studies.
Methods
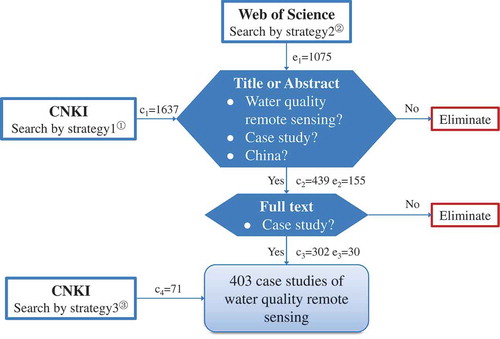
We first conducted a comprehensive search of articles on China National Knowledge Infrastructure (CNKI) and Web of Science using the terms “water quality” and “remote sensing” as topical subject. Next, we supplemented the search of “water color remote sensing” on CNKI, due to the variation in Chinese translation. By screening the titles and abstracts via the EndNote software (version X7), we discarded irrelevant articles not focusing on China. Through this process, we identified 594 case studies as the basic data for statistical analysis. After that, we performed a detailed double check on the selected literature by scanning the full text and excluded irrelevant literature, which is not a case study (e.g., a review) or whose main topic is not water quality-related remote sensing (e.g., land-use and land-cover change). Finally, we got 403 publications (373 in Chinese and 30 in English) of case studies in China. illustrates the overall process of literature selection.
Figure 1. The overall process of literature selection. ① Themes: (“water quality” and “remote sensing”), patent was excluded; ② Themes: (“water quality”) AND (“remote sensing”), only document type of “Article” was included; ③ Themes: (“water color remote sensing”), patent was excluded. The search year was limited to 2016 or earlier. (c1 ~ c4 refer to the number of publications in Chinese; e1 ~ e3 mean the number of publications in English)
We scrutinized the selected case studies and recorded the information for this review. To explore the temporal and spatial dynamics, we noted down the time and location of each case study. We also differentiated the water quality parameters and the methods of establishing the inversion algorithms. Overall, we listed a table consisting of title, published year, research area, inversion methods, characteristic bands, remote-sensing data resource, and so on. Then, we sorted the data in accordance to these dimensions: year, research site, satellite, water quality indicator, and inversion method. We further analyzed the sorted data by each dimension. This review visualized the statistical results using the obtained information.
Results
Spatiotemporal patterns
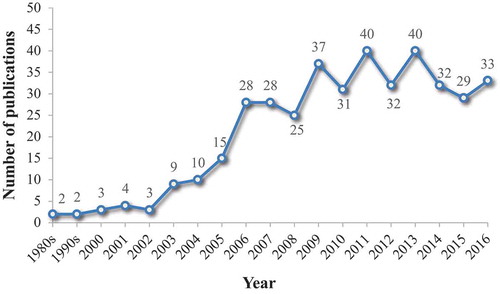
shows that the trend of case studies of water quality monitoring and evaluation using remote-sensing techniques in China generally increased since the 1980s. Particularly, the total number of relevant publications has increased by approximately 12 times between 2000 and 2009. According to our selection criteria, the earliest case of water quality monitoring and evaluation based on remote sensing in China occurred in 1980. Fei (Citation1983) acquired the water reflectance data of the estuary of Haihe River using a spectrograph attached to an airplane in 1980. By combining the water spectral data and on-site empirical measurements, Fei (Citation1983) found that the water spectral metrics were highly correlated to the concentrations of chlorophyll (r = 0.97) and suspended sediment (r = 0.96).
Figure 2. Temporal trend of case studies of water quality monitoring and evaluation using the remote-sensing techniques in China
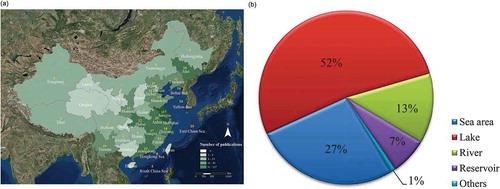
displays the spatial distribution of case studies on both freshwater and seawater. For freshwater, the most investigated provinces are Jiangsu, Anhui, Hubei, and Guangdong. Jiangsu Province ranked the top among the provinces mainly because of Taihu Lake, the third largest freshwater lake in China and the most well-known eutrophic lake in China due to the outbreak of algae bloom in 2007 (Qin et al. Citation2007; Du et al. Citation2016). Such spatial pattern is also consistent with the distribution of water bodies, of which lakes account for 52% of the total studies ()). In other words, the extensive outbreak of algae bloom in Taihu Lake in 2007 has attracted widespread attentions to monitor and evaluate water quality using the remote-sensing techniques. Nevertheless, majority of the investigated areas located in the east and southeast of China, with little attention paid to the west and northwest of China. Particularly, we could not identify any relevant studies in Gansu, Qinghai, Shanxi, and Ningxia provinces in the inland area. For seawater, a number of studies follow this descending order, i.e., East China Sea (20 studies), Bohai Sea (14 studies), Yellow Sea (14 studies), Hong Kong Sea (8 studies), and South China Sea (5 studies). Overall, the total number of studies on seawater (109, including coastal water) was only 37.1% of that of freshwater (294).
Figure 3. (a) Spatial distribution of case studies in China. For each province, we take into account the cases of coastal or nearshore water. The coastal zone contains both freshwater and seawater case studies; (b) Types of water body studied in the literature
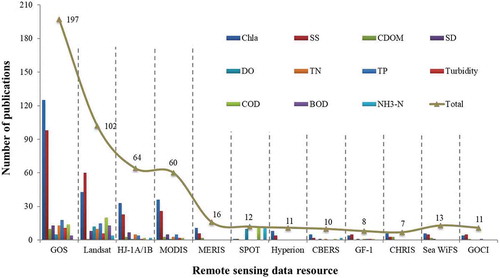
Remote-sensing data resources
displays the properties of normally used sensors in the case studies. ETM sensor broadens the monitored parameter range by the thermal band attached on Landsat-7 and 8. Relative to the hyperspectral sensors, multispectral sensors have lower spectral resolution but provide more integrated spectral information. Moreover, multispectral sensors (including Landsat, MODIS, MERIS, HJ-1A/B CCD) are widely applied in research than hyperspectral sensors (see ). Ground object spectrometer (GOS) is the most commonly used spectrometer because it is a necessary part of the field measurements accompanied with point water sampling. It also shows that the Landsat series satellites are the most popular data resources. Especially, Landsat-5 TM is utilized much more and earlier than any other multispectral sensors (Li, Ji, and Yang Citation1993; She et al. Citation1996), mainly because of its early launch, free access, and having the longest running time on orbit. also indicates that the assessment of a specific water quality parameter may require specific kind of remotely sensed data. Notably, the water quality indicators such as Chla and SS have the maximum range of sensor selection due to their active optical properties. It is also worth noting that the SPOT series offer more applications in the assessment of dissolved oxygen (DO), chemical oxygen demand (COD), and ammonia–nitrogen (NH3–N).
Table 1. General information of space borne and ground remote sensors used in the reviewed publications
Figure 4. The remote-sensing data resources used in the case studies for different water parameters. (GOS: Ground object spectrometer.)
Assessed water quality indicators
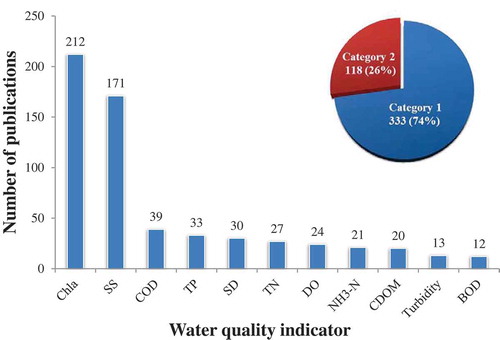
Conventional water quality monitoring system includes three aspects of water indicators: physical indices (e.g., temperature, turbidity, chromaticity, smell, and electrical conductivity), chemical indices (e.g., pH, DO, COD, BOD [biochemical oxygen demand], total organic carbon, heavy metal ion, and nonmetallic poison), and microbiological indices (e.g., total bacteria and total coliforms). Based on the remote-sensing techniques, we classified the assessed water quality indicators into two categories. The first category contains indicators with active optical characteristics (e.g., Chla, SS, CDOM [colored dissolved organic matter]) which affect the radioactive transfer process of waves through different absorption of the spectrum. For example, the main absorption bands of chlorophyll are red and blue–violet light, which affect the optical properties of water bodies during radiation transmission. The second category includes the indicators without explicit optical properties (e.g., DO, TN [total nitrogen], TP [total phosphorus]). Such indicators are often assessed based on statistical relationships with other indicators.
clearly demonstrates that most of the case studies (74%) concentrated on optically active water quality parameters (e.g., Chla, SS, and CDOM); much less case studies (26%) were conducted for the water quality parameters with poor optical properties and low signal-to-noise ratio (Gholizadeh, Melesse, and Reddi Citation2016). The case studies of water quality assessment using remote-sensing techniques in China predominately focused on Chla (212 studies) and SS (171 studies). Chla remains to be the most intensely studied water quality parameter (especially for lakes) because it is an important indicator of water trophic level (An et al. Citation2013). However, SS is the earliest water quality indicator being studied using remote-sensing technique (Lu Citation2016). Apparently, most of the case studies on the inland water (coastal or sea water) quality targeted Chla (SS). Whilst the least studied parameters are turbidity and BOD, some studies revealed that we could derive them from other optically active water quality indicators. For instance, Sun, Li, and Lu (Citation2009) constructed a semiempirical inversion algorithm to retrieve BOD indirectly through the strong correlation between BOD and TN or TP.
Figure 5. The total number of publications by different indicators monitored in case studies. Category 1 denotes the variables with active optical characteristics; Category 2 denotes the variables with weak optical characteristics
Methods for establishing inversion algorithms
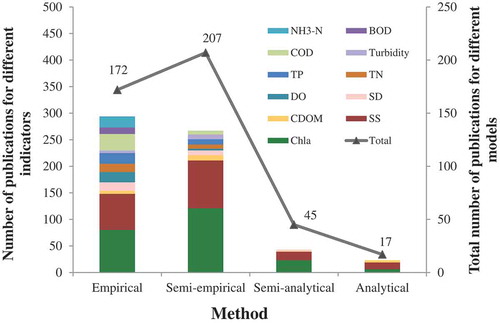
shows the number of case studies using different inversion methods. The semiempirical method is the most widely used approach, accounting for 51.3% (207 of 403) of the total number of case studies. The empirical method ranks the second (42.6%). The analytical method is the least applied, accounting for only 4.2% (17 case studies); its application is also rare for each of the water quality indicators. For the 11 commonly assessed water quality indicators, our results suggest that the empirical method is the most common for almost all indicators, while semiempirical method is widespread in the evaluation of Chla, SS, and CDOM (). Furthermore, semi-analytical method and analytical method are basically employed for retrieving Chla, SS, CDOM, and SD (Secchi disk depth). In addition, we notice that all the case studies (in this review) treated the aquatic ecosystem as a separate, closed system without incorporating the human disturbance factors in the inversion models. Since most of the aquatic ecosystems are highly affected by anthropogenic activities, ignoring the human disturbance factors would limit the model accuracy and robustness.
Figure 6. Methods of water quality monitoring based on remote sensing. A case study may use more than one inversion methods, so the sum of the four methods is greater than 403, the actual total number of reviewed case studies
Discussion
We systematically and quantitatively synthesized the research status and trend of applying remote-sensing techniques in water quality monitoring and evaluation in China (including the spatiotemporal patterns, use of indicators, data sources, and inversion methods). From the spatiotemporal patterns, the assessment of water quality for sea water is far less than that for inland water in China, indicating that researchers should pay more attention to sea areas than inland water resources. Ocean is the largest aquatic ecosystem, connecting and influencing all countries in the world through the hydrological cycle. Marine pollution driven by land pollutants and human maritime activities (e.g., aquaculture activities) has caused adverse impacts on coastal areas in China (Kang Citation2011). Since China has a long coastline, it is crucial to strengthen the coastal ecosystem management. However, the monitoring and management of coastal water have been difficult and costly for these reasons, i.e., wide spatial coverage, dramatic seasonal variation, and intensive human disturbance. In this sense, the application of remotely sensed data in the coastal water quality monitoring and evaluation is helpful. For China’s inland areas, the spatial distribution of water quality monitoring and evaluation using remote-sensing techniques is uneven with fewer studies in the northwest of China, e.g., Tibet, Xinjiang, Gansu, Qinghai, etc.
Chla and SS are the most important water quality indicators, simultaneously constituting the major parameters of water color remote sensing. It is necessary to differentiate between water quality remote sensing and water color remote sensing. Water color remote sensing originates from ocean color remote sensing and is applied in inland water later on. In China, there have been fewer studies on ocean color remote sensing, while the research on estimating Chla and SS of lakes is highly popular. Although the water quality indicator system consists of many water quality parameters, the color of water is mainly influenced by Chla, SS, and CDOM (see ). More generally, water color remote sensing can be perceived as a part of water quality remote sensing. Besides, there is no sensor specifically designed for lake water color remote sensing (Pan and Ma Citation2008). By contrast, many sensors (like MODIS, SeaWiFS, and MERIS) are routinely used for ocean water color retrieval.
One distinctive point of this review is the classification of inversion methods. Previous studies mostly divided them into three kinds, but we further classified them into four categories (i.e., empirical, semiempirical, semi-analytical, and analytical; see ). In previous studies, some mixed the empirical and semiempirical methods together (Lei Citation2012), while some regarded the analytical and semi-analytical methods as the same category (Zhou et al. Citation2004). The improved classification and synthesis of existing studies in current review (see ) should guide future investigations on monitoring appropriate water quality indicators, selecting sound inversion methods, as well as improving the existing inversion algorithms. From our viewpoint, empirical method differs from analytical method mainly on deriving the models from the relationship between water quality concentration and water reflectance. Semiempirical method can be regarded as the improved empirical method with higher accuracy, while semi-analytical method as a more practical analytical method.
Table 2. The classification and major differences between the four inversion methods
In addition, one major challenge of remote sensing in water quality monitoring and evaluation in China is the lack of generalization in the inversion models. So far, most of the case studies pursued the improvement of model accuracy or the application of higher resolution remote-sensing data, with little attempt to generalize them and venture into other water quality research. Another shortcoming is the failure to account for anthropogenic factors. Majority of the existing case studies are study areas with vast and smooth water surface, while many areas are human-dominated aquatic ecosystems (e.g., aquaculture areas, urban water bodies). Taking the coastal aquaculture area as an example, the surface of its water body is typically distributed with various infrastructures (e.g., net cages, houses, and floating foams), which greatly interfere with the acquisition of water spectrum.
Here, we propose some plausible directions for future research. First, continued efforts on improving the model accuracy and data resolution remain important. An integration of different remote-sensing data sources into a combined product is particularly helpful in this regard. Most of the existing studies used free satellite images (e.g., Landsat, HJ-1A/1B, and MODIS) with relatively coarse spatial and spectral resolution (except for GOS). However, free satellite images often have some gaps in their spatial coverages because of high cloud percentage or lack of data in coastal and sea areas. By contrast, hyperspectral data provide more comprehensive water spectral information with higher resolution, but these are commercial products. In this sense, it should be a good idea to fill the gaps within the free satellite images with the hyperspectral data. To this end, it would be useful to develop methods for integrating different data sources for comprehensive water quality monitoring and evaluation. Moreover, future research may use more sophisticated methods (e.g., support vector machine [He et al. Citation2015] and artificial neural networks [Zhu et al. Citation2016]) instead of the traditional linear or nonlinear regression analyses in empirical and semiempirical methods. Second, advanced research and theoretical breakthroughs of analytical methods would be the key to develop the more generalized models. The systematic study of the intrinsic optical properties of water quality components can reduce or even eliminate the interference of other components and human activities on the measured parameter. This would push forward the development of semi-analytical and analytical methods, which are based on the radiation transmission theory of water. Third, further investigations could conceptualize the coupled human–nature interactions into the model construction (Liu et al. Citation2016; Hyndman et al. Citation2017). Besides, further research and management should focus on establishing a systematic water quantity and quality monitoring system. Such kind of monitoring system would have a more comprehensive list of water quality indicators and enables the users to monitor the direct and indirect drivers of water quantity and quality. This would then allow the users to project future changes and implement proactive adaptive management measures (Liu and Yang Citation2012).
In the past several decades, China has made commendable progresses in the water quality monitoring and evaluating using the remote-sensing techniques, especially in inland lakes. Going forward, it would be helpful to achieve further improvements in terms of temporal and spatial coverage, indicator list, the incorporation of human–nature interactions, inversion accuracy, and model generalization. Through these improvements, it would be possible to monitor and evaluate the water bodies inside and beyond China.
Author contributions
W.Y. and X.W. designed the research. X.W. collected the data, conducted the analysis, and wrote the first draft. X.W. and W.Y. revised the manuscript together.
Supplemental Material
Download MS Word (57.6 KB)Acknowledgments
We thank Andrés Viña for constructive comments on an earlier draft.
Disclosure statement
No potential conflict of interest was reported by the authors.
Supplementary material
Supplemental data for this article can be accessed here.
Additional information
Funding
Related Research Data
References
- An, R., Y. Liu, C. Qu, Q. B. Ja, X. Liang, X. Xu, Z. Wang, and D. Jiang. 2013. “Estimation of chlorophyll-a Concentration of Case Ⅱ Waters from Hyperspectral Remote Sensing Data in NDCI Method.” Journal of Lake Sciences 25 (3): 437–444. doi:10.18307/2013.0319.
- Cai, L., P. Liu, and C. Zhi. 2008. “Discussion on Remote Sensing Based on Water Quality Monitoring Methods.” Geomatics & Spatial Information Technology 31 (4): 68–73. doi:10.3969/j.issn.1672-5867.2008.04.021.
- Carpenter, D. J., and S. M. Carpenter. 1983. “Modeling Inland Water Quality Using Landsat Data.” Remote Sensing of Environment 13 (4): 345–352. doi:10.1016/0034-4257(83)90035-4.
- Chen, Y., G. Zheng, X. Wang, and X. Chen. 2013. “Retrieval of Chlorophyll-a Concentration with Multi-Sensor Data by GSM01 Merging Algorithm.” Journal of Geo-Information Science 15 (6): 911–917. doi:10.3724/SP.J.1047.2013.00911.
- Cheng, Q., B. Liu, T. Li, and L. Zhu. 2015. “Research on Remote Sensing Retrieval of Suspended Sediment Concentration in Hangzhou Bay by GF-1 Satellite.” Marine Environmental Science 34 (4): 558–563+577. doi:10.13634/j.cnki.mes.2015.04.015.
- Dall’Olmo, G., D. C. Rundquist, and A. A. Gitelson. 2003. “Towards a Unified Approach for Remote Estimation of Chlorophyll-a in Both Terrestrial Vegetation and Turbid Productive Waters.” Geophysical Research Letters 30 (18): 159–171. doi:10.1029/2003gl018065.
- Du, C., Y. Li, Q. Wang, L. Zhu, and H. Lü. 2016. “Inversion Model and Daily Variation of Total Phosphorus Concentrations in Taihu Lake Based on GOCI Data.” Environmental Science 37 (3): 862–872. doi:10.13227/j.hjkx.2016.03.010.
- Fei, Z. 1983. “Estimation of Chlorophyll a and Suspended Sediment Content in Estuarine Coastal Waters Using Water Color Remote Sensing Data.” Acta Oceanologica Sinica 5 (5): 596–603.
- Feng, L., C. Hu, X. Han, X. Chen, and L. Qi. 2014. “Long-Term Distribution Patterns of Chlorophyll-a Concentration in China’s Full-Resolution Observations with a Practical Approach.” Remote Sensing 7 (1): 275–299. doi:10.3390/rs70100275.
- Gholizadeh, M. H., A. M. Melesse, and L. Reddi. 2016. “A Comprehensive Review on Water Quality Parameters Estimation Using Remote Sensing Techniques.” Sensors 16 (8): 1–43. doi:10.3390/s16081298.
- Giardino, C., M. Bresciani, P. Villa, and A. Martinelli. 2010. “Application of Remote Sensing in Water Resource Management: The Case Study of Lake Trasimeno, Italy.” Water Resources Management 24 (14): 3885–3899. doi:10.1007/s11269-010-9639-3.
- Gitelson, A. A., G. Yuri, and M. N. Merzlyak. 2003. “Relationships between Leaf Chlorophyll Content and Spectral Reflectance and Algorithms for Non-Destructive Chlorophyll Assessment in Higher Plant Leaves.” Journal of Plant Physiology 160 (3): 271–282. doi:10.1078/0176-1617-00887.
- Gordon, H. R., O. B. Brown, and M. M. Jacobs. 1975. “Computed Relationships between Inherent and Apparent Optical-Properties of a Flat Homogeneous Ocean.” Applied Optics 14 (2): 417–427. doi:10.1364/ao.14.000417.
- Han, Z. 2004. “Remote Sensing Information Extraction and Quantitative Inversion Research of Silt Tidal Fiat and Suspended Sediment of Case Ⅱ Waters in Coast Zone.” Doctor Thesis, East China Normal University.
- He, B., W. Zhang, X. Qiao, and Z. Su. 2015. “A Study on Remote Sensing Retrieval of Suspended Sediment Concentrationin Middle Yangtze River Based on A FOA-SVM Method.” Resources and Environment in the Yangtze Basin 24 (4): 647–652. doi:10.11870/cjlyzyyhj201504016.
- Hyndman, D. W., T. Xu, J. M. Deines, G. Cao, R. Nagelkirk, A. Viña, W. McConnell, et al. 2017. “Quantifying Changes in Water Use and Groundwater Availability in a Megacity Using Novel Integrated Systems Modeling.” Geophysical Research Letters 44 (16): 8359–8368. doi:10.1002/2017GL074429.
- Kang, W. 2011. “The Impact Study of Mariculture on Marine Ecology Environment in Changli, Hebei Province.” Master Thesis, Hebei Normal University.
- Lei, P. 2012. “The Establishment and Application of Semi-Analysis Model on Suspended Sediment Remote Sensing Inversion in Caofeidian Offshore Water.” Master Thesis, Chang’an University.
- Li, W. 2009. “Method of Water Quality Remote Sensing and Its Application.” Energy and Environment 5 (5): 62–64. doi:10.3969/j.issn.1672-9064.2009.05.027.
- Li, X., G. Ji, and J. Yang. 1993. “Water Quality Mapping from Landsat Thematic Mapper Data.” Remote Sensing of Environment 8 (1): 36–44+81. doi:10.11834/jrs.1993004.
- Liu, J., V. Hull, W. Yang, A. Viña, X. Chen, Z. Ouyang, and H. Zhang, editors. 2016. Pandas and People: Coupling Human and Natural Systems for Sustainability. Oxford, UK: Oxford University Press.
- Liu, J., and W. Yang. 2012. “Water Sustainability for China and Beyond.” Science 337 (6095): 649–650. doi:10.1126/science.1219471.
- Liu, T., D. Kuang, and O. Yin. 2004. “Study on Hyperspectral Quantitative Model of Concentrations for Chlorophyll a of Alga and Suspended Particles in Tailake.” Journal Infrared Millimeter and Waves 23 (1): 11–15. doi:10.3321/j.issn:1001-9014.2004.01.003.
- Lu, S. 2016. “Research Progress on the Retrieval of Suspended Sediment from Ⅱ Water.” Modern Computer 32 (32): 34–39. doi:10.3969/j.issn.1007-1423.2016.32.008.
- Ma, H., J. Xu, and P. Wang. 2014. “Water Resource Utilization and China’s Urbanization.” Resources Science 36 (2): 334–341.
- Ministry of Ecology and Environment of the People’s Republic of China. 2018.” A Picture of Speed Reading 2017 China’s Ecological Environment Bulletin”. Accessed 5 May 2018. http://www.zhb.gov.cn/hjzl/tj/201805/t20180531_442197.shtml
- Pan, D., and R. Ma. 2008. “Several Key Problems of Lake Water Quality Remote Sensing.” Hupo Kexue 20 (2): 139–144. doi:10.18307/2008.0201.
- Pang, B. 2010. “Inversion of Water Quality Parameters and Evaluation of Eutrophication in Inland Lakes.” Master Thesis, University of Electronic Science and Technology of China.
- Qi, L., C. Hu, H. Duan, B. Barnes, and R. Ma. 2014. “An EOF-based Algorithm to Estimate Chlorophyll-a Concentrations in Taihu Lake from MODIS Land-Band Measurements: Implications for near Real-Time Applications and Forecasting Models.” Remote Sensing 6 (11): 10694–10715. doi:10.3390/rs61110694.
- Qin, B., P. Xu, Q. Wu, L. Luo, and Y. Zhang. 2007. “Environmental Issues of Lake Taihu, China.” Hydrobiologia 581 (1): 3–14. doi:10.1007/s10750-006-0521-5.
- She, F., X. Li, Q. Cai, and Y. Chen. 1996. “Quantitative Analysis on Chlorophyll -a Concentration in Taihu Lake Using Thematic Mapper Data.” Journal of Lake Science 8 (3): 201–207. doi:10.18307/1996.0302.
- Shu, X., Q. Yin, and D. Kuang. 2000. “Relationship between Algal Chlorophyll Concentration and Spectral Reflectance of Inland Water.” Journal of Remote Sensing 4 (1): 41–45. doi:10.11834/jrs.20000108.
- Sun, Q., M. Li, and J. Lu. 2009. “The Estimation of Biochemical Oxygen Demand after Five Days Based on TM Image Data.” Remote Sensing for Land & Resources 80 (2): 82–86. doi:10.6046/gtzyyg.2009.02.17.
- Tian, Y., Z. Guo, Y. Qiao, X. Lei, and F. Xie. 2015. “Remote Sensing of Water Quality Monitoring in Guanting Reservoir.” Acta Ecologica Sinica 35 (7): 2217–2226. doi:10.5846/stxb201306071407.
- Wang, H., D. Zhao, L. Wang, and F. Huang. 2012. “Advance in Remote Sensing of Water Quality.” Marine Environmental Science 31 (2): 285–288. doi:10.3969/j.issn.1007-6336.2012.02.030.
- Wang, Q., Y. Yang, and C. Wu. 2009. “Study of Retrieving Models for Chlorophyll-A Concentration Based on HJ-1A HIS Image.” Spacecraft Engineering 18 (6): 133–137. doi:10.3969/j.issn.1673-8748.2009.06.022.
- Wang, X., Z. Wang, W. Yang, X. Xi, L. Shi, W. Dong, Q. Zhang, and Y. Zhou. 2014. “Shortage of Water Resources in China and Countermeasures.” Environmental Engineering 32 (7): 1–5. doi:10.13205/j.hjgc.201407001.
- Wang, Y., R. Ma, and Z. Deng. 2007. “Regionalized RS Estimation of Chlorophyll-a Concentration in Taihu Lake.” Journal of Hohai University(Natural Sciences) 35 (1): 86–91. doi:10.3321/j.issn:1000-1980.2007.01.021.
- Williamson, A. N., and W. E. Grabau. 1974. “Sediment Concentration Mapping in Tidal Estuaries.” Nasa Special Publication 351: 1347–1386.
- Wu, G. 2015. “Retrieval of Suspended Sediment Concentration in the Yangtze Estuary and Its Spatiotemporal Dynamics Analysis Based on GOCI Image Data.” Master Thesis, Chang’an University. doi:10.1128/AEM.03322-14.
- Wu, M., and X. Wang. 2005. “Application of Satellite MODIS in Monitoring the Water Quality of Lake Chaohu.” Journal of Lake Science 17 (2): 110–113. doi:10.3321/j.issn:1003-5427.2005.02.003.
- Xu, H. 2006. “Water Colour Variation Analysis of the Coastal Waters Surrounding Xiamen Island of SE China by Multispectral and Multitemporal Remote Sensing Measurements.” Acta Scientiae Circumstantiae 26 (7): 1209–1218. doi:10.3321/j.issn:0253-2468.2006.07.027.
- Xu, Y., Y. Shi, and Y. Li. 2014. “Eutrophication Evaluation Model of Lake Taihu Using Hyperspectral Data of HJ-1 Satellite.” Resources and Environment in the Yangtze Basin 23 (8): 1111–1118. doi:10.11870/cjlyzyyhj201408010.
- Xue, Y., Y. Zhou, W. Zhang, L. Zhou, and F. Liu. 2014. “Eutrophication Assessment of Dongting Lake in Summer Based on HJ-1 CCD Data.” Acta Scientiae Circumstantiae 34 (10): 2534–2539. doi:10.13671/j.hjkxxb.2014.0703.
- Yan, M. 2016. “The Study of Water Quality Inversion Model in Qinghe Reservior Based on Landsat-8 Image Satellite Data.” Master Thesis, Shenyang Agricultural University.
- Zhang, J., R. He, J. Qi, C. Liu, G. Wang, and J. Jin. 2013. “A New Perspective on Water Issues in North China.” Advances in Water Science 24 (3): 303–310. doi:10.14042/j.cnki.32.1309.2013.03.001.
- Zhang, X. 2014. “Trend of and the Governance System for Water Pollution in China.” China Soft Science, no. 10: 11–24. doi:10.3969/j.issn.1002-9753.2014.10.002.
- Zhou, D., and D. Wang. 2015. “Quantitative Estimation of Chlorophyll-a and Suspended Solids in Taihu Based on Landsat TM.” Environmental Science & Technology 38 (6P): 362–367. doi:10.3969/j.issn.1003-6504.2015.6P.075.
- Zhou, G., Q. Liu, R. Ma, and G. Tian. 2008. “Inversion of Chlorophyll-A Concentration in Turbid Water of Lake Taihu Based on Optimized Multi-Spectral Combination.” Journal of Lake Sciences 20 (2): 153–159. doi:10.18307/2008.0203.
- Zhou, L., R. Ma, H. Duan, G. Jiang, and L. Shang. 2011. “Remote Sensing Retrieval for Chlorophyll-a Concentration in Turbid Case Ⅱ Waters(Ⅰ): The Optimal Model.” Journal of Infrared and Millimeter Waves 30 (6): 531–536.
- Zhou, Y., W. Zhou, S. Wang, and B. Zhang. 2004. “Applications of Remote Sensing Techniques to Inland Water Quality Monitoring.” Advances In Water Science 15 (3): 312–317. doi:10.14042/j.cnki.32.1309.2004.03.009.
- Zhu, Y., L. Zhu, J. Li, Y. Chen, Y. Zhang, H. Hou, X. Ju, and Y. Zhang. 2016. “The Study of Inversion of Chlorophyll a in Taihu Based on GF-1 WFV Image and BP Neural Network.” Acta Scientiae Circumstantiae 37 (1): 1–12. doi:10.13671/j.hjkxxb.2016.0275.