
 ?Mathematical formulae have been encoded as MathML and are displayed in this HTML version using MathJax in order to improve their display. Uncheck the box to turn MathJax off. This feature requires Javascript. Click on a formula to zoom.
ABSTRACT
Introduction: The rapid development of economy has led to extensive raw material consumption and relevant environmental damage in China. To analyze environmental impacts and identify materials resulting in these environmental effects via raw material extraction, we combine economy-wide material flow accounting and life-cycle analysis methods to estimate environmental impacts of Chinese domestic extraction (DE) during the period of 1992–2015. The relationship between these increasing environmental impacts and Chinese GDP was also explored by decoupling analysis. Outcomes: Results show that Chinese DE increased by 372% during 1992–2015. The global warming potential, abiotic depletion potential, and respiratory inorganics of Chinese DE increased by 195%, 46%, and 408%, respectively. In terms of specific materials, extraction of iron ores, gravel and sand, and coal induced the most environmental impacts. The relationship between environmental impacts and Chinese GDP/DE was characterized by relative decoupling. Conclusion: To minimize the environmental impacts of extraction, we recommend that the Chinese government improve its extraction techniques and reduce excess demand for materials with large extraction such as iron ores, gravel and sand, and coal. We also recommend researching alternative materials for scarce resources like molybdenum, gold, and fluorite.
Introduction
With remarkable economic development, infrastructure construction, and population growth, China’s raw material consumption has increased many-fold during the twentieth century (Krausmann et al. Citation2009). Nearly one-third of global raw materials consumption comes from China at continuously increasing proportions (Wang et al. Citation2012). It is also worth noting that most materials consumed in China are exploited domestically (Ma et al. Citation2018; Schandl and West Citation2010). Accompanying these extracted resources are municipal solid waste (Geng Citation2012; Schandl and West Citation2012), carbon dioxide (CO2) emissions (Tian et al. Citation2011; Wang et al. Citation2018; Shen et al. Citation2014; Cao et al. Citation2016; Chen and Chen Citation2017), smog (Xie et al. Citation2016; Wu et al. Citation2017), and other environmental problems (Liang et al. Citation2014), all of which have become pertinent issues in China.
To accounting the resources used in one economy, the material flow analysis (MFA) method is usually used. MFA refers to the analysis of the throughput of process chains comprising the extraction or harvesting, chemical transformation, manufacturing, consumption, recycling, and disposal of materials (Bringezu and Moriguchi Citation2002). MFA facilitates tracking of similar material categories (Gao et al. Citation2016; Liu, Bangs, and Müller Citation2012; Chen and Graedel Citation2015; Chen et al. Citation2016; Yue et al. Citation2014, Citation2015) and analysis of bulk materials via economy-wide material flow accounting (EW-MFA) (Wang et al. Citation2012, Citation2018; Schandl et al. Citation2016; Schandl, Muller, and Moriguchi Citation2015; Wang et al. Citation2014).
During the last two decades, EW-MFA has become increasingly popular for quantifying material flows across economic and environmental systems (Fischer-Kowalski et al. Citation2011). It draws an analogy between materials’ weight and their environmental impacts. In most MFA studies, researchers have identified construction materials (e.g., sand and gravel), fossil fuels, and metallic minerals as having high proportions in material indicators, such as domestic extraction (DE) and domestic material consumption.
Although MFA has been used for more than 20 years, it possesses inherent disadvantages. First, weight is not a specific environmental indicator. When facing different environmental problems, using MFA alone and taking weight as the sole indicator to measure environmental impacts is unpersuasive (Giljum et al. Citation2011). Second, adding the weights of materials returns inaccurate and unreasonable findings because the environmental impacts of exploiting 1 kg of different materials vary (Van der Voet, Ven Oers, and Nikolic Citation2004). When adding material weights using a simple calculation, many key materials may be obscured within sand and gravels or other materials with high proportions (Van der Voet et al. Citation2005; De Bruyn et al. Citation2004). Therefore, scholars have questioned the scientific nature of this analogy (Zhang, Chen, and Ruth Citation2018; Xu and Zhang Citation2007; Fischer-Kowalski et al. Citation2011). It is crucial to quantify the severity of environmental impacts from raw material extraction to determine which forms of extraction have the greatest effects. It is similarly essential to analyze the relationships between these environmental impacts and Chinese economic development to inform China’s future environmental policy.
Life cycle analysis (LCA) is a common method of quantifying the environmental impacts of a specific product from cradle-to-gate. Indicators are arranged for different environmental impacts, such as global warming potential (GWP), abiotic depletion potential (ADP), and respiratory inorganics (RI) (Guinee et al. Citation2001; Jolliet et al. Citation2003). In this study, we combine MFA and LCA methods and transform the weight results from MFA to specific environmental impacts. We then obtain the real environmental impacts of the DE of Chinese raw materials and identify those materials most associated with environmental problems.
In recent years, most studies using LCA have focused on enterprise-level or factory-level data (Courtonne et al. Citation2015; Burchart-Korol, Korol, and Czaplicka-Kolarz Citation2016) to quantify the environmental impacts of a product’s manufacturing process (Bai et al. Citation2018; Liu et al. Citation2016; Yang et al. Citation2015). Little research has investigated a whole group of natural resources at a regional level (Lopes Silva et al. Citation2015) or national level (Costello, Xue, and Howarth Citation2015; Van der Voet, Ven Oers, and Nikolic Citation2004) to quantify their environmental impacts or upstream material flows in a social-economic system. A social-economic system involves hundreds of raw materials in the exploitation process and millions of products in the manufacturing process; it is nearly impossible to maintain a mass balance between material input and output and quantify the environmental impacts of all raw materials and products without double-counting. Hence, most studies have focused on a relatively simple system when building models, such as a school or city. National-level studies have generally addressed a specific kind of raw material or its subsequent product (Yang et al. Citation2017; Ding et al. Citation2017; Hong et al. Citation2017; Liu et al. Citation2018).
Although these national studies can facilitate simple comparisons of annual environmental impacts, they cannot compare the impacts of different materials throughout a year to determine key materials. Our study focuses on the exploitation process of 49 kinds of raw materials in China during 1992–2015 to quantify the environmental impacts of raw material extraction and identify those resulting in major environmental impacts.
In research similar to this study, Ester van der Voet’s work (Van der Voet, Ven Oers, and Nikolic Citation2004) involving the Netherlands played an important role in enlightening our methods. Because of the long life cycle of the study, the research did not involve all the raw materials; in this study, we are focusing on the environmental impacts of raw materials via the extraction process. In addition, a report from the International Resource Panel of UNEP (IRP Citation2017) assessed the environmental impacts of raw material extraction at a global level, but our research focuses on China specifically and employs Chinese LCA data. We also compared the growth of GDP, DE, and their environmental impacts using a decoupling method to quantify the relationship between these impacts and Chinese economic development. We then analyzed whether productivity improvement and resource structure adjustment in China benefited the environment and which materials should be prioritized for improvement and adjustment in the future.
The remainder of this paper is organized as follows. In Section 2, we introduce the materials investigated in this research and our corresponding adjustments according to the MFA and LCA methods. Section 3 presents the DE and environmental impacts of raw material exploitation in China from 1992 to 2015 and their decoupling conditions. Section 4 introduces findings from MFA, LCA, and decoupling analyses along with recommended environmental improvements for China. Section 5 offers conclusions along with answers to the three questions raised earlier.
Method and data
Goal and scope definition
In this study, we estimate the environmental impacts of Chinese raw material extraction during 1992–2015 by integrating MFA and LCA. Raw materials in the MFA method tend to be classified into three types: metallic minerals, non-metallic minerals, and fossil fuels. These materials are basic in society development, and their DE is large and increasing in China.
We selected 49 kinds of materials for analysis, the extractions of which were substantial and offered comprehensive records from China during 1992–2015. details these materials.
Table 1. List of raw materials included in this study
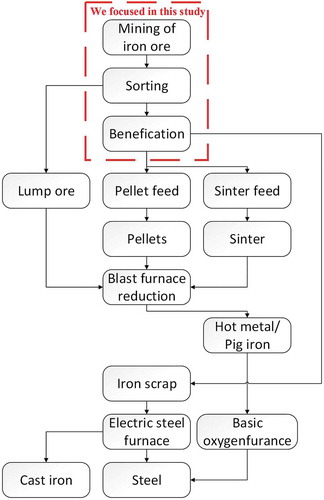
The study period spanned 1992–2015, and we built 24 independent models to simulate material extraction circumstances in China each year. The functional unit of each model was defined as the exploitation of raw materials in China for 1 year. The system boundary of metallic minerals is from ore’s mining to beneficiation and that of non-metallic minerals and fossil fuels is mining process only. shows the system boundary when we focus on iron ore’s exploitation process. Due to the limitation of LCA database and data collection, we focus more on the environmental impacts caused by human behavior. Hence, some environmental impacts like fugitive emissions of coalbed methane are not considered in this study. We examined the exploitation process in this way for two reasons:
If we had defined the processing scope from exploitation to production, it would have been difficult to consider all final products and maintain a mass balance between raw materials and products. The 49 selected raw materials have millions of final products.
We can easily classify environmental impacts among different industry sectors (i.e., different mining sectors of raw materials). Conclusions regarding mining sectors and drivers behind the environmental impacts of increasing consumption of these natural resources can thus be easily drawn.
Figure 1. The system boundary of iron ore (red dashed boxes) and the overview of iron and steel industry
We selected three environmental impact indicators from different LCA methodologies in this study, all of which are representative and popular in materials’ exploitation process and can be found from eFootprint, a LCA online system. GWP (Global Warming Potential, IPCC2013) is the most fundamental indicator when analyzing environmental problems. It is a measure of how much radiative forcing a greenhouse gas traps in the atmosphere up to a specific time horizon (Forster et al. Citation2007). This indicator also serves as an important standard in environmental quality assessment and police government. ADP (Abiotic Depletion Potential, CML2002) is a representative indicator when analyzing the scarcity of raw materials. It is a measure of the decrease of availability of the total reserve of potential functions of resources, and resource exhaustion is a popular topic in China (van Oers andGuinée Citation2016). RI (Respiratory Inorganics, IMPACT2002+) is a popular indicator to assess air quality and human health, and this indicator refers to respiratory effects, which are caused by inorganic substances (Humbert, Margni, and Jolliet Citation2005). We measured this indicator based on PM2.5, which is strongly related to smog problems in China.
DE of raw materials in China
The MFA method is a mature approach for characterizing material flows and stocks. In this study, we used MFA to collect and estimate the DE of raw materials in China following the Eurostat EW-MFA Guideline 2013 (Eurostat Citation2013). A brief introduction to our modifications follows; Supporting Information S1 and S2 offer more details.
The DE of some non-metallic minerals we collected was subdivided by use, and we merged these materials into one category. For example, we merged “sand and gravel used for fertilizer” and “sand and gravel used for building stone” into “sand and gravel.”
The DE of some non-metallic minerals was not recorded completely; DE was missing for some years and could not be estimated. We adjusted such DE according to the importance and quantity of materials. Non-metallic minerals with a negligible DE (less than 1% of the specific category) were ignored. For non-metallic minerals with considerable DE, we estimated the missing DE according to that of adjacent years and the output value of the nonmetal mining sector in specific years.
We adjusted the DE of “limestone used for cement,” “clay used for tile,” and “sand and gravel used for building” according to Chinese infrastructure construction circumstances.
LCA of material extraction in China
In this study, the life cycle inventory and background data of a specific material were taken from eco-invent and the CLCD database provided by eFootprint (Liu, He, and Hou Citation2010; Liu, Wang, and Chen Citation2010). All materials in the MFA method and LCA database were consistent. The environmental impacts of material extraction in China were calculated according to the following equation:
where is the m-type environmental impact of material extraction in the ith year.
is the DE of material j in the ith year, and
is the m-type environmental impact of exploiting per ton of material j. In this study, LCA data from eFootprint only provided 2014 as the reference year; hence, we did not distinguish the I with different years. In addition, most LCA data were taken from CLCD and took China as the origin of production to ensure I depicted the average technology level in China.
We also made some adjustments to remain consistent with specific materials in the MFA and LCA methods. Metallic minerals in DE considered using the MFA method consisted of primary minerals, whereas most metallic minerals in the LCA database were concentrated minerals. We estimated the DE of concentrated metallic minerals by adjusting the DE of primary metallic minerals with the ore grade of primary and concentrated metallic minerals (Supporting Information S3). In addition, LCA data of some non-metallic minerals were unavailable in eco-invent or the CLCD database (IKE Citation2017). We replaced these LCA data with those of limestone exploitation.
Decoupling analysis of material extraction in China
According to environmental impacts calculated by the combined MFA and LCA methods, we compared the relationships among GDP, DE, and environmental impacts of material exploitation using decoupling analysis and the following formula (Wang et al. Citation2013):
When comparing DE/environmental impacts with GDP in China during 1992–2015, Dr is the decoupling indicator for material extraction or their environmental impacts; t is the growth rate of DE or environmental impacts per unit of GDP; and g is the GDP growth rate. When comparing environmental impacts with DE to analyze Chinese resource structure adjustment, Dr denotes the decoupling indicator for the environmental impacts of material extraction, where t is the growth rate of environmental impacts per unit of DE and g is the growth rate of DE.
We analyzed the conditions of productivity improvement and resource structure adjustment in China according to the value of Dr and evaluated it at three levels: absolute decoupling, relative decoupling, and non-decoupling (see ). Absolute decoupling indicates that the environmental impacts or resource use remain constant or decrease when GDP grows. Relative decoupling indicates that the environmental impacts or resource use increase with a lower rate than GDP. Non-decoupling means that the environmental impacts or resource use increase with the same rate or higher rate than GDP.
Data preparation
In our study, historical data (1992–2012) for material DE were sourced and updated according to a related reference (Wang et al. Citation2018). Main databases included China Land & Resources Almanac (Ministry of Land and Resources of China Citation1999–2016) for metallic minerals and non-metallic minerals and China Energy Statistical Yearbook (Editing Committee of China Energy Statistical Yearbook Citation1993–2016) for fossil fuels. The ore grades of primary and concentrated metallic minerals used to adjust the DE of metallic minerals were sourced from China Steel Yearbook (Editing Committee of China Steel Industry Yearbook Citation2014–2015), China Nonferrous Metals Industry Yearbook (Editing Committee of China Nonferrous Metal Industry Yearbook Citation1993–2015), and related references (Ma et al. Citation2016; Zhang, Yang, and Wang Citation2015). The converted coefficient and estimate rule used to adjust the DE of non-metallic minerals was sourced from Economy-Wide Material Flow Accounts and Derived Indicators (Eurostat Citation2013). Eco-invent and the CLCD database were sourced from IKE Environmental Technology Company Limited’s eFootprint online system (Liu, Wang, and Chen Citation2010; Liu, He, and Hou Citation2010; IKE Citation2017; Frischknecht et al. Citation2005). GDP was sourced from China Statistical Yearbook and adjusted to reflect the constant price in 1992 (National Bureau of Statistics of China Citation1993–2016).
Results
Overview of material extraction
We used EW-MFA to calculate DE of non-metallic minerals, metallic minerals, and fossil fuels in China during 1992–2015. Then, we used LCA to calculate the environmental impacts (GWP, ADP, RI) of exploitation of these materials in China during the same time.
shows the DE and environmental impacts of raw material exploitation in China during 1992–2015. Main conclusions from these results are listed in . Chinese DE increased by 372% from 6.3 billion tons in 1992 to 30 billion tons in 2015 at an average annual growth rate of 7.5%. With regard to specific material categories, non-metallic minerals were the main contributor to material extraction, contributing 80% (24billion tons) of Chinese DE in 2015 and approximately 82% (19 billion tons) of the DE increase during 1992–2015. Fossil fuels, as the second contributor, contributed 14% (4.1 billion tons) of Chinese DE and approximately 12% (2.8 billion tons) of increase. Metallic mineral extraction was fastest in terms of the DE increase, growing by 467% during 1992–2015, whereas non-metallic minerals increased by 408% over the same time.
Table 2. Levels of decoupling analysis according to the value of decoupling indicators (Dr)
Table 3. Domestic Extraction (DE) and environmental impacts of raw materials exploited in China
Figure 2. Domestic extraction (DE) and environmental impacts of raw materials exploited in China, 1992–2015
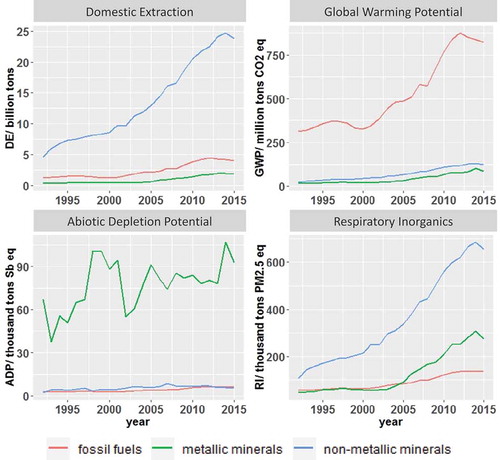
GWP results differed from those of DE; the GWP of Chinese DE only increased by 195% during the study period. As the main contributor of GWP, fossil fuels contributed 80% (820 million tons CO2 eq) and 75% (500 million tons CO2 eq) of Chinese GWP in 2015 and total GWP increase during 1992–2015, respectively. Non-metallic minerals were the second contributor, accounting for 12% (120 million tons CO2 eq) of Chinese GWP and approximately 15% (100 million tons CO2 eq) of the total GWP increase.
ADP results showed an increasing trend of instability, different from the smooth increases in DE, GWP, and RI. The ADP of China’s DE increased by only 46% from 72,000 tons Sb eq in 1992 to 100 thousand tons Sb eq in 2015, with an average annual growth rate of 2.3%. Metallic minerals were a major contributor to ADP from a specific material category viewpoint, contributing 89% (93 thousand tons Sb eq) of China’s ADP in 2015 for a total approximate increase of 79% (26 thousand tons Sb eq) during 1992–2015. As a second contributor, fossil fuels accounted for only 5.8% (6 thousand tons Sb eq) of China’s ADP and approximately 11% (4.1 thousand tons Sb eq) of the total ADP increase.
RI results exhibited a similar tendency as those of Chinese DE, although the growth rate was higher than that of DE, increasing by 408% from 210 thousand tons PM2.5 eq to 1 million tons PM2.5 eq over the 1992–2015 period. Non-metallic minerals contributed most to RI: 61% in 2015 (6.6 million tons PM2.5 eq) for a 64% increase overall (550 thousand tons PM2.5 eq). As a second contributor, metallic minerals contributed only 26% (280 thousand tons PM2.5 eq) of China’s RI for a 27% increase (230 thousand tons PM2.5 eq).
A comparison of these results indicates that RI grew at the fastest rate, increasing by 408%, whereas ADP grew at the slowest rate with a mere 46% increase. In addition, different types of materials dominated the growth of different environmental impacts.
Environmental impacts of material extraction
We compared 49 materials based on DE and environmental impacts to determine which materials resulted in major environmental impacts. presents the DE and environmental impacts contribution of specific materials exploited in China during 1992–2015. Taking 2015 as an example, we also determined the top 10 materials in terms of DE, GWP, ADP, and RI ().
Table 4. Top 10 materials for Domestic Extraction (DE), Global Warming Potential (GWP), Abiotic Depletion Potential (ADP), and Respiratory Inorganics (RI) in China, 2015
Figure 3. Domestic extraction (DE) and environmental impacts contributions of specific materials exploited in China, 1992–2015
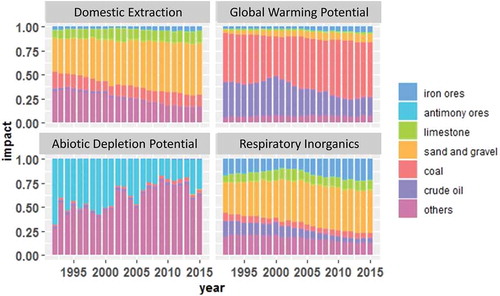
In terms of DE, sand and gravel, limestone, and coal were the top three contributing 55%, 13%, and 13% of DE in 2015, respectively. Crude oil and iron ores were other major materials with high DE in this study. The similarities of these materials included their continuous growth in DE during 1992–2015. At the same time, the proportion of clays reduced from 28% to 10%; that of sand and gravel increased from 36% to 55%.
As for the top three contributors to GWP, coal, crude oil, and sand and gravel contributed 57%, 19%, and 8% in 2015, respectively. Iron ores, natural gas liquids, limestone, and gypsum were other materials that caused high GWP, contributing 11% in 2015. Among these six materials, four ranked within the top five for DE, and three were fossil fuels. Coal, as the top contributor to GWP, also met these two conditions. During 1992–2015, the proportion of crude oil declined by half from 38% to 19% while that of coal increased from 50% to 57%.
Antimony ores were the top contributor to ADP, accounting for 30.58% in 2015. Gold and tungsten ores also dominated ADP, contributing 17% and 9% in 2015, respectively. Except for fluorite and coal, which respectively ranked eighth and ninth on ADP, eight of the top 10 materials were non-ferrous metal ores; these contributed 88.98% of ADP collectively. The proportion of antimony reduced by half from 68% to 31% and that of gold increased from 9% to 17%.
For RI, sand and gravel, iron ores, and limestone and gypsum were the top three contributing 44%, 22%, and 11% in 2015, respectively. The materials behind them were fossil fuels, namely coal, crude oil, and natural gas liquids. Materials ranking in the top six for GWP also ranked in the top six for RI; however, fossil fuels contributed only 12% of RI but 78% of GWP. During 1992–2015, the proportion of crude oil declined rapidly from 17% to 5% and that of clay decreased from 8% to 3%.
Decoupling analysis of material extraction
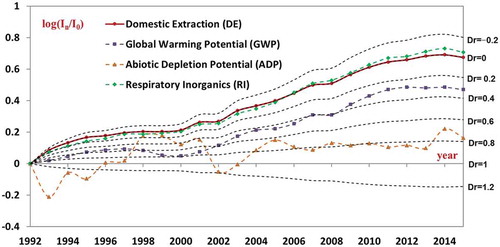
illustrates the results of decoupling analysis of Chinese DE and environmental impacts based on GDP during 1992–2015. We took 1992 as the reference year and determined four kinds of Dr as standard DE, GWP, ADP, and RI, respectively.
Figure 4. Decoupling analysis of DE/environmental impacts and GDP in China, 1992–2015
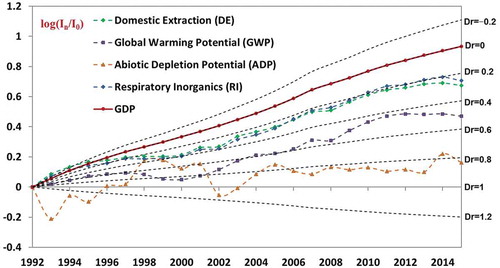
Results show that the decoupling condition of Chinese DE and environmental impacts with GDP tended toward relative decoupling during 1992–2015. This increasing tendency was partly driven by growing GDP and Chinese productivity, which partly impeded environmental degradation. The condition of DE in 1993 was non-decoupling, but the condition improved rapidly during 1993–2000 and then stabilized at relative decoupling when Dr reached approximately 0.3. The conditions of GWP and RI remained at relative decoupling during 1992–2015, and their conditions were steady when Dr were approximately 0.2 and 0.5. However, ADP exhibited an unstable tendency in relative decoupling in 1993–2015. An unstable increasing or decreasing tendency characterized ADP in 1993–2005. Dr declined rapidly from 3.7 to 0.4 during 1993–1998, increased rapidly to 1.1 in 2002, and then fell to 0.7 in 2005.
According to these results, Chinese DE and the environmental impacts of material extraction during 1992–2015 were partly driven by increasing GDP in China. Compared to these four indicators, increases in DE and RI exhibited the closest relationship with GDP, whereas patterns of ADP had a weaker relationship; thus, the decoupling condition of environmental impacts was generally better than that of DE.
Results of decoupling analysis on the extraction of Chinese materials and corresponding environmental impacts with DE are shown in . Based on resource structure optimization in China, and if the Chinese resource structure never changed, DE and the environmental impacts would increase simultaneously where the value of Dr was close to 0. The decoupling condition of the environmental impacts with DE tended toward relative decoupling during 1992–2015. In other words, Chinese resource structure adjustment impeded increases in environmental impacts, the rate of which increased more slowly compared to DE. The condition of RI reflected relative decoupling during 1992–2015, and conditions were steady when Dr was approximately 0.3. However, the condition of ADP indicated an unstable tendency of absolute decoupling in 1993–1995 and relative decoupling in 1996–2015. An unstable increasing or declining tendency of ADP manifested in 1993–2005, when the Dr decreased rapidly from 2.8 to 0.1 during 1993–1999 and rapidly increased to 1.2 in 2002 before falling to 0.6 in 2005. The condition of RI reflected non-decoupling during 2006–2015, but the value of Dr was close to 0.
Figure 5. Decoupling analysis of DE and environmental impacts in China, 1992–2015
These results indicate that Chinese environmental impacts of material extraction during 1992–2015 were partly driven by increasing DE; furthermore, the relationship with DE was closer than that with GDP. Compared with these three indicators, the increasing tendency of RI was most closely associated with DE, whereas the tendency of ADP indicated a weak relationship.
Discussion
Material rank by environmental impacts
The key point of our study was to combine the LCA and MFA methods to identify materials with high environmental impacts. The following question is to be answered: which kind of the materials have the largest environmental impacts?
From the DE viewpoint, sand and gravel, dominated China’s DE by more than 50%. Fossil fuels constituted the largest proportion of GWP, because extracting fossil fuels per kg (especially crude oil) generated more greenhouse gases than others did. Regarding ADP, eight of the top 10 materials in ADP were non-ferrous metal ores, contributing 88% of ADP. In comparison, non-ferrous metal ores only contributed 2% of DE in 2015, explaining why the increasing tendency of ADP was much different from that of GWP, RI, or DE. The results of RI were similar to those of DE, and high-DE materials also dominated RI.
compares the rankings of DE and GWP, ADP, and RI. The x-axis shows DE ranking, and the y-axis shows the three kinds of environmental impacts. The 49 points reflect the materials in our study. The diagonal line presents the same ranking of DE and environmental impacts. If combining the LCA method changes DE results, then the diagonal line and its vicinity indicate a concentrated point distribution.
Figure 6. Ranking comparison of domestic extraction (DE), global warming potential (GWP), abiotic depletion potential (ADP), and respiratory inorganics (RI) in China, 2015
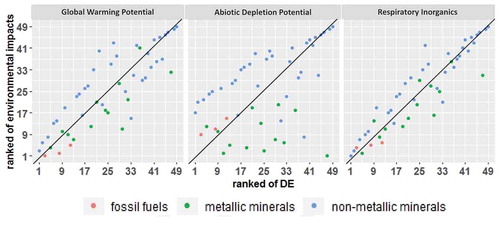
Results show many points far from the diagonal line, representing materials we sought to identify. For example, molybdenum ores ranked 45th in DE but eighth in GWP. Antimony ores ranked 47th in DE but first in ADP. Rare earth ranked 37th in DE but eighth in RI. Findings also suggest that most points of non-ferrous metal ores were below the diagonal line, whereas those of most non-metallic minerals were often above it; hence, the environmental impacts of most non-ferrous metal ores appeared undervalued with smaller extraction, and the impacts of most non-metallic minerals were overvalued.
We summarize the following advantages of combining MFA and LCA methods:
Results were more persuasive and specific. GWP, ADP, and RI represented specific environmental impacts, but DE did not. By combining the LCA method, we can select different impact indicators to analyze various environmental problems.
By combining the LCA method, we determined materials with high environmental impacts that were not previously discovered, such as crude oil, natural gas liquids, antimony ores, and gold ores.
By combining the LCA method, we can scientifically adjust the MFA results. Sand and gravel were found to be major contributors to DE, and they are also important to GWP and RI, but their proportions declined. Non-ferrous metal ores were not important in MFA, but regarding environmental impacts, their proportion increased drastically.
Study limitations
Due to LCA database limitations, we could not collect all the coefficients of environmental impacts for the extraction of materials in China. We, therefore, used the coefficients of some materials for other countries. This adjustment could influence the accuracy of our results, especially for ADP, which was calculated based on the extraction rate and ultimate reserve of materials in the reference country.
We studied the environmental impacts of a long-term sequence during 1992–2015, but the LCA data in our study represented extraction technology in 2014. Hence, we might underestimate environmental impacts during 1992–2013 and overestimated it in 2015 when using a single year data to represent all years. To reduce this error, we adjusted the DE of metallic minerals according to the ore grade each year, but this is only one part of error reduction (Mudd Citation2007).
We also faced the problem of double-counting when adding the environmental impacts of all materials together to represent material extraction in China because some materials could influence other materials’ exploitation process (Dente et al. Citation2018). For example, the exploitation of some materials requires an electric power supply, and electricity generation requires coal. The environmental impacts of material extraction thus include part of the impact of coal used to generate electricity. When adding the impacts of a given material and that of coal, the contribution of coal would be double-counted.
Conclusion
In this study, we estimate the Chinese DE of metallic minerals, non-metallic minerals, and fossil fuels during 1992–2015 using MFA to determine specific materials with high extraction. To address the weaknesses of MFA (its indicators are too aggregated to hide different environmental impacts of different material flows), we estimated three environmental impacts associated with China’s DE (GWP, ADP, and RI) by combining MFA with LCA to determine which materials induced major environmental impacts but were not high in DE. Finally, we analyze the relationship among DE, environmental impacts, and GDP using decoupling analysis.
The main results are as follows:
Chinese DE increased by 372% from 6.3 billion tons to 30 billion tons during 1992–2015. At the same time, the GWP of Chinese DE increased by 195% from 350 million tons CO2 eq to 1 billion tons CO2 eq, ADP increased by 46% from 72 thousand tons Sb eq to 100 thousand tons Sb eq, and RI increased by 408% from 210 thousand tons PM2.5 eq to 1.1 million tons PM2.5 eq during 1992–2015.
Regarding material categories, non-metallic minerals comprised the largest contributor (80%) to the increment of DE; fossil fuels contributed most (75%) to the increment of GWP; metallic minerals contributed most (79%) to the increment of ADP; and non-metallic minerals was the biggest contributor (64%) to the increment of RI.
From a specific material viewpoint, sand and gravel was the biggest contributor (55%) to the increment of DE; coal contributed most (57%) to the increment of GWP; antimony ores contributed most (31%) to the increment of ADP; and sand and gravel contributed most (44%) to the increment of RI.
The decoupling condition of DE and environmental impacts with GDP reflected relative decoupling, and the decoupling condition of environmental impacts was better than that of DE. The decoupling condition of environmental impacts with DE was also relative decoupling in general.
By discussing the results of DE and environmental impacts, we discovered that some materials (sand and gravel, iron ores) contributing high environmental impacts also contributed high DE. They were basic materials in society as revealed elsewhere. Hence, improving extraction techniques and reducing excess demand for these materials are optimal means of minimizing the environmental impacts of the increment of extraction in terms of production and consumption. On the other hand, some materials (molybdenum, gold and fluorite) with high environmental impacts were not high-DE materials; they were scarce as indicated by our results. Hence, the sustainable use for these materials should be paid more attention.
Supplemental Material
Download MS Word (936.1 KB)Acknowledgments
This research was supported by the National Natural Science Foundation of China (41871204, 41401636, and 51474067) and Fundamental Research Funds for the Central Universities (N172504026). Wei-Qiang Chen acknowledges financial support from the CAS Pioneer Hundred Talent Program. Feng Shi acknowledges financial support from the Taishan Scholar Program of Shandong Province, China. We also appreciate the efforts of the editor and anonymous reviewers.
Disclosure statement
No potential conflict of interest was reported by the authors.
Supplementary material
Supplemental data for this article can be accessed here.
Additional information
Funding
Related Research Data
References
- Bai, S., X. Zhu, X. Wang, and N. Ren. 2018. “Identify Stakeholders’ Understandings of Life Cycle Assessment Results on Wastewater Related Issues.” Science of the Total Environment 622: 869–874. doi:10.1016/j.scitotenv.2017.12.034.
- Bringezu, S., and Y. Moriguchi. 2002. “Material flow Analysis.” In A Handbook of Industrial Ecology, edited by R. U. Ayres, and L. Ayres, 79–90. Cheltenham, UK: Edward Elgar Publishers.
- Burchart-Korol, D., J. Korol, and K. Czaplicka-Kolarz. 2016. “Life Cycle Assessment of Heat Production from Underground Coal Gasification.” International Journal of Life Cycle Assessment 21 (10): 1391–1403. doi:10.1007/s11367-016-1102-0.
- Cao, Z., L. Shen, L. Liu, and S. Zhong. 2016. “Analysis on Major Drivers of Cement Consumption during the Urbanization Process in China.” Journal of Cleaner Production 133: 304–313. doi:10.1016/j.jclepro.2016.05.130.
- Chen, S., and B. Chen. 2017. “Changing Urban Carbon Metabolism over Time: Historical Trajectory and Future Pathway.” Environmental Science & Technology 51 (13): 7560–7571. doi:10.1021/acs.est.7b01694.
- Chen, W.-Q., and T. E. Graedel. 2015. “In-Use Product Stocks Link Manufactured Capital to Natural Capital.” Proceedings of the National Academy of Sciences of the United States of America 112 (20): 6265–6270. doi:10.1073/pnas.1406866112.
- Costello, C., X. Xue, and R. W. Howarth. 2015. “Comparison of Production-Phase Environmental Impact Metrics Derived at the Farm- and National-Scale for United States Agricultural Commodities.” Environmental Research Letters 10 (11). doi:10.1088/1748-9326/10/11/114004.
- Courtonne, J.-Y., J. Alapetite, P.-Y. Longaretti, D. Dupre, and E. Prados. 2015. “Downscaling Material Flow Analysis: The Case of the Cereal Supply Chain in France.” Ecological Economics 118: 67–80. doi:10.1016/j.ecolecon.2015.07.007.
- De Bruyn, S., M. Sevenster, G. Warringa, E. Van der Voet, and V. O. Lauran 2004. Economy-Wide Material Flows and Environmental Policy. An Analysis of Indicators and Policy Uses for Economy-Wide Material Flow Policy. The Netherlands: Ministry of Housing.
- Dente, S. M. R., C. Aoki-Suzuki, D. Tanaka, and S. Hashimoto. 2018. “Revealing the Life Cycle Greenhouse Gas Emissions of Materials: The Japanese Case.” Resources, Conservation and Recycling 133: 395–403. doi:10.1016/j.resconrec.2017.12.011.
- Ding, N., J. Liu, J. Yang, and D. Yang. 2017. “Comparative Life Cycle Assessment of Regional Electricity Supplies in China.” Resources Conservation and Recycling 119: 47–59. doi:10.1016/j.resconrec.2016.07.010.
- Editing Committee of China Energy Statistical Yearbook, eds. 1993–2016. China Energy Statistical Yearbooks 19932-2015. Beijing: China Statistics Press.
- Editing Committee of China Nonferrous Metal Industry Yearbook. eds. 1993–2015. China Nonferrous Metal Industry Yearbooks 1992-2014. Beijing: China Statistics Press.
- Editing Committee of China Steel Industry Yearbook, eds. 2014–2015. China Steel Industry Yearbooks 2013-2014. Beijing: China Statistics Press.
- Eurostat. 2013. Economy-Wide Material Flow Accounts (EW-MFA). Compilation Guide 2013. Luxembourg: EUROSTAT Office.
- Fischer-Kowalski, M., F. Krausmann, S. Giljum, S. Lutter, A. Mayer, S. Bringezu, Y. Moriguchi, H. Schütz, H. Schandl, and H. Weisz. 2011. “Methodology and Indicators of Economy-Wide Material Flow Accounting.” Journal of Industrial Ecology 15 (6): 855–876. doi:10.1111/j.1530-9290.2011.00366.x.
- Forster, P., V. Ramaswamy, P. Artaxo, T. Berntsen, R. Betts, D. W. Fahey, J. Haywood, et al. 2007. “Changes in Atmospheric Constituents and in Radiative Forcing.” In Climate Change 2007: The Physical Science Basis. Contribution of Working Group I to the Fourth Assessment Report of the Intergovernmental Panel on Climate Change, edited by S. Solomon, D. Qin, M. Manning, Z. Chen, M. Marquis, K.B. Averyt, M. Tignor, and H.L. Miller. Cambridge, UK and New York, NY: Cambridge University Press.
- Frischknecht, Rolf, Hans J. Niels JungbluthGabor Doka Althaus, Roberto Dones, Thomas Heck, Stefanie Hellweg, R Hischier, T Nemecek, G Rebitzer, M Spielmann. 2005. “The Ecoinvent Database: Overview and Methodological Framework.” International Journal of Life Cycle Assessment 10 (1): 3–9. doi:10.1065/lca2004.10.181.1.
- Gao, T., L. Shen, M. Shen, L. Liu, and F. Chen. 2016. “Analysis of Material Flow and Consumption in Cement Production Process.” Journal of Cleaner Production 112: 553–565. doi:10.1016/j.jclepro.2015.08.054.
- Geng, Y. 2012. “Toward Safe Treatment of Municipal Solid Wastes in China’s Urban Areas.” Environmental Science & Technology 46 (13): 7067–7068. doi:10.1021/es3022446.
- Giljum, S., E. Burger, F. Hinterberger, S. Lutter, and M. Bruckner. 2011. “A Comprehensive Set of Resource Use Indicators from the Micro to the Macro Level.” Resources Conservation and Recycling 55 (3): 300–308. doi:10.1016/j.resconrec.2010.09.009.
- Guinee, J. B., M. Gorree, R. Heijungs, G. Huppes, R. Kleijn, A. De Koning, and V. O. Lauran. 2001. “Handbook on Life Cycle Assessment - Operational Guide to the ISO Standards.” International Journal of Life Cycle Assessment 6 (5): 255. doi:10.1007/bf02978784.
- Hong, J., Y. Chen, J. Liu, M. Xiaotian, Q. Congcong, and Y. Liping. 2017. “Life Cycle Assessment of Copper Production: A Case Study in China.” The International Journal of Life Cycle Assessment. doi:10.1007/s11367-017-1405-9.
- Humbert, S., M. Margni, and O. Jolliet. 2005. IMPACT 2002+ User Guide: Draft for Versiono 2.1. Switzerland: The Swiss FederalInstitute of Technology Lausanne (EPFL).
- IKE. 2017. “Chinese Life Cycle Database – CLCD.” July 6. http://www.ike-global.com/archives/1094.html
- IRP. 2017. “Assessing Global Resource Use: A Systems Approach to Resource Efficiency and Pollution Reduction”. In A Report of the International Resource Panel. United Nations Environment Programme, edited by S. Bringezu, A. Ramaswami, H. Schandl, M. O’Brien, R. Pelton, J. Acquatella, E. Ayuk, et al. Nairobi, Kenya: United Nations Environment Programme.
- Jolliet, O., M. Margni, R. Charles, S. Humbert, J. Payet, G. Rebitzer, and R. K. Rosenbaum. 2003. “IMPACT 2002+: A New Life Cycle IMPACT Assessment Methodology.” International Journal of Life Cycle Assessment 8 (6): 324–330. doi:10.1007/bf02978505.
- Krausmann, F., S. Gingrich, N. Eisenmenger, K.-H. Erb, H. Haberl, and M. Fischer-Kowalski. 2009. “Growth in Global Materials Use, GDP and Population during the 20th Century.” Ecological Economics 68 (10): 2696–2705. doi:10.1016/j.ecolecon.2009.05.007.
- Liang, S., Z. Liu, D. Crawford-Brown, Y. Wang, and X. Ming. 2014. “Decoupling Analysis and Socioeconomic Drivers of Environmental Pressure in China.” Environmental Science & Technology 48 (2): 1103–1113. doi:10.1021/es4042429.
- Liu, G., C. E. Bangs, and D. B. Müller. 2012. “Stock Dynamics and Emission Pathways of the Global Aluminium Cycle.” Nature Climate Change 3 (4): 338–342. doi:10.1038/nclimate1698.
- Liu, J., D. Yang, L. Bin, and J. Zhang. 2016. “Carbon Footprint of Laptops for Export from China: Empirical Results and Policy Implications.” Journal of Cleaner Production 113: 674–680. doi:10.1016/j.jclepro.2015.11.026.
- Liu, S., X. Tian, W. Cai, W.-Q. Chen, and Y. Wang. 2018. “How the Transitions in Iron and Steel and Construction Material Industries Impact China’s CO 2 Emissions: Comprehensive Analysis from an Inter-Sector Linked Perspective.” Applied Energy 211: 64–75. doi:10.1016/j.apenergy.2017.11.040.
- Liu, X., H. Qin, and P. Hou. 2010. “Research on the Establishment Method of China Life Cycle Basic Database.” Science & Technology Information 3: 7. doi:10.16661/j.cnki.1672-3791.2010.03.006.
- Liu, X., H. Wang, and J. Chen. 2010. “Method and Basic Model for Development of Chinese Reference Life Cycle Database of Fundamental Industries.” Acta Scientiae Circumstantiae 30 (10): 2136–2144. doi:10.13671/j.hjkxxb.2010.10.028.
- Ma, F., H. Wang, B. Zhu, D. Chen, H. Dai, J. Wang, S. Zhao, et al. 2018. “Material Footprint of a Fast-Industrializing Region in China, Part 1: Exploring the Materialization Process of Liaoning Province.” Resources, Conservation and Recycling 134 :228–238. doi:10.1016/j.resconrec.2018.03.015.
- Ma, Y., L. Na, Q. Wang, and Q. Yang. 2016. “The Characteristics and Development Status of Rare Earth Resources in Baiyunobo.” Journal of the Chinese Society of Rare Earth 34 (6): 641–649.
- Ministry of Land and Resources of China. 1999-2016. China Land and Resources Statistical Yearbooks 1998-2015. Beijing: China Geology Press.
- Mudd, G. M. 2007. “An Analysis of Historic Production Trends in Australian Base Metal Mining.” Ore Geology Reviews 32 (1–2): 227–261. doi:10.1016/j.oregeorev.2006.05.005.
- National Bureau of Statistics of China. 1993-2016. China Statistical Yearbook 1992-2015. Beijing, China: China Statistics Press.
- Schandl, H., D. B. Muller, and Y. Moriguchi. 2015. “Socioeconomic Metabolism Takes the Stage in the International Environmental Policy Debate: A Special Issue to Review Research Progress and Policy Impacts.” Journal of Industrial Ecology 19 (5): 689–694. doi:10.1111/jiec.12357.
- Schandl, H., and J. West. 2010. “Resource Use and Resource Efficiency in the Asia-Pacific Region.” Global Environmental Change-Human and Policy Dimensions 20 (4): 636–647. doi:10.1016/j.gloenvcha.2010.06.003.
- Schandl, H., and J. West. 2012. “Material Flows and Material Productivity in China, Australia, and Japan.” Journal of Industrial Ecology 16 (3): 352–364. doi:10.1111/j.1530-9290.2011.00420.x.
- Schandl, H., S. Hatfield-Dodds, T. Wiedmann, A. Geschke, Y. Cai, J. West, D. Newth, T. Baynes, M. Lenzen, and A. Owen. 2016. “Decoupling Global Environmental Pressure and Economic Growth: Scenarios for Energy Use, Materials Use and Carbon Emissions.” Journal of Cleaner Production 132: 45–56. doi:10.1016/j.jclepro.2015.06.100.
- Shen, L., T. Gao, J. Zhao, L. Wang, L. Wang, L. Liu, F. Chen, and J. Xue. 2014. “Factory-Level Measurements on CO2 Emission Factors of Cement Production in China.” Renewable and Sustainable Energy Reviews 34: 337–349. doi:10.1016/j.rser.2014.03.025.
- Silva, L., D. Aparecido, J. A. de Oliveira, Y. M. B. Saavedra, A. R. Ometto, J. R. I Pons, and X. G. Durany. 2015. “Combined MFA and LCA Approach to Evaluate the Metabolism of Service Polygons: A Case Study on A University Campus.” Resources Conservation and Recycling 94: 157–168. doi:10.1016/j.resconrec.2014.11.001.
- Tian, X., H. Imura, M. Chang, F. Shi, and H. Tanikawa. 2011. “Analysis of Driving Forces behind Diversified Carbon Dioxide Emission Patterns in Regions of the Mainland of China.” Frontiers of Environmental Science & Engineering in China 5 (3): 445–458. doi:10.1007/s11783-011-0330-6.
- Van der Voet, E., L. Van Oers, S. Moll, H. Schütz, S. Bringezu, S. de Bruyn, M. Sevenster, and G. Warringa. 2005. Policy Review on Decoupling: Development of Indicators to Assess Decoupling of Economic Development and Environmental Pressure in the EU25 and AC3 Countries. Leiden, The Netherlands, CML report 166, Department Industrial Ecology
- Van der Voet, E., L. V. Oers, and I. Nikolic. 2004. “Dematerialization: Not Just a Matter of Weight.” Journal of Industrial Ecology 8 (4): 121–137. doi:10.1162/1088198043630432.
- van Oers, L., and J. Guinée. 2016. “The Abiotic Depletion Potential: Background Updates, and Future.” Resources 5 (16): 1–12.
- Wang, H., H. Dai, L. Dong, Y. Xie, Y. Geng, Q. Yue, M. Fengmei, J. Wang, and D. Tao. 2018. “Co-Benefit of Carbon Mitigation on Resource Use in China.” Journal of Cleaner Production 174: 1096–1113. doi:10.1016/j.jclepro.2017.11.070.
- Wang, H., S. Hashimoto, Q. Yue, Y. Moriguchi, and L. Zhongwu. 2013. “Decoupling Analysis of Four Selected Countries.” Journal of Industrial Ecology 17 (4): 618–629. doi:10.1111/jiec.12005.
- Wang, H., S. Hashimoto, Y. Moriguchi, Q. Yue, and L. Zhongwu. 2012. “Resource Use in Growing China past Trends, Influence Factors, and Future Demand.” Journal of Industrial Ecology 16 (4): 481–492. doi:10.1111/j.1530-9290.2012.00484.x.
- Wang, H., X. Tian, H. Tanikawa, M. Chang, S. Hashimoto, Y. Moriguchi, and L. Zhongwu. 2014. “Exploring China’s Materialization Process with Economic Transition: Analysis of Raw Material Consumption and Its Socioeconomic Drivers.” Environmental Science & Technology 48 (9): 5025–5032. doi:10.1021/es405812w.
- Wei-Qiang., C., T. E. Graedel, P. Nuss, and H. Ohno. 2016. “Building the Material Flow Networks of Aluminum in the 2007 U.S. Economy.” Environmental Science & Technology 50 (7): 3905–3912. doi:10.1021/acs.est.5b05095.
- Wu, R., H. Dai, Y. Geng, Y. Xie, T. Masui, Z. Liu, and Y. Qian. 2017. “Economic Impacts from PM2.5 Pollution-Related Health Effects: A Case Study in Shanghai.” Environmental Science & Technology 51 (9): 5035–5042. doi:10.1021/acs.est.7b00026.
- Xie, Y., H. Dai, H. Dong, T. Hanaoka, and T. Masui. 2016. “Economic Impacts from PM2.5 Pollution-Related Health Effects in China: A Provincial-Level Analysis.” Environmental Science & Technology 50 (9): 4836–4843. doi:10.1021/acs.est.5b05576.
- Xu, M., and T. Zhang. 2007. “Material Flows and Economic Growth in Developing China.” Journal of Industrial Ecology 11 (1): 121–140. doi:10.1162/jiec.2007.1105.
- Yang, D., J. Liu, J. Yang, and N. Ding. 2015. “Life-Cycle Assessment of China’s Multi-Crystalline Silicon Photovoltaic Modules considering International Trade.” Journal of Cleaner Production 94: 35–45. doi:10.1016/j.jclepro.2015.02.003.
- Yang, D., L. Fan, F. Shi, Q. Liu, and Y. Wang. 2017. “Comparative Study of Cement Manufacturing with Different Strength Grades Using the Coupled LCA and Partial LCC methods-A Case Study in China.” Resources Conservation and Recycling 119: 60–68. doi:10.1016/j.resconrec.2016.06.017.
- Yue, Q., H. Wang, C. Gao, D. Tao, L. Liu, and L. Zhongwu. 2015. “Resources Saving and Emissions Reduction of the Aluminum Industry in China.” Resources Conservation and Recycling 104: 68–75. doi:10.1016/j.resconrec.2015.09.006.
- Yue, Q., H.-M. Wang, L. Zhong-Wu, and S.-K. Zhi. 2014. “Analysis of Anthropogenic Aluminum Cycle in China.” Transactions of Nonferrous Metals Society of China 24 (4): 1134–1144. doi:10.1016/s1003-6326(14)63172-1.
- Zhang, C., W.-Q. Chen, and M. Ruth. 2018. “Measuring Material Efficiency: A Review of the Historical Evolution of Indicators, Methodologies and Findings.” Resources, Conservation and Recycling 132: 79–92. doi:10.1016/j.resconrec.2018.01.028.
- Zhang, D., B. Yang, and D. Wang. 2015. “Summary of Resource Characteristics and Metallogenic Regularity of Chinese Silver Mines.” Acta Geologica Sinica 89 (6): 1008–1025.