
 ?Mathematical formulae have been encoded as MathML and are displayed in this HTML version using MathJax in order to improve their display. Uncheck the box to turn MathJax off. This feature requires Javascript. Click on a formula to zoom.
ABSTRACT
Assessment of ecological fitness of woody species across land use is critical issues in degraded land restoration. However, little is known about AGBC stored capacity, important value and distribution index of woody species grows in exclosure and adjacent open lands. Therefore, this research is aimed to (i) analyse impact of exclosure on AGBC (ii) ecological fit species. A random sampling method was employed. Forty sample plots (50m*50m) were used. AGBC stocks (mean± SE) of woody species in adjacent open grazing and exclosure land use of GW site was 0.11±0.07 and 1.24±0.27Mg ha-1 respectively. While in adjacent open grazing and exclosure land use of WG site, the value was 0.27±0.03 and 2.79±0.27Mgha-1 respectively. In both site exclosure land uses, the proportion of rare, occasional and common woody species were better than their adjacent open grazing land. Cupressus lustanica from open grazing and Vernonia auriculifera from exclosure land use of WG as well as Croton macrostachyus from open grazing and Leucaena leucocephala from exclosure land use of GW site were recorded as top ecologically fit species. It is recommended to protect degraded lands via integrating ecologically adapted native species and fully used their diversity to achieve the potential benefits of land restoration.
Introduction
Assessment of aboveground biomass of species grown in different land use (exclosure and open grazing land) is a critical issue in biodiversity conservation (Vashum and Jayakumar Citation2012). This is because it provides information on productivity and sustainability of forest, amount of carbon to be stored in a species and emitted from species due to deforestation. Area exclosures are formerly degraded communal grazing lands that are limited from the interference of human and animals through strong fencing the area by locally available materials with the aim of encouraging natural regeneration (Mekuria and Aynekulu Citation2013; Demel Teketay et al. Citation2018).
Aboveground biomass includes all woody stems, branches, and leaves of living trees, creepers, and climbers (Genene Assefa et al. Citation2013). Understory plants and herbaceous species had reviewed with value 15–30% of total biomass. In estimating aboveground biomass through using allometeric equation woody basic density, height, DBH (Diameter at Breast Height), and DSH (Diameter at Stump Height) were widely used variables. Because these traits were varying among species, forest types, age, and soil fertility (Chave et al. Citation2005),the level of aboveground biomass carbon stock in species depends on the species type, ages of land use, site, allometeric equation used, and agroecology (Henry et al. Citation2009; Chave et al. Citation2005).
The study showed that perennial plants grown on farmland represent the most important carbon pool, which had a contribution of 55% and 81% of the total aboveground farm carbon in Siays and Vihiga, respectively. In the same study, aboveground biomass of perennial tree grown in home garden of Siays and Vihiga contributes to 33% and 25% of the carbon stocks, respectively (Henry et al. Citation2009).
Variation in forest type across tropical ecosystems creates differences in the number of stem and aboveground biomass (Alves et al. Citation2010). For instance, in tropical Atlantic moist forest (Brazil) at higher altitude, gradient biomass of trees with DBH ≥10 cm was great (Alves et al. Citation2010). However, distribution of woody density and live aboveground biomass by diameter class showed contrasting patterns across altitude and site (Alves et al. Citation2010).
In Ethiopia, different studies were done on aboveground biomass carbon (AGBC) storage capacity of woody species grown in exclosure land. For example, Tesfay Atsbha (Citation2016) reported that aboveground biomass of non-grass species in the exclosure was greater but not significant (p> 0.05) than adjacent communal land.
Unlike this, Mekuria and Aynekulu (Citation2013) suggested that aboveground biomass of standing biomass was significantly higher than adjacent open grazing land across different age of exclosure. However, little is known about AGBC, important value, and distribution indexes of woody species grown in exclosure land with reference to adjacent open grazing land at early stage of exclosure establishment. This is true in case of Amhara region, West Gojjam zone, Jabi Tehnan district where exclosure measure has been taken.
Material and methods
Study area description
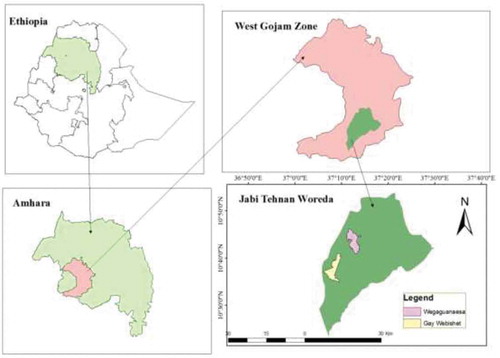
The study was carried out in two different Keble (), Wega Guanaesa (WG) and Gay Webishet (GW) Keble in Jabi Tehnane district northwestern part of Ethiopia. These sites/Kebles were selected since there were exclosure lands that had been established on the same year and level of initial management practice.
Figure 1. Location map of Gay Webishet and Wega Guanaesa
Wega Guanaesa (WG) site
Wega Guanaesa Peasant association is found in Jabi Tehnane district. The topography of the Keble is 45% mountain, 32% hill, and 25% gentle slope/flat terrain. In the Keble, there was one exclosure known by the name Wega Guanaesa which is found on altitudinal range of 2000–2300 m.a.s.l. It has 20–30% slope. The exclosure land was established in July, 2014, which has a size of 12.5 ha. Adjacent to exclosure, there is 14 ha open grazing land. The management practice was done in the beginning of exclosure establishment and then kept free from human and animal entrance (WNRMOAR, Citation2017).
Gay Webishet (GW) site
Next to Wega Guanaesa, GW is the last peasant association which has area exclosure established in July 2014. It is found in an altitude ranges of 1833–1863 m.a.s.l. The slope of GW site was 10–12%. The topography of GW site was 94% gentle/flat, 0.75% mountain, and 5.2% valley.
The size of area exclosure in this site covers an area of 13.5 ha. Adjacent to the exclosure, there was 8.5 ha open grazing land. Like that of WG in GW exclosure, management practices such as planting of seedlings and fencing were accomplished at the beginning of the establishment. In both sites after their establishment, interference of animal and human is still restricted (WNRMOAR Citation2017).
Methods
Study site selection
Reconnaissance survey was undertaken in the 37 Peasant associations (PAs) of the district to identify the presence of area exclosure and adjacent open grazing lands in the district. Accordingly, two Pas, one from high altitude (WG) and other from relatively low altitude (GW), were selected purposively since they were the only exclosures that had been established in the same year and initial management practice in the district. Thus, the exclosure and adjacent open grazing land size were identified accordingly.
Sampling design
In GW site, a total of two transect lines (one in exclosure and the other on adjacent open grazing land) with 10 replications (50m*50m) were used to determine AGBC, distribution status, and ecological fitness of woody species (IVI), whereas in WG site, a total of six transect lines, three per land use, with three replications (50m*50m) on the first and second transect line, as well as four replications (50m*50m) on the third transect line in exclosure and adjacent open grazing land (land use), were used.
After 20 m from the border of each transect line in each land use per each site, the first plot was randomly fixed. The distance between consecutive plots and transect line was 50 and 100 m, respectively, which was determined, based on the size of land use (exclosure and adjacent open grazing land), vegetation dynamics, and spatial heterogeneity of woody species. While laying down sampled plots, aspect factor (north to east) was taken into account.
In each big plot (50m*50m for relatively big trees, DBH ≥6 cm), a nested plot with the dimension of 20m*20m, 5m*5m, and 2m*2m were established at the four corners and center for small tree (4 ≤ DBH < 6), seedling or sapling (2 ≤ DBH < 4), and seedling (DBH < 2 cm) respectively. Then data of Woody basic density for each species (from literatures and Mengesteab Hailu, Eid, and Bollandsas Citation2018), DBH, height, latitude, longitude, and altitude were collected. Classification of this development stage (tree, sapling, and seedling) for a species was based on the procedure adapted by Lai et al. (Citation2009). Nomenclatures of woody species were followed by flora of Ethiopia and Eritrea (Edward Citation2000) and useful trees and shrubs of Ethiopia (Azene Bekele Citation1993, Citation2007).
Data analysis
Distribution Index (DI)
Data were collected from December (2017) to January (2018) to determine the AGBC, distribution, and important value index status of woody species. Woody species distribution index is the sum of relative frequency and relative abundance. It tells about the extent of woody species available in a given area. In this regard, it expresses species availability as rare, occasional, and common to specific site. According to Schmitt (Citation2006), Distribution Index of species is said to be common if DI ≥ 9, occasional species, 2 ≤ DI < 9, and rare, DI < 2.
Important Value Index (Kent and Coker Citation1992)
It tells the significant of species in the system or on the assigned agro ecological zones.
Aboveground biomass analysis
Aboveground biomass of woody species encountered in the sample quadrant is all biomass above the soil including stem, branches, bark, seeds, and foliage plus twigs (Assefa et al. Citation2013).The biomass of woody species is estimated in two methods (directly and indirectly). In a direct measurement, the mass of each component of the tree is measured for its dry weight and wet weight which is labor-intensive, time- and cost-consuming. Indirect method is done via using allometeric equation through using best predicting variables (parameters) though they were varying per species and countries.
Chave et al. (Citation2014) used the species which were regenerated naturally since it takes into account biomass best predictor variables such as DBH, height, and wood basic density (WD); recently proposed for inclusion in the IPCC, emission factor database was used by REDD+ protocol. The WDs of species were used following Ethiopian Forest Reference level submission to UNFCCC January 2016 which was developed by Mulugeta Lemenih. For those species which were absent in this reference level, their WDs were taken from Mengesteab Hailu, Eid, and Bollandsas (Citation2018).
Aboveground biomass of Casuarina equisetifolia, Eucalyptus camaldulensis, Mangifera indica, Acacia saligna, Leucaena leucocephala, Grevillea robusta, and Sesbania sesban were determined by using species-specific allometeric equations (). Unlike others, for Acacia decurrens, appropriate site and species-specific equation were not found. Therefore, allometeric equation which was developed for Acacia mearnsii was used.
Table 1. Lists of species which had aboveground biomass equation
Aboveground carbon analysis
This is the amount of carbon stored in aboveground biomass of a woody species. Aboveground carbon of woody species other than Cupressus lusitanica was estimated by the equation following Mesele Negash, Yirdaw, and Luukkanen (Citation2012);
where AGC = aboveground carbon, AGB = above ground biomass
For Cupressus lustanica, 48% of aboveground biomass were taken as aboveground carbon (Berhe et al. Citation2013).
Result and discussion
Distribution index and important value index of woody species
In the current study, 31.81%, 36.38%, and 31.81% of woody species in the exclosure of WG were identified as rare, occasional, and common species ().While in its adjacent open grazing land, the proportion of rare, occasional, and common species was 0%, 46.15%, and 53.84%, respectively (). Likewise, 16.6%, 50%, and 33.33% of all recorded species in exclosure of GW were rare, occasional, and common, respectively (). In the adjacent open grazing land of GW, no species was recorded as rare, but 54.54% and 45.45% of the species were occasional and commonly distributed species, respectively, in the land use ().
Table 2. Distribution Index and IVI of woody species recorded in Gay Webishet site
Table 3. Distribution Index and IVI of woody species recorded in Wega Guanaesa site
The extent of rare species on both sites, in case of adjacent land use, was relatively lower than the exclosure lands. Reappearance of the previously lost species due to further protection from disturbance by their fencing (exclosure) might lead to such situation.
Importance value index is used to compare the ecological significance of a species (Kent and Coker Citation1992; Levesque et al. Citation2011; Sunil, Somashekar, and Nagaraja Citation2011). Cupressus lustanica and Vernonia auriculifera account the top ecological fit (Highest IVI valued) species in open grazing land and exclosure lands of WG site (). Croton macrostachyus and Leucaena leucocephala had the highest IVI value in open and exclosure lands of GW site, respectively (). The first top five ecological fit species in exclosure and adjacent open grazing land of WG were Vernonia auriculifera, Carissa spinarum, Osyris quadripartite, Bersama abyssinica, Cupressus lusitanica; Cupressus lusitanica, Croton macrostachyus, Acacia abyssinica, Vernonia auriculifera, and Bersama abyssinica, respectively, in descending order.
In GW site, Leucaena leucocephala, Mangifera indica, Maerua aethiopica, Albizia gummifera, Bersama abyssinica from exclosure land; Croton macrostachyus, Carissa spinarum, Clutia abyssinica, Terminalia brownii, and Vernonia auriculifera from adjacent open grazing land were the top five ecological fit species in descending order.
In overall WG site, Vernonia auriculifera (55.86%, Average IVI value), Cupressus lustanica (55.28%), and Bersama abyssinica (21.07%) were the three top ecologically adapted species. This might be related to its higher value in animal resistance and less palatability. In exclosure land use of both sites, species were free from any disturbance and were the top in the adaptation to that ecology. Like this, species with least in their IVI were identified. Accordingly, Acacia brevispica (4.61%) and Millettia (2.14%) were the least adapted species in exclosure and adjacent open land of WG, respectively. While in GW site, Millettia (2.64%) and cordia (4.81%) were the least valid species in exclosure and adjacent open grazing land, respectively. Though Millettia was recorded from exclosure land of both site, its role of rehabilitating degraded land was lower than other. This might be related to age of exclosure and climatic variability.
Aboveground biomass carbon
Totally, 24.89 and 2.23 Mg dry matter ha−1 of aboveground biomass were recorded in exclosure and adjacent open grazing land of GW, respectively. In WG site, it was recorded as 55.89 and 5.4 Mg dry matter ha−1 inside the exclosure and adjacent open grazing land, respectively. The sum of aboveground carbon stored in woody species of exclosure and adjacent open grazing land of GW site was 12.44 and 1.12 Mg ha−1, respectively; but in exclosure and adjacent open grazing land of WG site, it was 27.94 and 2.75 Mg ha−1, respectively. Mean comparison between land uses on aboveground biomass carbon revealed strong significant difference (p < 0.01).
The aboveground biomass of woody species in adjacent open grazing (0.54 ± 0.06) land of WG was 10.27 times less than the exclosure (5.58 ± 0.48, p = 0.00). In GW site, adjacent open grazing land (0.22 ± 0.15) was 11.27 times lesser in aboveground biomass than exclosure (2.48 ± 0.45, p = 0.00). In the same manner, aboveground carbon of woody species in exclosure land was significantly greater than from adjacent open grazing land in both sites.
The mean difference in aboveground carbon stocks of woody species in adjacent open grazing land and exclosure of GW site was felt in between 0.11 and 1.24 Mg ha−1. While in WG, it was in between 0.27 and 2.79 Mgha−1. This study result was comparable with Tesfay Atsbha (Citation2016), Mekuria and Aynekulu (Citation2013). In Comparison with 5-year-old exclosure of Mekuria and Aynekulu (Citation2013) finding, aboveground biomass of WG site of this study result showed 0.75 times greater, while in GW exclosure land, it was 1.69 time lesser in value. The reason for such variation might relate to difference in the age of exclosure, allometeric question used, sample size representativeness, and level of managements.
Conclusion
Generally, AGBC was higher in a system where there was high abundance, height, woody basic density, and basal area. Accordingly, AGBC of woody species in exclosure land uses was better than adjacent open grazing land. In the exclosure land use of both sites, species were reappeared after exclusion from animal and human interface. This indicates that species previously common or occasional to free grazing lands became rare by their exclosure measurement. Therefore, land exclosure better retained ecological important species (sound felt land rehabilitation measure) and should be precious vigorously. More researches are recommended on identifying combined factors like slope, aspect, and other ecological factors in woody species biomass and carbon accommodation capacity across different exclosures. In addition to this, further research should be focus on the socioeconomic role of exclosure which will be necessary to generate information on its sustainability in the future; improving the already existing exclosure via retaining and planting practice could play a vital role to restore the hardly affected lands.
Acknowledgments
Ethiopian Environment and Forest Research Institute; Jabitehnan District Agricultural office are gratefully acknowledged for assistancing the research works. The Authors also forward heartfelt gratitude for the reviewers, Subject matter editors, and Editor in Chief for their constructive comment in the early version of this article.
Disclosure statement
No potential conflict of interest was reported by the authors.
Additional information
Funding
Related Research Data
References
- Alves, L. F., S. A. Vieira, M. A. Scaranello, P. B. Camargo, F. A. Santos, C. A. Joly, and L. A. Martinelli. 2010. “Forest Structure and Live Aboveground Biomass Variation along an Elevational Gradient of Tropical Atlantic Moist Forest (Brazil).” Forest Ecology and Management 260 (5): 679–691. doi:10.1016/j.foreco.2010.05.023.
- Assefa, G., T. Mengistu, Z. Getu, and S. Zewdie. 2013. Training Manual On: Forest Carbon Pools and Carbon Stock Assessment in the Context of SFM and REDD+. Ethiopia: Wondo Genet.
- Azene Bekele. 1993. “Useful Trees and Shrubs for Ethiopia: Identification, Propagation and Management for Agricultural and Pastoral Communities.” Regional Soil Conservation Unit, Swedish International Development Authority, Nairobi, Kenya.
- Azene Bekele, T. 2007. “Useful Trees and Shrubs of Ethiopia: Identification, Propagation, and Management for 17 Agroclimatic Zones.” RELMA in ICRAF Project, World Agroforestry Centre, Eastern Africa Region. doi:10.1094/PDIS-91-4-0467B
- Berhe, L., and G. Assefa and T. Teklay. (2013). “Models for estimation of carbon sequestered by Cupressus lusitanica plantation stands at Wondo Genet, Ethiopia.” Southern Forests: A Journal of Forest Science 75 (3): 113–122. http://dx.doi.org/10.2989/20702620.2013.805511
- Bradley, P. N., and B. H. K. Jan. 1988. Woody Biomass Survey of Kakamega District. Nairobi, Kenya: Beijer institute.
- Chave, J., C. Andalo, S. Brown, M. A. Cairns, J. Q. Chambers, D. Eamus, H. Fölster, et al. 2005. “Tree Allometry and Improved Estimation of Carbon Stocks and Balance in Tropical Forests.” Oecologia 145 (1): 87–99. doi:10.1007/s00442-005-0100-x.
- Chave, J., M. Réjou‐Méchain, A. Búrquez, E. Chidumayo, M. S. Colgan, W. B. Delitti, A. Duque, et al. 2014. “Improved Allometric Models to Estimate the Aboveground Biomass of Tropical Trees.” Global Change Biology 20 (10): 3177–3190. doi:10.1111/gcb.12629.
- Edward, I. N. 2000. Applied Ecology and Environmental Management. Australia: Blackwell Publishing Company.
- Goel, V. L., and H. M. Behl. 2005. “Growth and Productivity Assessment of Casuarina Glauca Sieb. Ex. Spreng on Sodic Soil Sites.” Bioresource Technology 96 (12): 1399–1404. doi:10.1016/j.biortech.2004.10.019.
- Hailu, M., T. Eid, and O. M. Bollandsas. 2018. “Varition in Wood Basic Density within and between Tree Species and Site Conditions of Exclosures in Tigray, Northern Ethiopia.” 1–9. doi:10.1007/s00468-018-1689-9.
- Hailu, Z. 2002. Ecological Impact Evaluation of Eucalyptus Plantations in Comparison with Agricultural and Grazing Land-Use Types in the Highlands of Ethiopia. Vienna: Vienna University of Agricultural Sciences.
- Henry, M., P. Tittonell, R. J. Manlay, M. Bernoux, A. Albrecht, and B. Vanlauwe. 2009. “Biodiversity, Carbon Stocks and Sequestration Potential in Aboveground Biomass in Smallholder Farming Systems of Western Kenya.” Agriculture, Ecosystems & Environment 129 (1): 238–252. Accessed 14 November 2008. www.elsevier.com/locate/agee
- Jonson, J. H., and D. Freudenberger. 2011. “Restore and Sequester: Estimating Biomass in Native Australian Woodland Ecosystems for Their Carbon-Funded Restoration.” Australian Journal of Botany 59 (7): 639–652. doi:10.1071/BT11018.
- Kent, M., and P. Coker. 1992. Vegetation Description Andanalysis. A Practical Approach. BocaRaton: CRC Press.
- Lai, J., X. Mi, H. Ren, and K. Ma. 2009. “Species‐Habitat Associations Change in a Subtropical Forest of China.” Journal of Vegetation Science 20 (3): 415–423. doi:10.1111/jvs.2009.20.issue-3.
- Le´Vesque, M., K. P. McLaren, and M. A. McDonald. 2011. “Recovery and Dynamics of a Primary Tropical Dry Forest in Jamaica 10 Years after Human Disturbance.” Forest Ecology and Management 262: 817–826. doi:10.1016/j.foreco.2011.05.015.
- Mekuria, W., and E. Aynekulu. 2013. Exclosure land management for restoration of the soils in degraded communal grazing lands in northern Ethiopia. Land Degradation & Development 24 (6): 528–538. doi:10.1002/ldr.1146.
- Negash, M., E. Yirdaw, and O. Luukkanen. 2012. “Potential of Indigenous Multistrata Agroforests for Maintaining Native Floristic Diversity in the South-Eastern Rift Valley Escarpment, Ethiopia.” Agroforestry Systems 85 (1): 9–28. doi:10.1007/s10457-011-9408-1.
- Schmitt, C. B., 2006. Montane Rainforest with Wild Coffea Arabica in the Bonga Region (SW Ethiopia): Plant Diversity, Wild Coffee Management and Implications for Conservation, Vol. 47. Göttingen, Germany: Cuvillier Verlag.
- Sunil, C., R. K. Somashekar, and B. C. Nagaraja. 2011. “Impact of Anthropogenic Disturbances on Riparian Forest Ecology and Ecosystem Services in Southern India.” International Journal of Biodiversity Science, Ecosystem Services & Management 7 (4): 273–282. doi:10.1080/21513732.2011.631939.
- Tandon, V. N., M. C. Pande, and R. Singh. 1989. “Organic Matter Production and Distribution of Nutrients in Plantations of Acacia Mearnsii in Nigiris,Tamilogadu.” Indian Forester 115 (5): 286–295.
- Tandug, L. M. 1986. “Biomass Prediction Equations for Giant Ipil-Ipil (Leucaena Leucocephala (Lam.) De Wit).” Sylvatrop Philippine Forest Resources Journal 11 (1 & 2): 1–22.
- Teketay, D., K. Kashe, J. Madome, M. Kabelo, J. Neelo, M. Mmusi, and W. Masamba. 2018. “Enhancement Of Diversity, Stand Structure and Regeneration of Woody Species Through Area Exclosure: The case of a Mopane Woodland in Northern Botswana.” Ecological Processes 7 (1): 299. doi: 10.1186/s13717-018-0116-x.
- Tesfay Atsbha Hailu. (2016). “The Contribution of Grazing Enclosures for Sustainable Management and Enhancing Restoration of Degraded Range Lands in Ethiopia: Lessons and Forward.” Journal of Environment and Earth Science. 6 (8). http://www.iiste.org/
- Tumwebaze, S. B., E. Bevilacqua, R. Briggs, and T. Volk. 2013. “Allometric Biomass Equations for Tree Species Used in Agroforestry Systems in Uganda.” Agroforest Syst (2013) 87: 781–795. doi:10.1007/s10457-013-9596-y.
- Vashum, K. T., and S. Jayakumar. 2012. “Methods to Estimate Above-Ground Biomass and Carbon Stock in Natural forests-A Review.” Journal of Ecosystem & Ecography 2 (4): 1–7. doi:10.4172/2157-7625.1000116.
- Woreda Natural Resource Management Office Annual Report (WNRMOAR). 2017. Table