
 ?Mathematical formulae have been encoded as MathML and are displayed in this HTML version using MathJax in order to improve their display. Uncheck the box to turn MathJax off. This feature requires Javascript. Click on a formula to zoom.
ABSTRACT
Introduction: Quantifying forest biomass requires the application of allometric equations which is a fundamental step. Generalized allometric equations have been applied to quantify aboveground biomass (AGB) of forests. But, adopting generalized allometric equations to quantify AGB of different forests creates uncertainty. Therefore, developing species- and site-specific allometric equations is essential to accurately quantify the biomass. The study was aimed to develop species-specific allometric equations for Diospyros abyssinica (Hiern) F. White in Yayu Coffee Forest Biosphere Reserve using the Semi-destructive method. The vegetation types of Yayu Coffee Forest Biosphere Reserve is categorized to Moist Evergreen Montane Rainforest of Ethiopia.
Results and discussion: Evaluating statistical relationships of AGB against predictor variables, eight allometric equations were formulated. AGB was regressed against trunk diameter (D), total height (H), and wood density (ρ) individually and in combination. Selection of allometric equations was employed using model performance statistics. Equations with a higher coefficient of determination (adjusted R2), lower residual standard error, and Akaike information criterion (AIC) values were found best-fitted. Relationships of AGB and independent variables were found statistically significant (p < 0.000). Overall, formulating species- and site-specific allometric equations is significant for accurate estimation of forest biomass and carbon stock budget.
Introduction
The cycling of carbon in global forest ecosystems is a fundamental process related to currently increasing atmospheric carbon dioxide concentration and climate change. Particularly, tropical forests are known by storing the largest amount of terrestrial carbon. Tropical forests are prominent for its highest carbon density and largest area coverage compared to other eco-regions of the world. It is serving as a buffer to the effect of climate change (Aryal et al. Citation2014; Ngo et al. Citation2013). Devising methods for quantifying forest biomass is a vital step for carbon assessments. Therefore, formulating allometric equations has wide range of applications in bioenergy, local and national forest assessments, and carbon stock mapping for successful implementation of climate change mitigation policies (Chave et al. Citation2014; Henry et al. Citation2013).
However, problems have been identified related to the methods of quantifying biomass and carbon stock of forest in different parts of the world. Tree aboveground biomass (AGB) and carbon storage are directly quantified by application of generalized allometric equations. As a result, a great bias of AGB is reported related to the application of previously published pan-tropical allometric equations (Chave et al. Citation2014; Henry et al. Citation2011; Jara et al. Citation2014). In Africa, the availability of fewer allometric equations is reported compared to other tropical continents (Ngomanda et al. Citation2014). This has created the dilemma of whether to use the pan-tropical generalized equation for forest biomass estimation. Therefore, formulating species- and site-specific allometric equation with sufficient accuracy for estimation of AGB was found essential.
Reducing emission from deforestation and forest degradation (REDD+) has gained capacity for progressive development as a climate change mitigation strategy and started implementation at multiple scales (Romijn et al. Citation2013; Lin, Sills, and Cheshire Citation2014). Current strategy of the REDD+ mechanism for conservation of forest carbon requires a precise and verifiable estimate as a principal point for monitoring. The accurate estimation of forest carbon is important to evaluate if the designed policies to mitigate the emission of carbon dioxide has achieved the target (Henry et al. Citation2013). Therefore, the common approach of quantifying carbon stock in a forest is through application of reliable allometric equations for AGB estimation (van Breugel et al. Citation2011; Gibbs et al. Citation2007).
The generic allometric equations were developed based on the inventory data of pan-tropical forest and intended for large-scale application in the same eco-region (Chave et al. Citation2005, Citation2014). However, tropical forests vary in their physiography, climatic conditions, and woody species compositions. This is the ultimate factor for variation of AGB across different forest ecology. The microclimate also can directly influence ecological processes and reflect an indirect change in ecosystem function and landscape structure across scales (Chen et al. Citation1999; Muller-Landau Citation2004; Denslow and Sandra Citation2000). Therefore, the application of generalized allometric equations generates bias in predicting the AGB of different forest or specific tree species (Alvarez et al. Citation2012). Studies suggest the importance of formulating species- and site-specific allometric equations to accurately quantify AGB (Basuki et al. Citation2009; Na´Var Citation2009). Generally, AGB varies for different forests and different tree species of a site. Therefore, formulating species- and site-specific biomass regression models is the best alternative (Litton and Kauffman Citation2008; Djomo and Chimi Citation2017; Djomo et al. Citation2010).
In Ethiopia, the forestry sector is the second major source of carbon dioxide emission next to agriculture. In order to mitigate the emission, Ethiopia has been implementing the REDD+. However, the national forest carbon stock data are uncertain due to the application of pan-tropical generalized equation to all forest types. According to Gibbs et al. (Citation2007) the major challenge is the methods available to estimate national-level forest carbon stocks in developing countries. Biomass data for many tropical forests were generated using pan-tropical generalized allometric equations (Brown Citation1997; Chave et al. Citation2005, Citation2014). Yayu Coffee Forest Biosphere Reserve is categorized to the Afromontane Rainforest vegetation type in south-western part of Ethiopia. The Afromontane Rainforest is known for multiple vertical stratums of evergreen trees (Friis Citation1992). In addition, this vegetation is categorized to the Eastern Afromontane Biodiversity Hotspots (Mittermeier et al. Citation2004). Species-specific allometric equations are not available for many trees species in Ethiopia. Therefore, formulating species-specific equations is fundamental to quantify biomass of trees. This study is intended to provide sufficient information of allometric equations formulated by regressing AGB against the predictive variables of Diospyros abyssinica tree species in Yayu Coffee Forest Biosphere Reserve. The semi-destructive method was used to formulate the allometric equations.
The study species
Diospyros abyssinica tree belongs to the plant family Ebenaceae. It is ecologically widespread found in West, East, and Southern Africa (White Citation1988; Eilu, Hafashimana, and Kasenene Citation2004). It is found in countries like Ghana, Kenya, Angola, and Ethiopia. In Ethiopia, D. abyssinica occurs in dry evergreen woodland, humid and semi-humid lowland woodland, and semi-humid and humid highland forests nearly in the altitude range of 500–2400 m.a.s.l (Bekele-Tesemma Citation2007). Diospyros abyssinica is evergreen species found mostly in evergreen forest type. Morphologically, it is small to fairly large tree up to 35(−40) m height; trunk is branchless for up to 18 m, straight and slender bole, up to 60(−75) in DBH (Bekele-Tesemma Citation2007). This tree is known for its shortly branched crown. Leaves are alternating, oval to 16 cm long, the wavy edges, narrow tip, glossy dark green, and distinctively red when young. The flowers are small, found in solitary, white to yellow color, and fragrant. The fruit is fleshy, spherical, held in cup-shaped calyx; it is red-yellow then turning to black when mature. The tree provides multiple socio-economical services.
Materials and methods
Description of the study site
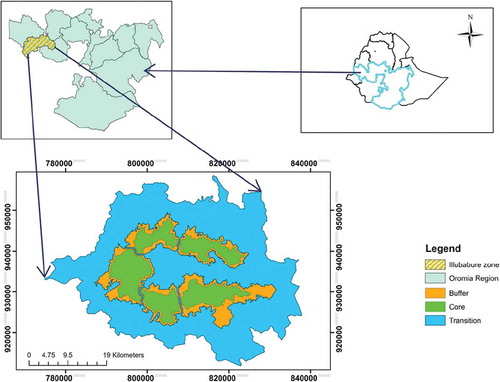
The study was conducted in Yayu Coffee Forest Biosphere Reserve which is located in Illubabor Zone, Oromia National Regional State, Ethiopia. Totally, the Core and Buffer Zone of this Biosphere Reserve extends between latitudes 923320–934340 m north and longitude of 793870–830490 m east of zone 36, in the south-western part of the country (). The forest extends along the major revers (Geba, Dogi, and Sese) between altitude ranges of 1150 and 2000 m.a.s.l. The total area covered by the forest (including the core and buffer zones) in the biosphere reserve is 49,285 hectares. The biosphere reserve was established under the Man and Biosphere of UNESCO framework in 2010 with the primary objective of biodiversity conservation and sustainable development. This biosphere is one of the largest remaining patches of Afromontane Rainforest in the south-western part of Ethiopia. The study area soils are red or brownish Ferrisols derived from volcanic parent materials. The other soil groups of this area include Nitosols, Acrisol, and Cambisols (Asres Citation1996). This area is known for its hot and humid climatic condition.
Figure 1. Map of the study forest (core and buffer zones) within the Yayu Coffee Forest Biosphere Reserve
Thirty individuals of D. abyssinica tree species were selected to develop the biomass regression models. Before starting tree measurements, the reconnaissance survey was undertaken to have baseline information about the distribution and abundance of individuals sampled. The study was followed preferential sampling technique, where all individuals have the same probability of being involved in the study. The preferential sampling was conducted with a quick screening of vegetation variability across the landscape or the particular locality, in order to delimit the vegetation type in mind (Ketterings et al. Citation2001). The locations where trees sampled were decided based on the representativeness of the forest type being studied, representativeness of the general site location, representativeness of the number and tree sizes occurring in the general site location, distribution of trees in the sampling area, and avoiding large gaps was considered (Jara et al. Citation2014).
Distribution of this species is not frequent to apply systematic sampling. As an alternative, the preferential sampling technique that follows an intentional selection of individuals from different DBH classes was practiced. The sampling population were classified into six DBH classes including: ≤10 (5–10) cm, 10.1–20 cm, 20.1–30 cm, 30.1–40 cm, 40.1–50 cm, and > 50 cm. A total of five tree individuals were randomly measured from each DBH classes. The criteria followed during sampling were avoiding hollow trees, trees with broken crowns or truncated were also avoided.
Field measurements
The geographic coordinate and altitude for all individual trees sampled were recorded using Garmin eTrex 10 GPS receiver. In the field, the measurement of dendrometric variables was carried out including D, H, and basal diameter (BD) for small trimmed and untrimmed branches. Diameter at every 1 m for the trunks and for all large branches with (BD > 7 cm) was measured for all trees sampled and finally used for volume calculation. The BD for all smaller branches (BD ≤ 7 cm) was measured for all trees sampled. The fresh weight of wood and leaves for trimmed branches was measured in the field using a suitable measuring scale. The wood and leaves aliquots were taken for laboratory analysis.
Measurment of dendrometric variables and biomass calculation
Field data collection has followed the methodology of Manual for Building Tree Volume and Biomass Allometric Equations prepared by FAO (Picard, Saint-André, and Henry Citation2012). The manual has included the main steps of biomass measurements and development of allometric equations. The use of semi-destructive method of data collection is an environmentally sound approach particularly for biosphere reserves. The core and buffer zones of the Biosphere Reserve were established for the purpose of investigation, conservation of biodiversity, and monitoring ecological processes. The semi-destructive method was applied by combining direct measurements for certain parts of the tree, and volume and density measurements for other parts. Three small branches were trimmed for determination of the biomass of wood and leaves. The measurement of the fresh biomass (in kilogram) was carried out for trimmed fresh branches. Fresh biomass of small untrimmed branches was calculated from the BD. The fresh biomass of large untrimmed branches and trunk was calculated from volume and wood density measurement. The hypothesis is that the sections cut were considered to be a cylinder, whereas, wood density was considered to be the same for all compartments of the tree.
Measuring trimmed fresh biomass
BD at the base of each trimmed branches was measured using diameter tape and the leaves were separated from wood. The fresh biomass of the leaves from trimmed branches () and fresh biomass of wood from trimmed branches (
) were measured separately in the field. Random samples of leaves were taken from three different trimmed branches to constitute the aliquot and then leaf fresh weight (
in g). An aliquot of wood was also taken at random from the trimmed branches without debarking and its fresh mass (
in g) was measured in the field immediately after cutting. For every individual trees measured in the field, three wood aliquots of 15 cm length and 250 gram leaves aliquots were brought to the laboratory for further analysis of dry weight and moisture content. The weight of wood and leaves aliquots was measured with an electronic balance. The volume was measured for wood aliquot which was later used for the determination of mean wood density (
). The volume of wood aliquots was measured using water displacement in a 1000 ml glass. An oven was set at a temperature of 70°C for aliquots of leaves and at 105°C for wood aliquots for determination of dry weight. The aliquots were dried until constant weight was maintained.
Measuring untrimmed fresh biomass
The biomass for small untrimmed branches was measured from the relationship between their dry biomass and the BD. The relationship was developed by formulating allometric model which was fitted by regressing dataset of dry biomass for trimmed small branches against their BD. This model was established following the same procedure as for the development of an allometric equation. The biomass for the trunk and large branches were estimated from the measurement of volume (Vi in cm3) and mean wood density (in g cm−3). The large branches and trunks were divided into sections by marking the tree and the volume Vi of each section i was obtained by measuring its diameter and length. According to Segura and Kanninen (Citation2005), section about one meter length was preferred considering diameter variation along the length trunk and main branches. Significant variation is not anticipated within 1 m length section of the trunk and large branches. Therefore, the volume of the trunk and the large branch is calculated using Smalian’s Formula.
Calculations
All laboratory procedures for analysis of wood and leaves aliquots and biomass calculation were followed the FAO manual (Picard, Saint-André, and Henry Citation2012). The dry biomass of the tree was obtained by the sum of the trimmed and untrimmed biomass.
Calculating trimmed biomass
The moisture content of the wood was calculated from and
including the bark as follows:
In the same method, the moisture content of the leaves was calculated from and
of the leaf aliquot
Trimmed dry biomass was then calculated as:
where is the fresh biomass of leaves stripped from the trimmed branch and
is the fresh biomass of wood from the trimmed branch.
Calculating untrimmed biomass
The trunk, main branches, and small untrimmed branches are the major components of untrimmed dry biomass. Generally, the untrimmed biomass was the sum of the two results:
During the analysis of the volume for dry sections, each section i of the trunk and the large branch was considered to be a cylinder (Smalian’s Formula) (Picard, Saint-André, and Henry Citation2012).
where Vi is the volume of section i, Li its length, and D1i and D2i are the diameters of the two extremities of section i.
Dry biomass of the trunk and the large branch was calculated in the same way (product of mean wood density and the total volume of the large branch and trunk).
The sum corresponds to all the section in the large branches and the trunk, and where the mean wood density was calculated as:
The dry biomass of untrimmed small branches was calculated using a model between dry biomass and BD of small trimmed branches. This model was established following the same procedure as for the development of an allometric model (Picard, Saint-André, and Henry Citation2012).
Linear type equation was used:
where a and b are model parameters and D is the branch BD. Using this model, the dry biomass of untrimmed branches was calculated as:
where, the sum is all the untrimmed small branches and the BD of the branch j.
Data analysis and model selection
After completion of the field and laboratory measurements, the data were summarized on the excel datasheet. The summarized data of D, H, wood density, and AGB were used for the development of biomass regression models. The Statistical Package R software (version R 3.3.0) was used to formulate allometric equations. Biomass regression Models selection and evaluation were tested based on performance statistics including coefficient of determination (adjusted R2), residual standard error (RSE), Akaike information criterion (AIC), and p-value. AIC is an estimator of the relative quality of statistical models for a given set of data. Comparison of models with the same response variables was done for the purpose of model selection. AIC estimated the quality of each model relative to each other.
The AIC is expressed as:
where L is the likelihood of the fitted model and p is the total number of parameters in the model. When comparing two models, the best model is that with smallest AIC value.
Results and discussions
Results
Allometric equations were developed by relating AGB against the predictive variables (D, H, and wood density) individually and in combination for D. abyssinica tree species. Data of the main variables (D and H) were generated from direct field measurements. However, data for (AGB and wood density) were calculated from field and laboratory measurements. Descriptive summary for main variables was presented in ().
Table 1. Statistical summary of the main dendrometric variables
The biomass regressed models were formulated by relating AGB against the predictor variables (D, H, and wood density). Single and combination of these dendrometric variables were used to fit the allometric equations. Generally, eight allometric equations were developed for D. abyssinica and tested for goodness-of-fit statistics. All the selected models have achieved the model performance statistics with a higher value of coefficient of determination (R2-adj), lower value of RSE, and AIC. The relationships between AGB and the dendrometric variables were found statistically significant (p < 0.000) as summarized in (). Generally, relationships among considered main variables were evaluated by relating AGB with single predictive variables (D, H, ρ); AGB with single compound variables (D2H, DH, ρDH); AGB with multiple variables (D + H + ρ; D2H + ρ; D + H). All biomass regression models were fitted based on log-transformed data and all have achieved model goodness-of-fit statistics. However, the relationship between AGB and ρ (as singles predictive variable) was found statistically not significant then rejected. The best performing biomass regression models of D. abyssinica were listed below in decreasing order of importance based on AIC value.
Table 2. Best-fitted regression models for predicting AGB of Diospyros abyssinica
The best-fitted allometric equations were selected based on model performance statistics (R2-adj, RSE, and AIC). The selected models were listed in order based on the value of AIC. The relationship between AGB and the dendrometric variables was found statistically significant (p < 0.000). Model 1 of D. abyssinica which predicts the variation of AGB against the compound variable of D and H (D2H) and wood density is the best model. The value of (R2-adj) shows that the predictor variables in this model explain 96.30% of the variation in AGB of this tree species. The lowest value of AIC for this model indicates that it is the best performing one compare to other models.
The model relating AGB against single compound variable (D2H) is the second best-fitted allometric equation considering its goodness-of-fit statistics. The R2-adj value also indicates that the predictive variable of this model explains 96.10% of the variation in AGB of D. abyssinica tree species.
The third best-fitted biomass regression model relates AGB against the predictive variables (D, H, and wood density). The predictor variables of this model were found to explain R2-adj (96.6%) variation of AGB. This model has also achieved goodness-of-fit statistics well considering the RSE and AIC values.
The forth best-fitted model is relating AGB against the predictive variables (diameter at breast height and H). The predictive variables were fitted individually and explain R2-adj (95.9%) variation in AGB for this tree species.
The other selected models (5, 6, 7, and 8) have also achieved the model performance statistics well. These models were listed in decreasing order of importance considering AIC values (31.68, 36.94, 39.71, and 60.08) respectively. The R2-adj value shows that the predictor variables for these models explained the variation in AGB well. However, H as a single predictive variable has explained R2-adj (88.7%) variation in AGB; which is the lowest value compared to other models. Overall, the relationship between AGB and predictor variable was found statistically significant (p < 0.000) for all models.
Scatter plots of AGB against dendrometric variables
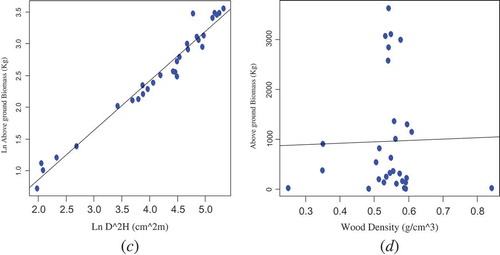
The relationship between AGB and the predictor variables (D, H, D2H, and wood density) was displayed in ( and ). As depicted in the scatter plot, there is a relationship between AGB and the predictor variables (D, H, and D2H) of D. abyssinica trees. However, the variation of AGB against wood density was found insignificant. Basically, the relationship between AGB and wood density of tree species is complex. Xylem density which is a physical property of wood varies between individuals, species, and environments. In addition, it reflects the physiological strategies of trees that lead to growth, survival, and reproduction.
Figure 2. Bivariate relationships between AGB and D (a); and AGB and H (b)
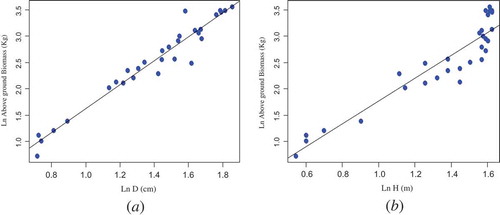
Figure 3. Bivariate relationships between AGB (kg) and D2H (cm2 m) (c); AGB (kg) and wood density (g/cm3) (d)
Correlation between predictor variables of D. abyssinica
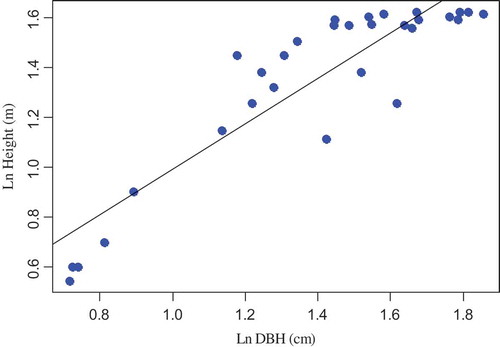
The correlation coefficients between independent variables were measured using Pearson’s correlation coefficient at 95% confidence interval. Therefore, using Pearson’s correlation coefficient, the strength of a linear relationship between paired variables of (D&H, D, and wood density) was measured. As a result, there is a strong relationship between D and H of D. abyssinica tree species where the correlation coefficient is 0.81. The relationship between D&H is also statistically significant (p < 0.05). However, the correlation coefficient for the paired variables (D and wood density) was found statistically insignificant (p > 0.05), indicating that there is a weak relationship. Scatter plot shows the relationships between DBH and H of D. abyssinica tree species (). The scatter plot shows that there is a variation in H for the variation of DBH, considering trees in lower and medium DBH classes. However, for the higher DBH class trees, the variation of H for the variation DBH is not strong.
Figure 4. Regression between the logarithm of DBH and logarithm of height
Discussion
Several generalized allometric equations were developed for the purpose of estimating forest biomass and carbon budget at large-scale eco-regions. In addition, these equations have been used for the purpose of bioenergy, local and national forest assessments, and monitoring global carbon budget (Paul et al. Citation2013; Chave et al. Citation2005, Citation2014; Henry et al. Citation2011). However, studies report the risk of bias when estimating forest biomass using the generalized allometric equations (Alvarez et al. Citation2012). Therefore, the use of species- and site-specific allometric equations is highly preferred to generic equations for precise estimation of biomass for particular tree species (Litton and Kauffman Citation2008; van Breugel et al. Citation2011). Tree AGB varies across a forest landscapes due to multiple environmental factors. Topography, disturbance and associated changes in light and nutrient supply regulate the biomass distribution along elevation gradients of a forest (Alves et al. Citation2010; Kitayama and Aiba Citation2002; Coomes and Allen Citation2007). The study of Aboal, Are´Valo, and Ferna´Ndez (Citation2005) verifies that allometric equations formulated by regressing AGB against D at breast height for five tree species were found different. Therefore, it verifies the importance of species-specific allometric development.
The main variables (AGB, D, H, and wood density) were used to formulate biomass regression models. All selected regression models of D. abyssinica were fitted the data. The biomass regression models where the compound form of predictor variables (D, H, and wood density) used were found the robust models. For instance, Model 1, Model 2, and Model 3 showed statistically better performance. Similarly, studies also explain the robustness of allometric models that consider combined predictor variables of D, H, and wood density in most tropical forest carbon assessments (Ploton et al. Citation2016; Chave et al. Citation2014). However, the biomass regression model where H was a single predictor variable showed relatively poor result (R2-adj = 88.7%) in explaining AGB variation. Multiple biophysical factors affect the growth of H and biomass storage of trees in a forest. The study of (Kohyama et al. Citation2003) reports that trees at the same D grow to different height related its adaptive morphology. This is an indication for relatively weak relationship between AGB and H.
Formulated allometric equations where combinations of D, H, and wood density were considered as predictor variable and has a key role in explaining the variation of AGB precisely. The D at breast height and H are used to capture volume variation between trees. On the other hand, wood density is used to convert volume to biomass (Brown, Gillespie, and Lugo Citation1989). The report of Chave et al. (Citation2014) also explains that considering (D, H, and wood density) in AGB model as covariates, has a significance that a single model would have a wide range of application across a tropical forest.
Studies also report the role of wood density in improving the model goodness of fit when used as a predictor variable in combination with D&H (Chave et al. Citation2014; Basuki et al. Citation2009). However, when relating AGB against wood density as a single predictor variable for D. abyssinica the allometric equation was found statistically not fit the data, then rejected. Generally, wood density as a predictor variable of providing the best-fitted model is a great point of debate in recent studies. The comprehensive study of Patino et al. (Citation2009) reveals that xylem density which is a physical property of wood varies between individuals, species, and environments. Therefore, wood density reflects the physiological strategies of trees that lead to growth and survival. Thus, site variation and individual adaptation strategy could be reason why wood density was not correlated with AGB of the study species.
In addition, Slik et al. (Citation2010) explains the significant correlation of wood density with environmental variables including elevation and edaphic factors. Various studies explicitly explain the variation of AGB between different forests landscapes and different eco-regions. The environmental factors including climate, soil, and forest structure are fundamental in explaining the spatial patterns (Malhi et al. Citation2006; Baraloto et al. Citation2011). The variation of AGB for different tree species within a forest stand is the important factor for formulating species- and site-specific allometric equations. The species composition and site variation in (topography, edaphic factors, and climatic conditions) are the major causes for the variations of biomass and associated dendrometric variables (Alves et al. Citation2010; Vanderwel et al. Citation2016). The variation of AGB among different tree species of a forest is due to the variation of tree architecture, wood density and site productivity (Ketterings et al. Citation2001). Tree species vary in their ability to capture carbon and biomass storage related to functional characteristics of plant communities (Conti and Díaz Citation2013). Therefore, formulating species- and site-specific allometric equations has a great role to precisely estimate AGB.
Comparison of allometric equations
The formulated species-specific biomass regression models were compared with the generalized allometric equation. The generic allometric equation was developed by relating AGB against combined D, H, and wood density into a single variable (AGBest = 0.0509 × ρD2H) (Chave et al. Citation2005, Citation2014). Generic allometric equation was devised to apply for pantropical forests biomass estimation. The Chave’s generic equation for the pantropicla forest is predominantly used in Ethiopia to determine carbon storage of forests. The scarcity of data from tropical Africa during generic allometric equation development is frequently reported in studies. It is the lack of species-specific allometric equations that has promoted the use of generic equations that generates great uncertainty of biomass estimation (Djomo and Chimi Citation2017; Alvarez et al. Citation2012).
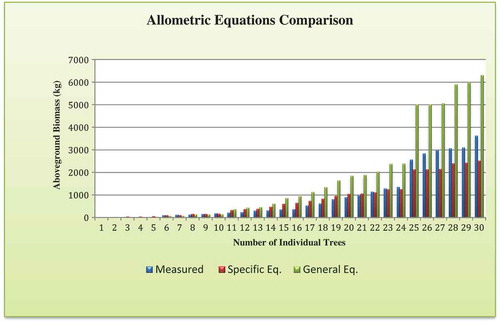
After the species-specific biomass regression model was fitted, evaluation was done to test the accuracy of its prediction. The DBH and H were measured for 30 individuals of D. abyssinica, which were not previously considered during the species-specific biomass model development. The mean wood density was obtained from the dataset used for the biomass regression model fitting. The comparison of allometric equations was done using AGB dataset generated during model prediction for species-specific biomass model and generalized allometric equation. As displayed in (), the generalized allometric equation has shown underestimation of AGB for the lower DBH classes. On the other hand, the generic equation was found highly overestimating for the higher DBH classes of D. abyssinica. Generally, bias of the species-specific equation in estimating AGB was found minimum when compared to the generic pantropical equation. As a result, it clearly indicates the significance of species-specific allometric equations formulation.
Figure 5. Allometric equation comparison for Diospyros abyssinica AGB
Currently, different studies support the development of site-specific allometric equations (Djomo and Chimi Citation2017; Ngomanda et al. Citation2014). In sub-Saharan Africa, scarcity of site-specific allometric equations was the major reason for adopting the pan-tropical generic equations. However, the application of pan-tropical generalized allometric equations was confirmed to cause great bias in biomass prediction (Fayolle et al. Citation2013; Henry et al. Citation2010). According to Alvarez et al. (Citation2012), the higher bias was observed associated to the application of Chave’s model II, the AGB was overestimated by approximately 300–400% for two tropical forest sites. This also confirms the importance of species- and site-specific allometric equations formulating for tropical forests in order to avoid the systematic errors related to the generic pan-tropical equations. The different sources of intra-specific variability in a forest are an important factor for the formulation of different species-specific allometric equations. Generally, the variability in morphology and adaptation strategies exists among different tree species of a site associated with environmental and anthropogenic factors (De-Miguel et al. Citation2013; Henry et al. Citation2011).
Conclusions and recommendations
Conclusion
Application of allometric equations is the primary step for precisely estimating forest biomass and carbon stock. However, adopting the pantropical multispecies allometric equation generates bias when applied to different forest sites. Formulating species- and site-specific allometric equations is the best approach to accurately quantify AGB of forests. The semi-destructive methodology was employed to generate dataset for this study. Eight biomass regression models were developed and tested for model goodness of fit. All selected models have achieved the model performance statistics. Allometric equations formulated by regressing AGB against multiple and compound variables were found robust in predicting. Comparison between allometric equations showed that a generalized equation generated more bias in predicting AGB. Therefore, formulated equations are fitted as species-specific equation in Moist Evergreen Montane Rainforest Ecosystem and site-specific equation in Afromontane Rainforest of south-western Ethiopia.
Recommendations
The national forest biomass and carbon stock assessment have been practiced by applying generalized allometric equations. However, Ethiopia is known for its diverse vegetation ecosystems and associated high diversity of woody plants. Therefore, it was recommended that formulating a species-specific allometric equation for all tree species is crucial step for better assessment of AGB and carbon storage of forests. It is desirable to meet the national and international reporting requirement of greenhouse gas inventories in response to the current global efforts of mitigation.
Acknowledgments
The authors would like to acknowledge Oromia Forest and Wildlife Enterprise (OFWE) for their technical and material support during data collection. The authors also would like to acknowledge those individuals involved in data collection.
Disclosure statement
Authors declare that there is no conflict of interest.
Related Research Data
References
- Aboal, J. R., J. R. Are´Valo, and A. Ferna´Ndez. 2005. “Allometric Relationships of Different Tree Species and Stand above Ground Biomass in the Gomera Laurel Forest (Canary Islands).” Flora 200(3): 264–274. doi:10.1016/j.flora.2004.11.001.
- Alvarez, E., A. Duque, J. Saldarriaga, K. Cabrera, G. de Las Salas, I. Del Valle, A. Lema, F. Moreno, S. Orrego, and L. Rodríguez. 2012. “Tree Above-Ground Biomass Allometries for Carbon Stocks Estimation in the Natural Forests of Colombia.” Forest Ecology and Management 267: 297–308. doi:10.1016/j.foreco.2011.12.013.
- Alves, L. F., S. A. Vieira, M. A. Scaranello, P. B. Camargo, F. A. M. Santos, C. A. Joly, and L. A. Martinelli. 2010. “Forest Structure and Live Aboveground Biomass Variation along an Elevational Gradient of Tropical Atlantic Moist Forest (Brazil).” Forest Ecology and Management 260 (5): 679–691. doi:10.1016/j.foreco.2010.05.023.
- Aryal, D. R., B. H. J. De Jong, S. Ochoa-Gaona, L. Esparza-Olguin, and J. Mendoza-Vega. 2014. “Carbon Stocks and Changes in Tropical Secondary Forests of Southern Mexico.” Agriculture, Ecosystems & Environment 195: 220–230. doi:10.1016/j.agee.2014.06.005.
- Asres, T. 1996. “Agroecological Zones of Southwest Ethiopia.” Matreialien Zur Ostafrica-Forschung 13: 1–241.
- Baraloto, C., S. Rabaud, Q. Molto, L. Blanc, C. Fortunel, B. Hérault, N. Dávila, et al. 2011. “Disentangling Stand and Environmental Correlates of Aboveground Biomass in Amazonian Forests.” Global Change Biology 17 (8): 2677–2688. doi:10.1111/j.1365-2486.2011.02432.x.
- Basuki, T. M., P. E. van Laake, A. K. Skidmore, and Y. A. Hussin. 2009. “Allometric Equations for Estimating the Above-Ground Biomass in Tropical Lowland Dipterocarp Forests.” Forest Ecology and Management 257 (8): 1684–1694. doi:10.1016/j.foreco.2009.01.027.
- Bekele-Tesemma, A. 2007. “Useful Trees of Ethiopia: Identification, Propagation and Management in 17 Agroecological Zones.” Technical Manual No 6. RELMA in ICRAF Project, 552. Nairobi, Kenya. doi:10.1094/PDIS-91-4-0467B
- Brown, S. 1997. “Estimating Biomass and Biomass Change of Tropical Forests: A Primer.” FAO Forestry Paper 134. Rome.
- Brown, S., A. J. R. Gillespie, and A. E. Lugo. 1989. “Biomass Estimation Method for Tropical Forests with Application of Forest Inventory Data.” Forest Science 35 (4): 881–902. doi:10.1093/forestscience/35.4.881.
- Chave, J., C. Andalo, S. Brown, M. A. Cairns, J. Q. Chambers, D. Eamus, H. Fo¨Lster, et al. 2005. “Tree Allometry and Improved Estimation of Carbon Stocks and Balance in Tropical Forests.” Oecologia 145 :87–99. doi:10.1007/s00442-0050100-x.
- Chave, J., M. Rejou-Mechain, A. Burquez, E. Chidumayo, M. S. Colgan, W. B. Delitti, A. Duque, et al. 2014. “Improved Allometric Models to Estimate the Aboveground Biomass of Tropical Trees.” Global Change Biology 20 (10): 3177–3190. doi:10.1111/gcb.12629.
- Chen, J., S. C. Saunders, T. R. Crow, R. J. Naiman, K. D. Brosofske, G. D. Mroz, B. L. Brookshire, and J. F. Franklin. 1999. “Microclimate in Forest Ecosystem and Landscape Ecology.” BioScience 49 (4): 288–297. doi:10.2307/1313612.
- Conti, G., and S. Díaz. 2013. “Plant Functional Diversity and Carbon Storage - an Empirical Test in Semi-Arid Forest Ecosystems.” Journal of Ecology 101 (1): 18–28. doi:10.1111/1365-2745.12012.
- Coomes, D. A., and R. B. Allen. 2007. “Effects of Size, Competition and Altitude on Tree Growth.” Journal of Ecology 95 (5): 1084–1097. doi:10.1111/j.1365-2745.2007.01280.x.
- De-Miguel, S., T. Pukkala, N. Assaf, and Z. Shater. 2013. “Intra-Specific Differences in Allometric Equations for Aboveground Biomass of Eastern Mediterranean Pinus Brutia.” Annals of Forest Science 71 (1): 101–112. doi:10.1007/s13595-013-0334-4.
- Denslow, J. S., and G. G. Sandra. 2000. “Variation in Stand Structure, Light and Seedling Abundance across a Tropical Moist Forest Chronosequence, Panama.” Journal of Vegetation Science 11: 201–212. doi:10.2307/3236800.
- Djomo, A. N., and C. D. Chimi. 2017. “Tree Allometric Equations for Estimation of Above, below and Total Biomass in a Tropical Moist Forest: Case Study with Application to Remote Sensing.” Forest Ecology and Management 391: 184–193. doi:10.1016/j.foreco.2017.02.022.
- Djomo, A. N., A. Ibrahima, J. Saborowski, and G. Gravenhorst. 2010. “Allometric Equations for Biomass Estimations in Cameroon and Pan Moist Tropical Equations Including Biomass Data from Africa.” Forest Ecology and Management 260 (10): 1873–1885. doi:10.1016/j.foreco.2010.08.034.
- Eilu, G., D. L. N. Hafashimana, and J. M. Kasenene. 2004. “Tree Species Distribution in Forests of the Albertine Rift, Western Uganda.” African Journal of Ecology 42: 100–110. doi:10.1111/j.1365-2028.2004.00504.x.
- Fayolle, A., J.-L. Doucet, J.-F. Gillet, N. Bourland, and P. Lejeune. 2013. “Tree Allometry in Central Africa: Testing the Validity of Pantropical Multi-Species Allometric Equations for Estimating Biomass and Carbon Stocks.” Forest Ecology and Management 305: 29–37. doi:10.1016/j.foreco.2013.05.036.
- Friis, I. B. 1992. Forests and Forest Trees of Northeast Tropical Africa: Their Natural Habitats and Distribution Patterns in Ethiopia, Djibouti and Somalia, 396. London,UK: HMSO.
- Gibbs, H. K., S. Brown, J. O. Niles, and J. A. Foley. 2007. “Monitoring and Estimating Tropical Forest Carbon Stocks: Making REDD a Reality.” Environmental Research Letters 2 (4): 13. doi:10.1088/1748-9326/2/4/045023.
- Henry, M., A. Besnard, W. A. Asante, J. Eshun, S. Adu-Bredu, R. Valentini, M. Bernoux, and L. Saint-André. 2010. “Wood Density, Phytomass Variations within and among Trees, and Allometric Equations in a Tropical Rainforest of Africa.” Forest Ecology and Management 260 (8): 1375–1388. doi:10.1016/j.foreco.2010.07.040.
- Henry, M., A. Bombelli, C. Trotta, A. Alessandrini, L. Birigazzi, G. Sola, G. Vieilledent, et al. 2013. “GlobAllomeTree: International Platform for Tree Allometric Equations to Support Volume, Biomass and Carbon Assessment.” iForest - Biogeosciences and Forestry 6 (5): 326–330. doi:10.3832/ifor0901-006.
- Henry, M., N. Picard, C. Trotta, R. J. Manlay, R. Valentini, M. Bernoux, and L. Saint-André. 2011. “Estimating Tree Biomass of Sub-Saharan African Forests: A Review of Available Allometric Equations.” Silva Fennica 45 (3B): 477–569. doi:10.14214/sf.38.
- Jara, M. C., M. Henry, M. Réjou-Méchain, C. Wayson, M. Zapata-Cuartas, D. Piotto, F. A. Guier, et al. 2014. “Guidelines for Documenting and Reporting Tree Allometric Equations.” Annals of Forest Science 72 (6): 763–768. doi:10.1007/s13595-014-0415-z.
- Ketterings, Q. M., R. Coe, M. van Noordwijk, Y. Ambagau, and C. A. Palm. 2001. “Reducing Uncertainty in the Use of Allometric Biomass Equations for Predicting Above-Ground Tree Biomass in Mixed Secondary Forests.” Forest Ecology and Management 146: 199–209. doi:10.1016/S0378-1127(00)00460-6.
- Kitayama, K., and S.-I. Aiba. 2002. “Ecosystem Structure and Productivity of Tropical Rain Forests along Altitudinal Gradients with Contrasting Soil Phosphorus Pools on Mount Kinabalu, Borneo.” Journal of Ecology 90: 37–51. doi:10.1046/j.0022-0477.2001.00634.x.
- Kohyama, T., E. Suzuki, T. Partomihardjo, T. Yamada, and T. Kubo. 2003. “Tree Species Differentiation in Growth, Recruitment and Allometry in Relation to Maximum Height in a Bornean Mixed Dipterocarp Forest.” Journal of Ecology 91: 797–806. doi:10.1046/j.1365-2745.2003.00810.x.
- Lin, L., E. Sills, and H. Cheshire. 2014. “Targeting Areas for Reducing Emissions from Deforestation and Forest Degradation (REDD+) Projects in Tanzania.” Global Environmental Change 24: 277–286. doi:10.1016/j.gloenvcha.2013.12.003.
- Litton, C. M., and J. B. Kauffman. 2008. “Allometric Models for Predicting Aboveground Biomass in Two Widespread Woody Plants in Hawaii.” Biotropica 40 (3): 313–320. doi:10.1111/j.1744-7429.2007.00383.x.
- Malhi, Y., D. Wood, T. R. Baker, J. Wright, O. L. Phillips, T. Cochrane, P. Meir, et al. 2006. “The Regional Variation of Aboveground Live Biomass in Old-Growth Amazonian Forests.” Global Change Biology 12 (7): 1107–1138. doi:10.1111/j.1365-2486.2006.01120.x.
- Mittermeier, R. A., P. R. Gil, M. Hoffman, J. Pilgrim, T. Brooks, C. G. Mittermeier, J. Lamoreux, and G. A. B. Da Fonseca. 2004. Hotspots Revisited. Mexico City: CEMEX. Sierra.
- Muller-Landau, H. C. 2004. “Interspecific and Inter-Site Variation in Wood Specific Gravity of Tropical Trees.” Biotropica 36 (1): 20–32. doi:10.1111/j.1744-7429.2004.tb00292.x.
- Na´Var, J. 2009. “Allometric Equations for Tree Species and Carbon Stocks for Forests of Northwestern Mexico.” Forest Ecology and Management 257: 427–434. doi:10.1016/j.foreco.2008.09.028.
- Ngo, K. M., B. L. Turner, H. C. Muller-Landau, S. J. Davies, M. Larjavaara, N. F. Bin Nik Hassan, and S. Lum. 2013. “Carbon Stocks in Primary and Secondary Tropical Forests in Singapore.” Forest Ecology and Management 296: 81–89. doi:10.1016/j.foreco.2013.02.004.
- Ngomanda, A., N. L. Engone Obiang, J. Lebamba, Q. Moundounga Mavouroulou, H. Gomat, G. S. Mankou, D. Joël Loumeto, et al. 2014. “Site-Specific versus Pantropical Allometric Equations: Which Option to Estimate the Biomass of a Moist Central African Forest?” Forest Ecology and Management 312 :1–9. doi:10.1016/j.foreco.2013.10.029.
- Patino, S., J. Lloyd, R. Paiva, T. R. Baker, C. A. Quesada, L. M. Mercado, J. Schmerler, et al. 2009. “Branch Xylem Density Variations across the Amazon Basin.” Biogeosciences 6 (4): 545–568. doi:10.5194/bg-6-545-2009.
- Paul, K. I., S. H. Roxburgh, J. R. England, P. Ritson, T. Hobbs, K. Brooksbank, J. R. Raison, et al. 2013. “Development and Testing of Allometric Equations for Estimating Above-Ground Biomass of Mixed-Species Environmental Plantings.” Forest Ecology and Management 310 :483–494. doi:10.1016/j.foreco.2013.08.054.
- Picard, N., L. Saint-André, and M. Henry. 2012. Manual for Building Tree Volume and Biomass Allometric Equations: FromField Measurements to Prediction, 213. Rome: Food and Agricultural Organization of the United Nations.
- Ploton, P., N. Barbier, S. Takoudjou Momo, M. Réjou-Méchain, F. Boyemba Bosela, G. Chuyong, G. Dauby, et al. 2016. “Closing a Gap in Tropical Forest Biomass Estimation: Taking Crown Mass Variation into Account in Pantropical Allometries.” Biogeosciences 13 (5): 1571–1585. doi:10.5194/bg-13-1571-2016.
- Romijn, E., J. H. Ainembabazi, A. Wijaya, M. Herold, A. Angelsen, L. Verchot, and D. Murdiyarso. 2013. “Exploring Different Forest Definitions and Their Impact on Developing REDD+ Reference Emission Levels: A Case Study for Indonesia.” Environmental Science & Policy 33: 246–259. doi:10.1016/j.envsci.2013.06.002.
- Segura, M., and M. Kanninen. 2005. “Allometric Models for Tree Volume and Total Aboveground Biomass in a Tropical Humid Forest in Costa Rica.” Biotropica 37 (1): 2–8. doi:10.1111/j.1744-7429.2005.02027.x.
- Slik, J. W. F., S.-I. Aiba, F. Q. Brearley, C. H. Cannon, O. Forshed, K. Kitayama, H. Nagamasu, et al. 2010. “Environmental Correlates of Tree Biomass, Basal Area, Wood Specific Gravity and Stem Density Gradients in Borneo’s Tropical Forests.” Global Ecology and Biogeography 19 :50–60. doi:10.1111/j.1466-8238.2009.00489.x.
- van Breugel, M., J. Ransijn, D. Craven, F. Bongers, and J. S. Hall. 2011. “Estimating Carbon Stock in Secondary Forests: Decisions and Uncertainties Associated with Allometric Biomass Models.” Forest Ecology and Management 262: 1648–1657. doi:10.1016/j.foreco.2011.07.018.
- Vanderwel, M. C., H. Zeng, J. P. Caspersen, G. Kunstler, and J. W. Lichstein. 2016. “Demographic Controls of Aboveground Forest Biomass across North America.” Ecology Letters 19 (4): 414–423. doi:10.1111/ele.12574.
- White, F. 1988. “The Taxonomy, Ecology and Chorology of African Ebenaceae II. The non-Guineo-Congolian Species of Diospyros (Excluding Sect. Royena).” Bulletin Du Jardin Botanique National De Belgique/Bulletin Van De Nationale Plantentuin Van Belgie 325–448. doi:10.2307/3668296.