?Mathematical formulae have been encoded as MathML and are displayed in this HTML version using MathJax in order to improve their display. Uncheck the box to turn MathJax off. This feature requires Javascript. Click on a formula to zoom.
ABSTRACT
Introduction: In-use product and material stocks are the amount of concerned manufactured products and materials in active use, and are essential components of urban ecosystem.
Methods: This study estimates the dynamic in-use stocks of steel-containing products and steel in the city of Xiamen, China, during 1980–2015 by applying a bottom-up accounting approach. We incorporate 55 categories of steel-containing products that are classified into five end-use sectors (i.e., buildings, infrastructure, transportation equipment, machinery, and domestic appliances). Outcomes and Discussion: In-use stocks of 51% of the studied products kept increasing during 1980–2015, especially after 2000. Steel stocks have grown up to 4.9 ± 1.4 tons per capita (t/cap) in 2015, from 0.5 ± 0.2 t/cap in 1980. Buildings are the largest reservoirs, although its share decreased from 89% in 1980 to 68% in 2015. The dynamic spatial distribution indicates that steel stocks gradually expanded from urban core to suburban areas.
Conclusion: Theresults help to explore how a city’s urbanization is sustained by the in-use stocks growth. In-use steel stocks, of which the growth is highly correlated to and probably driven by the population growth, GDP increase, and urban built-up area expansion, may serve as a supplementary indicator for urbanization.
Introduction
More and more materials are extracted from under-ground ore deposits and transformed into components of man-made built environment, especially infrastructure, buildings, and consumer durables (Rauch Citation2009; Chen and Graedel Citation2015). The physical forms of manufactured capital, either measured by material or products, are termed as “in-use stocks” in the field of industrial ecology. Generally speaking,in-use stocks are the amount of tangible manufactured products (e.g., buildings and passenger cars) that are in active use or the amount of materials (e.g., steel or aluminum) contained in in-use stocks of products (Kapur and Graedel Citation2006). Many studies estimating in-use stocks on various scales have emerged in the last two decades. However, most previous studies focused on specific materials (e.g., metals such as steel, aluminum, and copper or bulk materials such as cement or brick) (Gordon, Bertram, and Graedel Citation2006; Müller et al. Citation2006; Gerst and Graedel Citation2008; Pauliuk, Wang, and Müller Citation2013; Cao et al. Citation2017; Liu Wei, Tian, and Chen Citation2018) rather than products. It should be noted that it is products, instead of materials, that directly provide the functions and services demanded by human society. It is the human needs for the functions and services provided by product stocks that drive the dynamic process of accumulation and discard of products (Gerst and Graedel Citation2008; Chen and Graedel Citation2015). In-use stocks of products, especially from per-capita or per-household perspective, can serve as measurements of living standard in a city (Chen and Graedel Citation2015).
In-use stocks of materials, which can be turned into new resources after discarding, are also regarded as “mines of the future” (Jacobs Citation1969). Estimating in-use stocks is important for forecasting the potential of material recycling (Pauliuk, Wang, and Müller Citation2012). Steel, as a paramount construction material, is the most widely used metal. In 2015, China used 45% of the world total steel (World Steel Association Citation2015). Since steel smelting and rolling is energy-intensive, which contributes 9% of global energy- and process-related carbon emissions (Allwood, Cullen, and Milford Citation2010), it is necessary to recycle and reuse steel scrap to substantially reduce the carbon footprint of steel industry. Quantifying in-use steel stocks in society is informative for estimating scraps supply.
Urbanization, leading to population migration, land expansion, and ultimately increasing service demands of humans, plays a major role in contemporary evolution in urban ecology by accelerating material accumulation (Pickett et al. Citation2016). As a component of socio-economic system, in-use stocks not only influence people’s life style (e.g. more automobiles and home appliances in the modern society), but also affects people’s well-being. Hence, the amount of in-use stocks can be used as an indicator to measure physical service and wealth accumulation (Pauliuk et al. Citation2013, Citation2014). In addition, we argue that in-use stocks, which have heterogeneous spatial distribution and are influenced by the distribution of population, land use, and economic activities, can serve as an indicator for the level of urbanization.
On the basis of pioneer works in the 1930s (Bain Citation1932), there is growing interest in the quantification of in-use steel stocks. We investigated studies on in-use steel stocks in the last decade with respect to their product categories, methods, temporal, and spatial boundaries (). Compared with the most existing studies which were conducted at the country level (e.g. Daigo et al. Citation2007; Daigo and Matsuno Citation2009; Han and Xiang Citation2013; Liang et al. Citation2014) or global level (e.g. Hatayama, Daigo, and Matsuno Citation2010; Müller et al. Citation2013; Pauliuk, Wang, and Müller Citation2013) by using top-down method, few studies evaluated in-use steel stocks at city level based on bottom-up method (Drakonakis et al. Citation2007; Eckelman, Rauch, and Gordon Citation2007; Huang, Han, and Chen Citation2017). Although remote sensing (RS) and geo-graphical information system (GIS) approaches are introduced in in-use stocks estimation with the spatial analysis techniques being widely used (Zhu and Xu Citation2016; Tanikawa et al. Citation2015), the stocks estimations with RS/GIS (e.g. night-time light images used by global or national scale stocks estimation (Liang et al. Citation2014, Citation2016)) cannot get the precise locations within a city because of low resolution. Exploring the temporal and spatial maps of in-use stocks within a city is significant and necessary because it could provide specific guidance for resource planners regarding the recycling potential for material recovery.
To complement the knowledge of city-scaled stocks, we conduct a case study for the city of Xiamen to: 1) investigate the historical evolution of in-use stocks of steel-containing products; 2) estimate in-use steel stocks contained in these products; 3) identify the relationships between the in-use steel stocks and several socio-economic factors; 4) explore the spatial distribution pattern of in-use steel stocks in Xiamen; and 5) investigate how the urbanization process in Xiamen has driven and relied on the growth of in-use products and steel stocks.
Materials and methods
Case study area
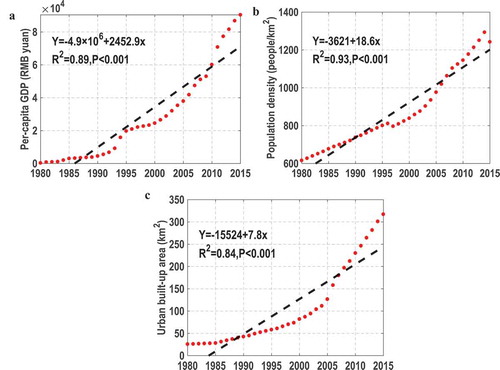
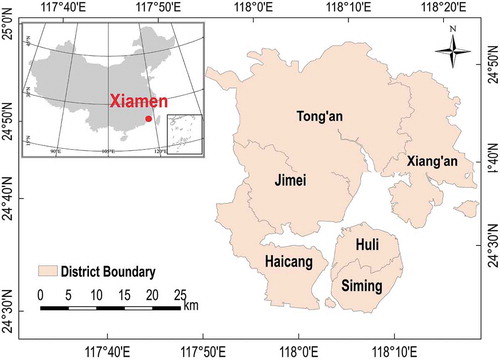
Xiamen, also named Amoy in English, is located on the southeastern coast of mainland China and has been famous as one of the most livable cities in the country (). With 1700 km2 land area in 2016 (XCSB 2017), the city comprises an urban nucleus (Xiamen Island which is divided into two districts, Siming and Huli) and four surrounding districts including Jimei, Haicang, Tongan, and Xiangan. Being one of China’s five pioneer Special Economic Zones open to the western world in early 1980s, Xiamen has experienced rapid urbanization over the past three decades (from 1980 to 2015), with the population increased from 0.9 to 2.1 million (household registered population), per-capita GDP grew from 300 to 90,400 RMB and built-up land expanded from 26 to 335 km2 (), which is very typical among all Chinese cities.
Figure 1. Geographic location of Xiamen, China
Methods
Data collection for in-use products stocks
A list of steel-containing products is identified and then classified into five end-use sectors: (i) buildings; (ii) infrastructure; (iii) transportation equipment; (iv) machinery; and (v) domestic appliances. A total of 55 steel-containing products quantified by absolute, per-capita or per-household are listed in .
Buildings
Buildings are divided into two categories: residential and non-residential buildings. For residential buildings, per-capita floor area of rural- and urban-residential building area reported by official statistics are analyzed separately. As steel is predominantly used in load-bearing structural frames, three typical types are further identified in rural-residential buildings: reinforced concrete, brick-wood, and other structures (There are no records for the different structural buildings in urban). Since floor area of non-residential buildings is not reported, we use the method recommended by Zhang et al. (Citation2014) that assumes a direct proportional relationship between residential and non-residential building area.
Infrastructure
Five important categories of steel-containing infrastructures are taken into account: highways, urban roads, pipelines, tunnels, and street lamps. Highways are further disaggregated into expressways, first-class highways, second-class highways, and highway bridges. Pipelines are further disaggregated into water supply pipelines, gas supply pipelines, and sewerage pipelines. The function units of these infrastructures are reported and measured in length.
Transportation equipment
Two categories of transportation equipment are included: motor vehicles and vessels. Motor vehicles are divided into five classes, including passenger cars, trucks, trailers, motorcycles, and others. Passenger cars are further divided into four types based on their length: micro (< 3.5 m), small (3.5–7 m), medium (7–10 m), and large (> 10 m). Trucks are further divided into four types based on their weight: micro (< 1.8 t), light (1.8–6 t), medium (6–14 t), and heavy (> 14 t). Amounts of transportation equipment are counted and per-capita ownerships of various transportation equipment are analyzed since 1980.
Machinery
Agricultural machinery and industrial machinery are distinguished. The amounts for five types of agricultural machinery, including large and medium tractors, small tractors, drainage and irrigation machinery, harvesters, and transport power machinery, are reported and analyzed. Since it is difficult to identify all machineries used in various industries, we estimate the amounts of industrial machinery by using the method recommended by Zhang et al. (Citation2014), which assumes that there is a direct proportional relationship between power consumption and the amount of industrial machines.
Domestic appliances
We count 12 types of urban-household appliances (i.e., refrigerators, washers, air conditioners, water heaters, smoke absorbers, microwave ovens, TV sets, computers, bicycles, sewing machines, and fans) and 10 types of rural-household appliances (i.e., refrigerators, washers, air conditioners, water heaters, smoke absorbers, TV sets, computers, bicycles, sewing machines, and fans). The ownership of domestic appliances and durable goods per-household (PHH) since 1980 are collected and analyzed.
Estimation of in-use steel stocks
Two statistical methods, including top-down and bottom-up, are generally used to estimate the in-use stocks. The top-down method, which sums the balance between the amount of products entering and leaving use, is usually conducted on national or global scale. The bottom-up method starts with an inventory of the different product categories, which are identified to match as closely as possible the actual situation, is adopted in this study to estimate in-use steel stocks () according to EquationEq.1
(1)
(1) .
where is total number of product
in active use at time
(counted by 2.2.1) and
is the steel content per unit of product
.
Exploring the correlation between in-use steel stocks and socioeconomic indicators
To investigate the factors affecting the inter-annual change of in-use steel stocks, we first analyze the coefficients between steel stocks and three selected socio-economic variables – population density (), per-capita gross domestic product (
), and urban built-up area (
).
Simple linear regression between per-capita in-use steel stocks () and individual socio-economic variables (
) (
) from 1980 to 2015 is first conducted.
where and
are intercept and coefficient. Statistically significant differences are set as p < 0.1 unless otherwise stated. The coefficient of determination (R2) is calculated to determine which socio-economic factor explained most of the variation of per-capita in-use steel stocks.
Secondly, multiple regressions including all these three variables from 1980 to 2015 are further conducted:
where is intercept and
,
, and
are coefficients. Using this time-series linear regression, a pixel-level map of socio-economic factors are used to downscale a gridded map of in-use steel stocks (Liang et al. Citation2014; Meng, Han, and Huang Citation2017). Furthermore, we use the equation recommended by Meng, Han, and Huang (Citation2017) to correct the pixel-level estimation, so as to ensure the sum of the gridded in-use stocks equals the estimated total amount of in-use stocks in the entire city:
where is the modeled pixel-level stocks after correction;
is the sum of pixel-level estimated stocks (
) within city boundary. All statistical analyses involved in this paper are conducted using Matlab 2013a.
Data
Statistical data
Data of steel-containing products () existing in Xiamen are extracted from Xiamen Statistical Bureau statistic yearbooks (XSB Citation1981–2016) and other published reports or papers. Steel contents are estimated based on various sources and assumptions, such as relevant references (e.g., Wang, Müller, and Hashimoto Citation2015), expert opinions. Details about the steel content of different products can be found in the .
,
, and
in Xiamen during 1980–2015 are reported by Xiamen Statistic Bureau (XSB Citation1981–2016). Data of registered population, rather than resident population, are used here, which are consistent to the scope of statistics in official reports.
Spatial data
The approach for mapping in-use steel stocks relies on the linear regression between in-use steel stocks and PD, PGDP and UBUA, and data for the city-scale socio-economic factors include: 1) 30-m GlobeLand30 product (GlobeLand30 2000, Citation2010); 2) 1-km GDP product provided by the Data Center for Resources and Environmental Sciences, Chinese Academy of Sciences (RESDC) (Xu Citation2017); and, 3) 100-m population product provided by Gaughan et al. (Citation2016). The GDP and GlobeLand30 products are spatially interpolated (Inverse Distance Weighted method) to 100-m resolution by using a software package ArcGIS12.0.
Results
In-use product stocks
The historical evolution of in-use stocks of steel-containing products in absolute, per-capita, and PHH values show different features (increasing/decreasing rate). Our results show that all products increase in the early period after the products are introduced into the market, and follow different growth patterns thereafter. Overall, in-use stocks of about 51% of the products (e.g. urban residential buildings, highways, and pipelines) are still increasing now, and the other 49% of the products have either disappeared, decreased, or saturated at the present time. For example, urban and rural PHH stocks of sewing machines have disappeared in 1990s (). Stocks of agriculture machinery increase after 1980 and then decrease sharply after 2005 (). Most urban PHH domestic appliances stocks show trends of saturation (). The saturation levels of refrigerators, washers, water heaters, smoke absorbers, and microwave ovens are all around 1-unit PHH, and the saturation levels of TV sets and air conditioners are 1.5 and 2.5, respectively. Different from the pattern of urban-household durables, the rural-household durables have not shown saturation yet and are continuing to increase ().
Figure 2. In-use stocks of products in Xiamen during 1980–2015
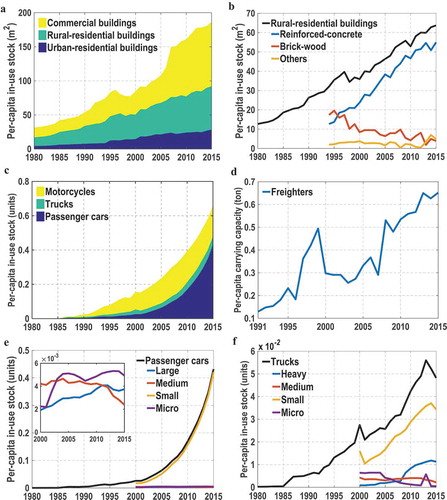
Figure 2. (contined)
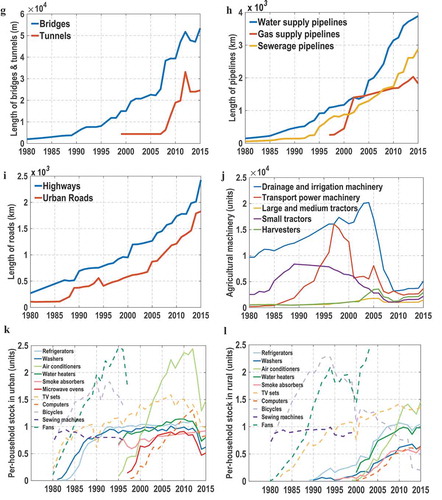
The results also indicate that there is a lag between the diffusion of rural and urban domestic appliances. For instance, an evident distinction can be seen in the introduction of refrigerators and washers into the market. These two products appeared in urban area in the 1980s, and appeared in rural area around 1990s, about 10 years behind. This discrepancy is caused by differences in lifestyles and living standards between urban and rural households.
Substitution among products providing similar services or functions is found. For example, it is obvious that reinforced-concrete structural frame containing more steels have substituted for brick-wood structural frame with less steel contents. From 1994 to 2015, the share of reinforced-concrete structural buildings in rural area increase from 40 to 86%. The percentage of brick-wood and others structural frame buildings fell to 14% in 2015, compared to 60% in 1994 ().
In-use steel stocks
The total amount of in-use steel stocks increases significantly from 0.5 ± 0.2 × 10⁶ t (0.5 ± 0.2 t/cap) to 10 ± 3 × 10⁶ t (4.9 ± 1.4 t/cap) over the past 35 years, with an average annual growth of around 0.5 × 10⁶ t (0.1 t/cap) (). In-use steel stocks in buildings increase from 0.4 ± 0.2 × 10⁶ t (0.4 ± 0.2 t/cap) to 7.0 ± 2.3 × 10⁶ t (3.3 ± 1.1 t/cap) during 1980–2015. Steel stocks in buildings, infrastructure, and transportation equipment all show rising trends, and the average growth rate of transportation equipment is the largest among the three sectors (increased by 36% per year). In-use steel stocks in machinery and domestic appliances, different from the other three sectors, decrease in recent years. The growth rate of in-use steel stocks, for all end-use sectors, was relatively small in early stages of industrialization and became larger after 1995. More details of per-capita in-use steel stocks are presented in .
Figure 3. Decomposition of total in-use steel stocks (blue) into five product sectors. Uncertainties of the steel estimation are indicated as bands, with the upper bound, the dark midline, and the lower bound corresponding to the highest, medium, and lowest steel content assumptions. Transportation = Transportation equipment; Appliances = Domestic appliances
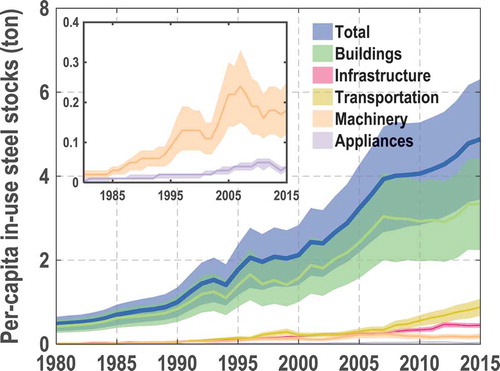
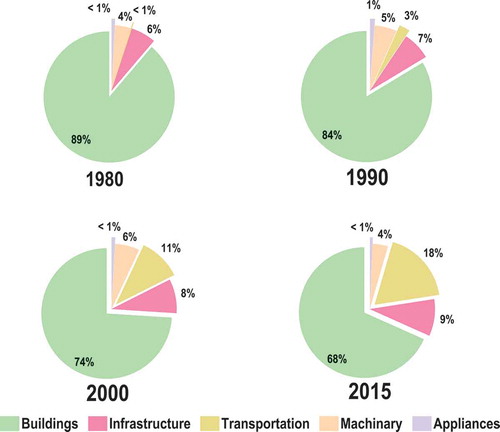
Buildings are the largest reservoirs of steel stocks during the past 35 years (with an average share of 74%), although their share decreased from 89% in 1980 to 68% in 2015 (). Steels used in transportation equipment exceed those in infrastructure as the second largest contributor in the 2000s (with an average share of 12%). Domestic appliances and machinery are the least two steel holders, together accounting for less than 10% of the total steel stocks.
Figure 4. The distribution of in-use steel stocks among end-use sectors during 1980–2015 in Xiamen. Transportation = Transportation equipment; Appliances = Domestic appliances
Relationship between in-use stocks and socio-economic variables
We analyze the correlations between per capita in-use steel stocks () with three socio-economic variables and the results show that
(R2 = 0.98, p < 0.001),
(R2 = 0.94, p< 0.001), and
(R2 = 0.92, p < 0.001) are all well correlated with
(). A multiple linear regression model is then set up between
and the three socio-economic variables. The regression model has high goodness-of-fit with R2 of 0.99 (p < 0.001), and the values of parameters are presented in .
Table 1. Performance of the multiple linear equation
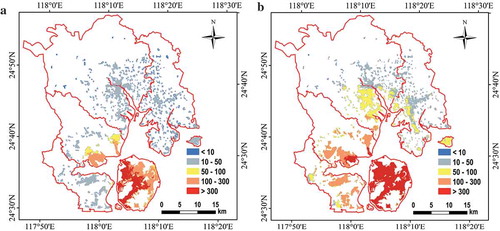
The spatial distributions of in-use steel stocks within Xiamen in 2000 and 2010 with 100-m resolution are generated by using the gridded socio-economic variables and the estimated multiple linear equation. It shows that in-use steel stocks are very unevenly distributed across the city (). Urban nucleus has obviously high density of in-use steel stocks compared to rural areas. The spatial density of steel stocks in districts with higher population density, including Siming and Huli, is about five orders of magnitude higher than that in other districts. Along with urban expansion, the accumulation of steel stocks tends to spread to much wider regions in Haicang, Jimei, Tong’an, and Xiang’an, where the population density is comparatively low.
Figure 5. The correlations of in-use steel stocks with three socio-economic variables: Per-capita GDP (A), Population density (B), and Urban built-up area (C). The values of GDP are all converted to 2015 constant price
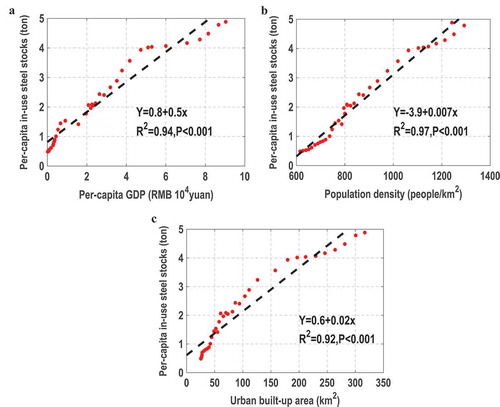
Figure 6. The spatial distribution of in-use steel stocks (t/104m2) in Xiamen for 2000 (A) and 2010 (B)
Discussion
Historical evolution of in-use product stocks
This study, to our own knowledge, first probes the dynamics of in-use product and steel stocks at city scale. The 55 steel-containing products demonstrate various historical evolution patterns in the past 35 years. Four patterns, including increase, decrease, saturation, and fluctuation, were revealed by Chen and Graedel (Citation2015) for 91 different products in the United States. Similar patterns are identified in our study. For example, 28 products follow continuous increasing trends at the present time (). The amount of transportation equipment, especially the passenger cars, have increased rapidly since the late 2000s, and the number of small type passenger cars even increases by 38 times over the studied period. This increasing pattern indicates that along with economic growth the demand for relevant services provided by these products stocks also increases continuously. With the increases in population and household numbers, the increasing pattern will possibly continue in the next 5–10 years.
Different from most products, some products demonstrate a decreasing or disappearing trend during the past two decades. This kind of pattern indicates that the products providing services or functions that are no longer popular in modern society (e.g., brick-wood and reinforced-concrete frame buildings, bicycles, and sewing machines) are replaced by new products providing similar services or functions (e.g. fans are replaced by air conditioners). The agricultural machinery also displays decreasing trend in recent decade. The reason for this phenomenon can be explained by the sharp decrease of the agriculture share in GDP due to economic structural changes.
In contrast to the patterns observed by Chen and Graedel (Citation2015), we find very few products (only refrigerators, washers, and TV sets in urban-household durables) that have saturated in Xiamen, while the ownerships of more than 50% products have saturated in the United States. Moreover, the fluctuation pattern, which was experienced by very few products in the United States (Chen and Graedel Citation2015), is not observed in our study. The reason for this phenomenon is that China is undergoing rapid urbanization and industrialization, and most products are in the process of continuous growth. In the field of technology analysis, the product stocks in China have already passed the childhood (or introduction) phase and is undergoing the adolescence (or growth) phase.
The historical evolution patterns of products illustrate that stocks in society are becoming richer with rapid industrialization and urbanization (). The variety and quantity of products mark the progress of technology and the improvement of people’s well-being. As one of China’s five pioneer Special Economic Zones open to the western world in early 1980s, Xiamen’s product stocks development epitomizes the great progress made in reform and opening up policy of China. The decreasing and disappearing patterns of products are inevitable in the economic development.
This bottom-up research accounts for a wide spectrum of steel-containing products within a city, however, data limitation prevents our study from including all steel-containing products (comparing with 250 products (Wang, Müller, and Hashimoto Citation2015) or 91 products (Chen and Graedel Citation2015) on national scale). Some missing ones, including rails, water ports, power transmission pylons, installations and fittings embodied in buildings, make a truly comprehensive study impossible. Therefore, further study is needed to improve the datasets of steel-containing products on the city scale.
Historical evolution of in-use steel stocks
Urbanization and industrialization in the developing countries have boosted steel stocks during recent decades. Although several studies have attempted to quantify in-use steel stocks on the national or global scale, city-scaled studies are limited. This study account steel stocks on a city level with an unprecedented level of resolution can complement the previous studies based upon other methods and offer important insights into resource management.
Specifically, the steel stocks of 4.9 t/cap in 2015 estimated in Xiamen is higher than the average level of 2.4 t/cap in China (Wang, Müller, and Hashimoto Citation2015), but lower than the 9.2 t/cap in New Haven (Drakonakis et al. Citation2007). An increasing pattern of per-capita in-use steel stocks, especially in the past two decades, is found by our study (). The temporal patterns of in-use steel stocks are also investigated by previous studies. For example, Müller et al. (Citation2006, Citation2011) hypothesized that the per-capita steel stocks might follow S-shaped curves that saturate at a peak after the economy became highly industrialized. Pauliuk, Wang, and Müller (Citation2013) reckoned the historical evolution of in-use steel stocks for about 200 countries over the world and confirmed that the in-use steel stocks in industrialized countries reach saturation in the range of 11–16 t/cap. According to the saturation evidence from industrialized countries, further increasing demand for steel stocks is foreseeable in the near future in Xiamen, especially for those end-use sectors with a large proportion of steel stocks ().
Different from the speed of stock growth observed by previous studies, the in-use steel stocks in Xiamen show a faster increasing tendency (increased by 10 times in 35 years). By comparison, it takes about 60 years for France and 20 years for Japan to increase the steel stocks from 2 to 7 t/cap (Müller, Wang, and Duval Citation2011). The discrepancy is due to the fact that developing countries tend to build up their steel stocks faster than industrialized countries, because the developing countries can benefit from the major inventions and innovations in steel-containing products and structures made earlier by developed countries (e.g., automobiles and construction technologies). This country specific growth speed follows the same rule with urbanization rate. Urbanization in developing countries has proceeded faster than that in developed countries. For example, it takes 60 years for the United States to raise its urbanization rate from 20 to 50%. In contrast, it takes only 30 years for China and 25 years for Japan to catch up with the same urbanization rate (United Nations, Department of Economic and Social Affairs, Citation2015).
The observed stock patterns indicate that the increasing tendency turns to be sharp after 1995 when the in-use steel stocks reached 2 t/cap (). Our results confirm the threshold pointed out by Müller, Wang, and Duval (Citation2011), which concluded that the peak in growth speed and steel demand was reached only after a level of about 2 t/cap had been passed. This kind of progress might be explained by the fact that an initial capital stocks of steel intensive products and infrastructure need to be established prior to peak growth.
Similar with previous studies, the spatial density of stocks in regions with high population density is higher than that in other districts (Zhang et al. Citation2014). The key regions of steel scrap recycling are determined by the results of the spatial distribution of steel stocks. Districts with high density of in-use steel stocks, including Siming and Huli, should be the focus of recycling in the near future. More steel stocks will be accumulated in outskirts of Xiamen. Furthermore, understanding the distribution patterns of stocks helps to establish different recycling systems in different districts, such as designing different recycling strategy for urban and rural areas.
Overall, there are three stages in the whole increasing trend of in-use steel stocks (). In specific, Xiamen had been set up as one of the nation-level Special Economic Zones after China’s economic reform and opening-up in 1978. Economy of Xiamen started to rise in the first stage during 1980–1990. Then, the acceleration of economy growth after the 1990s posed a great demand on infrastructure development. In the second stage from 1990 to 2000, with the per-capita GDP increased by 331%, lots of favorable policies were implemented to attract labors and financial capitals to accelerate the economic development and more investment was laid on infrastructures (including the bridges and urban roads). After 2000, the economy and population growth due to migration from rural area to Xiamen city kept accelerating, which lead to more demands for housing and infrastructure (e.g. buildings and urban roads). As a result, the population turned to be the most important factor simulating the sharp increase of in-use steel stocks. Further, previous studies also found that there is a positive relationship between stocks and both population and GDP (Rauch Citation2009; Zhang et al. Citation2014; Huang, Han, and Chen Citation2017). We can argue that during the acceleration of urbanization, in-use steel stocks, which have significant linear correlations with PD, PGDP, and UBUA (), can serve as a supplementary indicator for urbanization.
Conclusions
In this study, a bottom-up accounting of in-use products and steel stocks in Xiamen is carried out. We group the steel-containing products into five end-use sectors including buildings, infrastructure, transportation equipment, machinery and domestic appliances. The results show that 51% of the steel-containing products demonstrate continuously increasing pattern in recent years. On a per capita basis of in-use steel stocks, the 4.9 t/cap in Xiamen is significantly higher than the average level of China. Spatially, Siming and Huli are the high-density steel stocks area, while more steels have been accumulated outside the island of Xiamen during 2000–2010. By analyzing the relationship between socio-economic variables and in-use steel stocks, we find that the in-use steel stocks are highly correlated to the population density growth, per-capita GDP increase, and urban built-up area expansion. We thus argue that in-use steel stocks may serve as a supplementary indicator for measuring the level of urbanization, provided that this linear relationship can be observed for other cities. The results could improve our understanding of China’s urbanization from the perspective of in-use stocks and can be used to model future scenarios of steel demand and urban mining potential.
Disclosure statement
No potential conflict of interest was reported by the authors.
Additional information
Funding
Related Research Data
References
- Allwood, J. M., J. M. Cullen, and B. L. Milford. 2010. “Options for Achieving a 50% Cut in Industrial Carbon Emissions by 2050.” Environmental Science & Technology 44: 1888–1894. doi:10.1021/es902909k.
- Bain, H. F. 1932. “The Rise of Scrap Metals.” In Mineral Economics; Lectures under the Auspices of the Brooking Institution, edited by F. G. Tryon and E. C. Eckel. 1st ed, 331. New York: McGraw-Hill.
- Cao, Z., L. Shen, L. Liu, J. Zhao, S. Zhong, H. Kong, and Y. Sun. 2017. “Estimating the In-Use Cement Stock in China: 1920–2013.” Resources Conservation and Recycling 122: 21–31. doi:10.1016/j.resconrec.2017.01.021.
- Chen, W. Q., and T. E. Graedel. 2015. “In-Use Products Stocks Link Manufactured Capital to Natural Capital.” Proceedings of National Academy of Sciences of the United States of America 112 (20): 6265–6270. doi:10.1073/pnas.1406866112.
- Daigo, I., Y. Igarashi, Y. Matsuno, and Y. Adachi. 2007. “Accounting for Steel Stock in Japan.” ISIJ International 47 (7): 1065–1069. doi:10.2355/isijinternational.47.1065.
- Daigo, I., and Y. Matsuno. 2009. “In-Use Stocks of Steel Estimated by Top-Down Approach and Bottom-Up Approach.” ISIJ International 95 (1): 96–101.
- Drakonakis, K., K. H. Rostkowski, J. N. Rauch, T. E. Graedel, and R. B. Gordon. 2007. “Metal Capital Sustaining a North American City: Iron and Copper in New Haven, CT.” Resources Conservation and Recycling 49 (4): 406–420. doi:10.1016/j.resconrec.2006.05.005.
- Eckelman, M. J., J. Rauch, and R. B. Gordon. 2007. “In-Use Stocks of Iron in the State of Connecticut, USA.” Working Paper Number 11. New Haven, CT: Scholl of Forestry and Environmental Studies, Yale University. doi:10.1094/PDIS-91-4-0467B.
- Gaughan, A. E., F. R. Stevens, Z. Huang, J. J. Nieves, A. Sorichetta, S. Lai, and X. Ye et al. 2016. “Spatiotemporal Patterns of Population in Mainland China, 1990 to 2010”. Science Data 3: 160005. doi:10.1038/sdata.2016.5.
- Gerst, M. D., and T. E. Graedel. 2008. “In-Use Stocks of Metals: Status and Implications.” Environmental Science & Technology 42 (19): 7038–7045. doi:10.1021/es800420p.
- GlobeLand30 2000. 2010. http://www.globallandcover.com
- Gordon, R. B., M. Bertram, and T. E. Graedel. 2006. “Metal Stocks and Sustainability.” Proceedings of National Academy of Sciences of the United States of America 103 (5): 1209–1214. doi:10.1073/pnas.0509498103.
- Han, J., and W. N. Xiang. 2013. “Analysis of Material Stock Accumulation in China’s Infrastructure and Its Regional Disparity.” Sustainability Science 8 (4): 553–564. doi:10.1007/s11625-012-0196-y.
- Hatayama, H., I. Daigo, and Y. Matsuno. 2010. “Outlook of the World Steel Cycle Based on the Stock and Flow Dynamics.” Environmental Science & Technology 44: 6457–6463. doi:10.1021/es100044n.
- Hsu, F., C. D. Elvidge, and Y. Matsuno. 2013. “Exploring and Estimating In-Use Steel Stocks in Civil Engineering and Buildings from Night-Time Lights.” International Journal of Remote Sensing 34 (2): 490–504. doi:10.1080/01431161.2012.712232.
- Hu, M., S. Pauliuk, T. Wang, G. Huppes, E. V. Der Voet, and D. B. Müller. 2010. “Iron and Steel in Chinese Residential Buildings: A Dynamic Analysis.” Resources Conservation and Recycling 54 (9): 591–600. doi:10.1016/j.resconrec.2009.10.016.
- Huang, C., J. Han, and W. Q. Chen. 2017. “Changing Patterns and Determinnants of Infrastructures’ Material Stocks in Chinese Cities.” Resources, Conservation and Recycling 123: 47–53. doi:10.1016/j.resconrec.2016.06.014.
- Jacobs, J. 1969. The Economy of Cities. New York: Random House.
- Kapur, A., and T. E. Graedel. 2006. “Copper Mines above and below the Ground.” Environmental Science & Technology 40 (10): 3135–3141. doi:10.1021/es0626887.
- Liang, H., H. Tanikawa, Y. Matsuno, and L. Dong. 2014. “Modeling In-Use Stock in China’s Building and Civil Engineering Infrastructure Using Time-Series of DMSP/OLS Nighttime Lights.” Remote Sensing 6: 4780–4800. doi:10.3390/rs6064780.
- Liang, H., L. Dong, H. Tanikawa, N. Zhang, Z. Gao, and X. Luo. 2016. “Feasibility of a New-Generation Nighttime Light Data for Estimating In-Use Steel Stock of Buildings and Civil Engineering Infrastructures.” Resources, Conservation and Recycling 123: 11–23. doi:10.1016/j.resconrec.2016.04.001.
- Liu Wei, Z., C. J. Tian, and L. Chen. 2018. “Dynamic Analysis of Lead Stocks and Flows in China from 1990 to 2015.” Journal of Cleaning Production 205 (20): 86–94. doi:10.1016/j.jclepro.2018.09.088.
- Meng, X., J. Han, and C. Huang. 2017. “An Improved Vegetation Adjusted Nighttime Light Urban Index and Its Application in Quantifying Spatiotemporal Dynamics of Carbon Emissions in China.” Remote Sensing 9: 829. doi:10.3390/rs9080829.
- Modaresi, R., S. Pauliuk, A. N. Løvik, and D. B. Müller. 2014. “Global Carbon Benefits of Materials Substitution in Passenger Cars Until 2050 and The Impact on The Steel and Aluminum Industries.” Environmental Science & Technology 48 (18): 10776–10784.
- Müller, D. B., G. Liu, A. N. Løvik, R. Modaresi, S. Pauliuk, F. S. Steinhoff, and H. Brattebø. 2013. “Carbon Emissions of Infrastructure Development.” Environmental Science & Technology 47: 11739–11746. doi:10.1021/es402618m.
- Müller, D. B., T. Wang, and B. Duval. 2011. “Patterns of Iron Use in Societal Evolution.” Environmental Science & Technology 45 (1): 182–188. doi:10.1021/es102273t.
- Müller, D. B., T. Wang, B. Duval, and T. E. Graedel. 2006. “Exploring the Engine of Anthropogenic Iron Cycles.” Proceedings of the National Academy of Sciences of the United States of America 103 (44): 16111–16116. doi:10.1073/pnas.0603375103.
- Pauliuk, S., and D. B. Müller. 2014. “The Role of In-Use Stocks in the Social Metabolism and in Climate Change Mitigation.” Global Environmental Change 24 (1): 132–142. doi:10.1016/j.gloenvcha.2013.11.006.
- Pauliuk, S., T. Wang, and D. B. Müller. 2012. “Moving toward the Circular Economy: The Role of Stocks in the Chinese Steel Cycle.” Environmental Science & Technology 46: 148–154. doi:10.1021/es201904c.
- Pauliuk, S., T. Wang, and D. B. Müller. 2013. “Steel All over the World: Estimating In-Use Steel Stocks of Iron for 200 Countries.” Resources, Conservation and Recycling 71 (1): 22–30. doi:10.1016/j.resconrec.2012.11.008.
- Pickett, S. T. A., M. L. Cadenasso, D. L. Childers, M. J. McDonnell, and W. Zhou. 2016. “Evolution and Future of Urban Ecological Science: Ecology In, Of, and for the City.” Ecosystem Health and Sustainability. doi:10.1002/ehs2.1229.
- Rauch, J. N. 2009. “Global Mapping of Al, Cu, Fe, and Zn In-Use Stocks and In-Ground Resources.” Proceedings of the National Academy of Sciences of the United States of America 106 (45): 18920–18925. doi:10.1073/pnas.0900658106.
- Tanikawa, H., T. Fishman, K. Okuka, and K. Sugimoto. 2015. “The Weight of Society over Time and Space. A Comprehensive Account of the Construction Material Stock of Japan, 1945-2010.” Journal of Industrial Ecology 19 (5): 778–791. doi:10.1111/jiec.12284.
- United Nations, Department of Economic and Social Affairs, Population Division. 2015. World Population Prospects. The 2014 Revision.
- USGS. 2005. Metal Stocks in Use in the United States. Denver, CO: USGS.
- USGS. 2006. Steel Stocks in Use in Automobiles in the United States. Buckingham, D.A: USGS.
- Wang, T., D. B. Müller, and S. Hashimoto. 2015. “The Ferrous Find: Counting Iron and Steel Stocks in China’s Economy.” Journal of Industrial Ecology 19 (5): 877–889. doi:10.1111/jiec.12319.
- Wang, T., D. B. Müller, and T. E. Graedel. 2007. “Forging the Anthropogenic Iron Cycle.” Environmental Science & Technology 41 (14): 5120–5129. doi:10.1021/es062761t.
- World Steel Association. 2015. Steel Statistical Yearbook 2015. Brussels, Belgium: World Steel Committee on Economic.
- Xiamen Statistical Bureau (XSB). 1981–2016. Statistical Yearbook of Xiamen. Xiamen, China: China Statistics Press.
- Xu, X. L. 2017. “Chinese GDP Spatial Distribution Dataset.” Data Registration and Publishing System of the Resource and Environment Science Data Center of Chinese Academy of Sciences.
- Zhang, L., Z. Cai, J. Yang, Y. Chen, and Z. Yuan. 2014. “Quantification and Spatial Characterization of In-Use Copper Stocks in Shanghai.” Resources, Conservation and Recycling 93: 134–143. doi:10.1016/j.resconrec.2014.10.010.
- Zhu, X., and X. Yu. 2016. “Above-Ground Resource Analysis with Spatial Resolution to Support Better Decision Making.” Journal of Sustainable Metallurgy 2 (4): 304–312. doi:10.1007/s40831-016-0049-5.
Appendices
Table A1. Recent studies on in-use steel stocks estimation
Table A2. The steel contents of different products
Table A3. Bottom-up estimation of per-capita in-use steel stocks (ton) during 1980–2015
Figure A1. Patterns of three socio-economic factors in Xiamen during 1980–2015. Per-capita GDP (A), Population density (B), and Urban built-up area (C). The values of GDP (RMB yuan) are all converted to 2015 constant price