
ABSTRACT
Adjusting macroeconomic indicators to account for the depletion and degradation of natural capital has long been viewed as a way to show the linkages between nature and the economy and foster more sustainable paths of development. Here, we show how the System of Environmental Economic Accounting (SEEA) Experimental Ecosystem Accounting (EEA) can be used to develop environmentally adjusted macroeconomic indicators. More specifically, we show how an enlargement of the production boundary to include the consideration of ecosystems as institutional units allows the development of a net value added metric that reflects depreciation and degradation of the natural capital assets. This measurement could be useful for policymaking: the linkage of ecosystem services to economic activities allows us to account for loss, repair and substitution of natural capital, and thus helps us to formulate and monitor environmental policies.
Introduction
The aim of “environmentally” adjusting macroeconomic indicators, by consistently presenting information in accounts from which indicators can be derived (Vardon et al. Citation2018), inspired the pioneers of the System of Environmental Economic Accounting (SEEA) more than 25 years ago. In fact, a group of experts from the United Nations Statistical Office attempted to build an integrated system to calculate a “green gross domestic product (GDP)” by subtracting estimates for depletion and degradation (Bartelmus et al., Citation1991). The initial version of the SEEA (United Nations Citation1993) was modified through a continuous enhancement process (United Nations, European Commission, International Monetary Fund, Organisation for Economic Co-operation, World Bank Citation2003; United Nations, European Union, Food and Agriculture Organization of the United Nations, International Monetary Fund, Organisation for Economic Co-operation, World Bank Citation2014a) and, although correcting macroeconomic indicators was (and is) not the only purpose of the SEEA, it remains among the possibilities offered by this integrated system.
The development of environmentally-adjusted macroeconomic indicators can follow an accounting path through the SEEA, or it can follow an alternative path based on economic theory.
Both approaches present advantages and drawbacks. The accounting approach offers room to develop analytical modules that transparently show environmental changes and the causes of these changes in an economic accounting format. However, the estimates presented in the initial version of the SEEA (United Nations Citation1993) were too rough moreover the SEEA Central Framework (United Nations, European Union, Food and Agriculture Organization of the United Nations, International Monetary Fund, Organisation for Economic Co-operation, World Bank Citation2014a) presents the methodological approach to estimate natural resource depletion, but not degradation.
The green net national product (NNP), based on the Weitzman model (Citation1976), is probably the best known indicator stemming from the economic theory path; it aims to “correct” NNP for the depreciation and depletion of natural resources (Hartwick Citation1990; Dasgupta et al., Citation1995). One disadvantage of this approach is that it embeds depletion and degradation into highly aggregated indicators and thus its effectiveness in supporting the choices of policymakers is strongly affected by how accurately the whole model (including the chosen environmental indicators) reflects policymakers’ specific goals and policy options.
Both approaches raise a few issues: on the one hand, we need to measure degradation and leave the accounting tool open to a variety of policy uses and policy options; on the other hand, we need to keep depletion and degradation accounts connected to macroeconomic analysis.
Over the last two decades, progress has been made to overcome most of the drawbacks of both approaches. In this paper, we focus on the accounting approach and propose a way to meet the foreseen challenges; specifically, how to provide measurements that contribute to assessing degradation and consistently account for it. SEEA Experimental Ecosystem Accounting (SEEA EEA) represents an excellent starting point to address the issues of how to account for ecosystem services in a way that remains coherent with the core System of National Accounts (SNA) structure. It provides a picture of the actual situation; without this basis, no progress can be made in accounting for ecosystem services (United Nations, Citation2017; United Nations, European Union, Food and Agriculture Organization of the United Nations, International Monetary Fund, Organisation for Economic Co-operation, World Bank Citation2014b). As explicitly stated in the SEEA EEA (Citation2014), the need to combine ecosystem accounts with national accounts is very important, considering that on the one hand some ecosystem services get scarce and, on the other hand there are no policy instruments to manage this scarcity. Transactions, assets and liabilities related to ecosystem services exist and need be appropriately recorded in the existing framework of the SNA. The inclusion of ecosystem services by SEEA EEA represents an enlargement of the SNA production boundary (Eigenraam and Obst Citation2018; Obst Citation2015). Thanks to the enlarged production boundary, it is possible to move forward and report information concerning degradation that reflects an ecological perspective (La Notte et al., Citation2019a).
Reflecting an ecological perspective implies considering ecosystems not only as input providers, but as institutional sectors (as well as economic sectors). In the SNA, the supply and use tables offer a detailed picture of the economy by providing: (i) the elements of the production process, (ii) the use of the goods and services (products), and (iii) the income generated through that production (European Communities, International Monetary Fund, Organisation for Economic Co-operation and Development, United Nations, World Bank Citation2009). Supply and use tables describe how the supply of different kinds of goods and services originates from domestic industries and imports, and how this supply is allocated between various intermediate or final uses, including exports. It is possible to explore interdependencies among different sectors and throughout the supply chain, e.g., linkage between the providers of raw materials, those who transform them into manufactured or semi-manufactured goods, and those who consume those goods for further processing or who deliver to final consumers. This set of information allows policymakers in general, and sectorial analysts in particular, to study the current situation clearly and to make appropriate evaluations.
The same principle should apply to ecosystems. As already stated in business (Natural Capital Coalition Citation2016) and finance (Natural Capital Declaration, Citation2015), the interest of institutional sectors in the environment is not only in terms of marketing and reputation, but mostly in terms of impacts and dependencies: knowledge gaps must be filled in order to provide decision-makers with appropriate sets of information. Thus, it is important to consider interdependencies among ecosystem types and economic sectors. By providing complementary information on supply and use for ecosystem services, we can complete the accounting mosaic and provide measurements of not only production and consumption, but also the excess of yearly use for those ecosystem services characterised by regeneration and absorption rates (La Notte et al. Citation2019a). These elements ultimately translate the capacity of ecosystems to meet human demand.
By considering ecosystem types as full accounting units, in the same way we consider institutional sectors, we further empower the notion of “enlarged production boundary.” When considering an “enlarged production boundary,” additional information needs to be inserted into the sequence of accounts. In this paper, we are going to first describe the accounting framework to be applied (section 2), and then show how it would work through an illustrative example (section 3). In the discussion (section 4), practical issues and implications will be addressed.
Method: the enlarged accounting framework
The production boundary in the SNA comprises those activities “under the control and responsibility of an institutional unit that uses inputs of labour, capital, and goods and services to produce outputs of goods or services” (European Communities, International Monetary Fund, Organisation for Economic Co-operation and Development, United Nations, World Bank Citation2009, paragraph 6.24). It excludes: (i) all processes that take place in nature without human intervention by economic agents, and (ii) all those services that are not the result of a consensual transaction between economic agents (European Communities, International Monetary Fund, Organisation for Economic Co-operation and Development, United Nations, World Bank Citation2009, paragraph 3.91).
Following the guidelines in the SEEA Central Framework (United Nations, European Union, Food and Agriculture Organization of the United Nations, International Monetary Fund, Organisation for Economic Co-operation, World Bank Citation2014a), SEEA EEA (United Nations, European Union, Food and Agriculture Organization of the United Nations, International Monetary Fund, Organisation for Economic Co-operation, World Bank Citation2014b) and SEEA EEA Technical Recommendations (United Nations, Citation2017), the overall accounting framework comprises the following types of accounts:
supply and use tables in physical and monetary terms;
asset accounts for individual environmental assets/ecosystem types in physical and monetary terms, showing the stock of environmental assets at the beginning and the end of each accounting period and the changes in the stock;
a sequence of economic accounts highlighting depletion-adjusted economic aggregates; and
functional accounts recording transactions and other information about economic activities undertaken for environmental purposes.
Here, we focus the attention on supply and use tables for ecosystem services, together with the sequence of accounts. In the SNA, supply and use tables record all flows of products in an economy between different economic units, in monetary terms, with the objective of describing the structure of an economy and the level of economic activity. In SEEA EEA, supply and use tables record the actual flow of ecosystem services provided by different ecosystem types to economic sectors and households. Actual flow is generated by the interaction between what the ecosystem is able to offer (ecosystem service potential) and the human demand for it (La Notte et al. Citation2019a).
It is important to separate (i) degradation as a decline in the condition of ecosystem assets as a result of economic and other human activity, from (ii) natural losses as a decline in the condition of ecosystem assets as a result of natural events (UN Citation2017). This is an important distinction because it is unjust to accuse an entity of degradation and hold them accountable when in fact the reduction in stock is due to natural events (such as a large storm). To distinguish between degradation and natural loss, we need to determine whether the decline in ecosystem asset condition is a result of economic or human activity or a result of a natural event.
Some ecosystem services are characterised by regeneration and absorption rates that can be exceeded, such as provisioning services whose overuse may generate depletion (e.g., overharvesting timber) and sink-related services whose overuse may generate degradation (e.g., overwhelming the capacity of the ecosystem to provide water purification services). The ability to complement official recording of ecosystem service actual flow with ecosystem service potential flow, to allow us to assess whether overuse (as a difference between potential and actual flows) is taking place and to what extent. Any negative mismatch can be interpreted as wear and tear on natural capital. Readers should be aware that for provisioning services, the ecosystem service can be considered as a “production factor” (i.e., ecosystem contribution as natural inputs), and thus disentangled from the final SNA product (Vallecillo, La Notte, and Kakoulaki et al. Citation2019). This approach guarantees there is no double counting.
Gross domestic product (GDP) is obtained through the framework of the production accounts. It is the sum of gross value added (GVA) over all industries or sectors plus taxes on products and minus subsidies on products. GVA is defined as output (at basic prices) minus intermediate consumption (at purchaser prices); it is the balancing item of the national accounts’ production account. Net value added (NVA) is the outcome of GVA minus consumption of fixed capital (CFC). CFC reflects the decline in the value of the fixed assets of enterprises, governments and owners of dwellings. It includes normal wear and tear, foreseeable ageing (obsolescence) and a normal rate of accidental damage; it excludes unforeseen obsolescence, major catastrophes and the depletion of natural resources. In this section, we will use “depreciation of natural capital” to refer specifically to the notion of CFC in national accounts applied to ecosystem capacity (La Notte et al. Citation2019a).
Taking advantage of the background set out in La Notte and Dalmazzone (Citation2018) on the expansion from the SNA supply and use table to the SEEA Central Framework (SEEA CF) and then SEEA EEA supply and use tables, we proceed to show how it would be conceptually possible to integrate the complementary information reported in supply and use tables into the sequence of accounts. shows the main fields that should be compiled in supply and use tables.
refers to “complementary” tables; the differences between complementary and official supply and use tables are as follows:
official supply tables report actual flows; complementary information is provided by assessing the potential flows, only for those ecosystem services characterised by regeneration (provisioning) and absorption (sink-related) rates;
official use tables do not consider the difference between potential and actual flow, which in La Notte, Vallecillo, and Maes Citation(2019b) is defined as mismatch account.
When reporting the complementary use table, a specific meaning of SNA “accumulation” is highlighted: consumption of fixed capital. This specification is made to facilitate interpretation of the mismatch account (when negative): depreciation of the natural capital. In the same way that manmade capital (e.g., machinery, constructions) deteriorate due to consumption year after year, natural capital deteriorates when overused year after year. In , this concept is summarised as “changes in fixed capital,” to align both core SNA sectors and the satellite ecosystem type sector needed to calculate NVA.
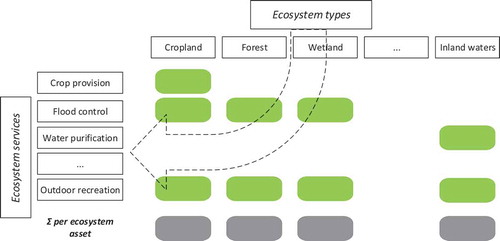
Degradation is generally related to a change in ecosystem assets (UN, Citation2017). In La Notte, Vallecillo, and Maes Citation(2019b), capacity is defined as the “virtual stock” of ecosystem services. This “virtual stock” is cross-sectional with respect to individual ecosystem assets because it is calculated for individual ecosystem services. Thanks to this function (), it is possible to connect the changes recorded in ecosystem services to changes occurring in ecosystem types, and thus in ecosystem assets. Individual ecosystem services can be summed up in order to consider the overall change in the ecosystem asset.
The graphical simplification shown in a tabular format in is applied in the illustrative example presented in the next paragraph. The reader should be aware that at this stage the concept is presented in an extremely simplified version: the accounting procedure would require complex refinement of each step with much more detailed information. The whole example should be interpreted as a first block at the start of an in-depth discussion.
Expected results: an illustrative example of applying the accounting framework
Here, we present an illustrative example of the integration of satellite ecosystem services accounts with the current structure of national accounts. We compare different hypotheses to check whether and how GDP could be adjusted to record natural capital depreciation.
Let us consider two sectors (agriculture and forestry, manufacturing), three ecosystem units (cropland, woodland and forest, inland waters) providing three different ecosystem services (pollination, timber provision, and water purification), and the household sector. For water purification, the annual flow that does not exceed the absorption rate is 50 current units; for timber provision (biomass growth), the annual flow that does not exceed the regeneration rate is 60 current units. For crop pollination, overuse of the service cannot take place since the yearly flow of this service depends on initial conditions (e.g., extent of land cover) that do not vary as a consequence of actual use.
We consider two situations:
Situation 1: agriculture and forestry sectors do not manage their resources according to sustainable practices, i.e., (i) agriculture emits more tons of nitrogen (70 current units) than inland waters can remove, and (ii) forestry harvests at a rate (70 current units) higher than the annual increment in biomass regeneration;
Situation 2: agriculture and forestry sectors manage their resources according to sustainable practices, i.e., (i) agriculture reduces nitrogen emissions to the level inland waters are able to remove, and (ii) forestry harvests at a rate that is equal to the net annual increment of wood biomass.
reflects the “No ecosystem service” approach, i.e., the traditional accounts as reported by the core SNA, where neither row items related to ecosystem services, nor column items related to ecosystem types, are included. In this simplified example, the recording ignores all other inputs and potentially relevant flows (e.g., labour costs, retail margins). The sum of value added (VA) is 128 currency units. Prices are hypothesized as constant, because the driver of change is the biophysical assessment and no room is given to inflation. In , no difference is measurable between Situation 1 and Situation 2.
Table 1. No external satellite accounts for ecosystem services
In , the SEEA EEA extends this recording to include the flow of the timber provision service from “Forest and other wooded land” (reported in as “Forest”) to the forestry sector, the pollination service from “Cropland” to the agricultural sector, and the water purification service from “Inland waters” to water companies. In the current version of the SEEA EEA we record the actual flow, which for wood biomass growth and water purification will be higher in Situation 1 and lower in Situation 2. The main effect, in comparing with “no ecosystem services” and between Situation 1 and Situation 2, is to partition the VA of economic sectors between agriculture and forestry, and the ecosystem units. The overall VA is unchanged (at 128 currency units) because the interchange between intermediate sectors redistributes the overall amount. Please note that, in this example, water purification is allocated to the agricultural sector because Situation 2 (sustainable practices) targets the polluters, e.g., through the agri-environmental payments (within EU rural development programmes) that compensate farmers who reduce the use of fertilisers. The underlying hypothesis is that there are no changes in agricultural production because farmers adopt different management practices, supported by agri-environmental payments. The water purification service mediate part of pollution emission in each catchment; what is not mediates flows into downstream catchments until it reaches the sea: spatially explicit assessments allow this kind of measurement and analysis.
Table 2. Current SEEA EEA
In , the SEEA EEA reports the outcomes described by considering ecosystem types as institutional sectors and thus measuring and reporting changes in their regeneration and absorption rates. Here we not only consider the actual flow, but also the potential flow, which in the case of sustainable practices will not exceed the regeneration rate (annual increment of wood biomass) for timber provision, or the absorption rate (pollutant emission sustainability threshold) for water purification. By recording overuse of ecosystem services, we can clearly see that the sum of VA is much lower (98 currency units) under unsustainable practices than under sustainable practices (128 currency units). In terms of aggregated economic indicators, this additional information would allow us to calculate a sustainability-adjusted macroeconomic indicator.
Table 3. SEEA EEA with adjusted NVA
Table 3. (Continued)
In terms of establishing and monitoring environmental policies, could provide the complementary information needed to assess whether improvements are likely to be generated by the planned actions and sustainability targets. This framework would not alter neither the official SNA nor the current SEEA EEA, because all the measurements are “added” to complement and not to modify standardised structures.
Thanks to the information provided by external satellite accounts, we could estimate the ecosystem performance in terms of VA when an unsustainable production pattern is implemented (−30 currency units). Unsustainable practices affect the capacity of the ecosystem to provide the same amount of services that (in this case) support the SNA “harvest:” the negative values that we read in the “ecosystem depreciation” column quantify degradation, which will affect the future generation of ecosystem service flows.
Discussion and conclusions
The tracking of patterns of unsustainable use of ecosystem services has been demonstrated at the microeconomic level in physical and monetary terms (Ogilvy Citation2015; Ogilvy et al. Citation2018). This paper targets the same objective at macroeconomic level by attributing the source of unsustainability, quantifying the producer surplus gained through the unsustainable patterns of use, and thus influencing the direction of future policy actions.
As pointed out by Bartelmus (Citation2015), the difference between an accounting system and a set of statistics and indicators is that the former requires a systemic approach with strict accounting conventions and rules, while the latter can be presented without aggregation in relatively loose frameworks. The three characteristics that Bartelmus highlights for an accounting system are: comprehensiveness, consistency and integration. Integration in particular requires “recording all consequences of a transaction in all accounts and balance sheets” (Bartelmus Citation2015, 293).
By looking specifically at integration, the illustrative example attempts to show how economic production and consumption can cause overuse of natural capital, which risks affecting the sustainability of economic performance in the medium and long term. Ecosystems are considered as natural capital and the overuse of their source and sink functions is assessed as natural capital consumption, i.e., the SNA concept of produced capital consumption can be extended to include natural capital as “an additional production cost” (Bartelmus Citation2015). The value of unpriced ecosystem services is part of the comparatively higher producer surplus (profits) of enterprises that benefit from them. If these services were priced on markets, the national accounts would record their purchase as capital formation and current production cost.
In the example, the flow of pollination and biomass growth into agriculture is an additional production input that the sector receives for free from ecosystems. Also, water purification is a service provided for free by ecosystems to clean the negative externalities mainly generated by the use of chemical fertilisers and manure.
On this specific Bartelmus (Citation2014, Citation2015) also states that degradation costs (in our example, water purification) should be allocated to the economic actor who generated them, referring to the policy-oriented polluter pays principle in the 1992 Rio Declaration (United Nations Citation1994, Principle 16).
The fact that the primary sector does not have to pay for those services increases its profit: if it had to pay for them, then its profit would be negative (−55 for Option 1 and −25 for Option 2). When there is overuse of these services (), depreciation of ecosystem capital occurs.
The possibility of valuing ecosystem services accounts in monetary terms allows us to deal with the overuse of ecosystem source and sink functions by treating them as ecosystem depreciation, and thus propose an environmentally-adjusted NVA (e.g., please refer to the water purification application in La Notte et al. Citation2019a). Weber (Citation2011) applies the same depreciation concept, but treating the ecosystem as a whole (holistic view) rather than considering ecosystem services individually. However, the valuation in monetary terms presents itself challenges to be addressed, i.e., the valuation of non-market ecosystem services by using techniques that are consistent with exchange values principles adopted in the SNA (please refer to chapter 6 in UN 2017).
This measurement could be useful for policymaking: the linkage of ecosystem services to economic activities allows us to account for loss, repair and substitution of natural capital (Bartelmus Citation2015), and thus helps us formulate and monitor environmental policies.
The idea proposed in this paper is only the starting point: it needs further development and testing. Practitioners should be aware that the suggested approach could contribute to the assessment of degradation, but it is not meant as a substitute for the assessment of ecosystem condition: ecosystem accounts and ecosystem services accounts proposed within the SEEA EEA (UN, Citation2014b; UN, Citation2017) work well when they work together, since degradation can occur even with sustainable use patterns (e.g., fire, storms, drought).
Figure 1. Graphical simplification of the complementary supply and use tables built for the SEEA–EEA
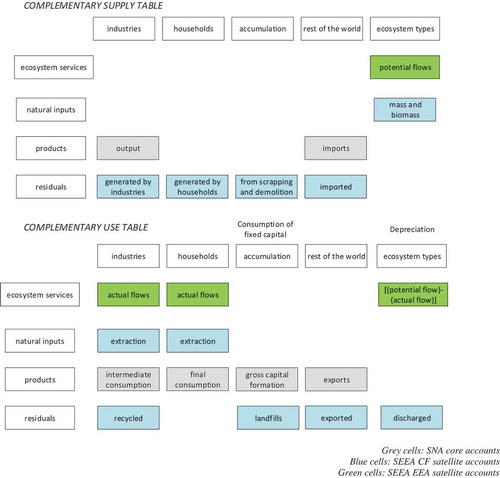
Figure 2. Graphical simplification of the NVA adjusted for the depreciation of natural capital
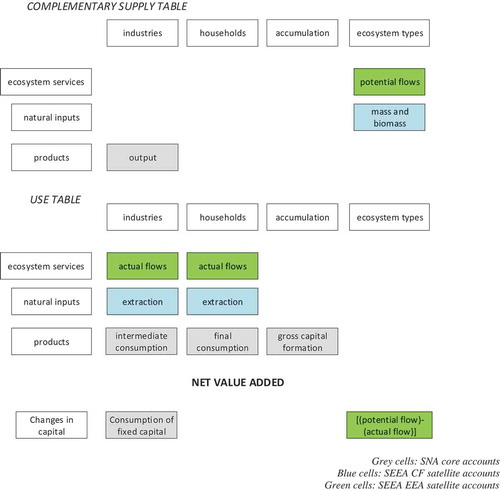
Figure 3. Graphical simplification of the linkage between ecosystem services and ecosystem assets (adapted from La Notte, Vallecillo, and Maes Citation2019b)
Disclosure statement
No potential conflict of interest was reported by the authors.
Related Research Data
References
- Bartelmus, P. 2014. “Environmental–Economic Accounting: Progress and Digression in the SEEA Revisions.” Review of Income and Wealth 60 (4): 887–904.
- Bartelmus, P. 2015. “Do we need ecosystem accounts?” Ecological Economics 118: 292–298. doi:10.1016/j.ecolecon.2014.12.026.
- Bartelmus, P., C. Stahmer, and J. van Tongeren. 1991. “Integrated Environmental and Economic Accounting: Framework for a SNA Satellite System.” Review of Income and Wealth 37 (2): 111–148. doi:10.1111/roiw.1991.37.issue-2.
- Dasgupta, P., B. Kriström, and K.-G. Mäler. 1995. “Current Issues in Resource Accounting.” In Current Issues in Environmental Economics, edited by P. O. Johansson, B. Kriström, and K.-G. Mäler, 117–152. Manchester: Manchester University Press.
- Eigenraam, M., and C. Obst. 2018. “Extending the production boundary of the System of National Accounts (SNA) to classify and account for ecosystem services.” Ecosystem Health and Sustainability 4 (11): 247–260. doi:10.1080/20964129.2018.1524718.
- European Commission. 2014. Essential SNA: Building the basics. Luxembourg: Publications Office of the European Union.
- European Communities, International Monetary Fund, Organisation for Economic Co-operation and Development, United Nations, World Bank. System of National Accounts 2008. New York: United Nations, 2009.
- Hartwick, J. M. 1990. “Natural resources, national accounting and economic depreciation.” Journal of Public Economics 43 (3): 291–304. doi:10.1016/0047-2727(90)90002-Y.
- La Notte, A., and S. Dalmazzone. 2018. “Sustainability assessment and causality nexus through ecosystem service accounting: The case of water purification in Europe.” Journal of Environmental Management 223: 964–974. doi:10.1016/j.jenvman.2018.06.072.
- La Notte, A., S. Vallecillo, A. Marques, and J. Maes. 2019a. “Beyond the economic boundaries to account for ecosystem services.” Ecosystem Services 35: 116–129. doi:10.1016/j.ecoser.2018.12.007.
- La Notte, A., S. Vallecillo, and J. Maes. 2019b. “Capacity as ‘virtual stock’ in ecosystem services accounting.” Ecological Indicators 98 (2019): 158–163. doi:10.1016/j.ecolind.2018.10.066.
- Natural Capital Coalition. 2016. “Natural Capital Protocol.” www.naturalcapitalcoalition.org/protocol
- Natural Capital Declaration. 2015. “UN Environment Programme Finance Initiative and Global Canopy Programme.” Towards Including Natural Resource Risks in Cost of Capital: State of play and the way forward.
- Obst, C. 2015. “Reflections on natural capital accounting at the national level: Advances in the system of environmental-economic accounting.” Sustainability Accounting, Management and Policy Journal 6 (3): 315–339. doi:10.1108/SAMPJ-04-2014-0020.
- Ogilvy, S. 2015. “Developing the ecological balance sheet for agricultural sustainability.” Sustainability Accounting, Management and Policy Journal 6 (2): 110–113. doi:10.1108/SAMPJ-07-2014-0040.
- Ogilvy, S., R. Burritt, D. Walsh, C. Obst, P. Meadows, P. Muradzikwa, and M. Eigenraam. 2018. “Accounting for liabilities related to ecosystem degradation.” Ecosystem Health and Sustainability 4 (11): 261–276. doi:10.1080/20964129.2018.1544837.
- United Nations. 1993. Integrated Environmental and Economic Accounting (interim version). New York: United Nations.
- United Nations. 1994. United Nations Conference on Environment & Development, Agenda 21 (the United Nations Programme of Action from Rio de Janeiro). New York: United Nations. http://sustainabledevelopment.un.org/content/documents/Agenda21.pdf
- United Nations. 2017. Technical Recommendations in support of the System of Environmental-Economic Accounting 2012: Experimental Ecosystem Accounting. New York: United Nations, 192.
- United Nations, European Commission, International Monetary Fund, Organisation for Economic Co-operation, World Bank. 2003. Integrated Environmental and Economic Accounting 2003, Studies in Methods: Handbook of National Accounting. p. 594.
- United Nations, European Union, Food and Agriculture Organization of the United Nations, International Monetary Fund, Organisation for Economic Co-operation, World Bank. 2014a. System of Environmental-Economic Accounting 2012: Central Framework. New York: United Nations.
- United Nations, European Union, Food and Agriculture Organization of the United Nations, International Monetary Fund, Organisation for Economic Co-operation, World Bank. 2014b. System of Environmental-Economic Accounting 2012: Experimental Ecosystem Accounting. New York: United Nations.
- Vallecillo, S., A. La Notte, G. Kakoulaki, N. Roberts, J. Kamberaj, F. Dottori, L. Feyen, C. Rega, and J. Maes. 2019. “Ecosystem services accounting.” Part II-Pilot accounts for crop and timber provision, global climate regulation and flood control, EUR 29731 EN, Publications Office of the European Union, Luxembourg, ISBN 978-92-76-02905-2. doi:10.2760/631588, JRC116334
- Vardon, M., J. Castaneda, M. Nagy, and S. Schenau. 2018. “How the System of Environmental-Economic Accounting can improve environmental information systems and data quality for decision making.” Environmental Science and Policy 89: 83–92. doi:10.1016/j.envsci.2018.07.007.
- Weber, J. L. 2011. An experimental framework for ecosystem capital accounting in Europe. Luxembourg: European Environment Agency, p. 46.
- Weitzman, M. L. 1976. “On the Welfare Significance of National Product in a Dynamic Economy.” Quarterly Journal of Economics 90 (1): 156–162. doi:10.2307/1886092.