
ABSTRACT
The influence of typhoon and Kuroshio intrusion process on the natural phytoplankton assemblages in the northeastern South China Sea (neSCS) was examined during a cruise in summer 2017. One hundred ninety-six seawater samples were collected and analyzed in the neSCS. In total, 299 species were identified belonging to 82 genera, mostly dominated by Bacillariophyta (159), followed by Dinophyta (132), Cyanophyta (4) and Chrysophyta (4). Among all, Thalassionema nitzschioides, Thalassionema frauenfeldii, Thalassiosira minima, in Bacillariophyta, Prorocentrum lenticulatum, Prorocentrum compressum in Dinophyta, and Trichodesmium thiebautii, in the Cyanophyta were the most dominated species, respectively. Correlation analysis shows compared with other groups Bacillariophyta was mostly influenced by silicate, whereas, Dinophyta and Cyanophyta showed significant correlation with temperature, salinity, phosphate, and nitrate. After the typhoon, the higher abundance of Dinophyta was observed, whereas it was lower in case of Bacillariophyta and Cyanophyta, shows typhoon “Roke“ and ”Haitang” had a significant influence on the phytoplankton assemblages, which could be manifested by the variations of total phytoplankton abundance in the surface water of neSCS. Overall, our present study provides the latest in-depth information about how the environmental factors influencing the phytoplankton density and diversity in the neSCS during summer.
Introduction
Phytoplankton is the major components of the marine ecosystems that have a vital role in the global carbon cycle (Sun Citation2011). Changes in phytoplankton density and diversity significantly impact the marine food web and dynamics. The diversity of marine phytoplankton is profoundly affected by environmental factors and natural variation: global warming, ocean acidification (Harvell Citation2002). Therefore, frequent investigation on phytoplankton assemblages related to environmental factors is necessary to understand the stability and sustainability of the marine ecosystem.
The South China Sea (SCS) is one of the largest semi-enclosed marginal sea, located in the tropical and subtropical regions of Southern Asia (Su Citation2004; Guan and Yuan Citation2006). In the neSCS the southwest monsoon prevails in summer, resulting in the frequent occurrence of typhoons (Wang et al. Citation2007; Zhang and Lin Citation2001). The SCS exchanges huge water masses with the Northern Pacific Ocean (NPO) through the Luzon Strait and Kuroshio current (KC) (Su and Yuan Citation2005). Although, many investigations have been carried out in the SCS, still a lot of researchers investigating the relationship among phytoplankton communities, KC intrusion, and typhoons.
Typhoon is a tropical cyclone produced through a typical sea–air interaction process. It is known that the occurrence of typhoons in the SCS is very often. The strong vertical mixing of water caused by typhoon has a major impact on the heat, energy and material exchange between the upper ocean and the deep seawater (Tang and Sui Citation2014). When a typhoon passes through a certain sea area, it will cause a huge conversion of momentum, heat, and mass between the ocean and the atmosphere (Sriver and Huber Citation2010; Lin et al. Citation2009; Jansen, Ferrari, and Mooring Citation2010). Studies shown that after typhoon the seawater mixing would enhance, with a lower temperature and an increasing salinity and nutrients in the surface seawater resulting enhancement in phytoplankton assemblages or even occurrence of algal blooms (Sakaida, Kawamura, and Tobe Citation1998; Cione and Uhlhorn Citation2003; Lin Citation2012; Zhao, Tang, and Wang Citation2008; Zheng and Tang Citation2007; Yang et al. Citation2015). Previous investigation in Japan after typhoon shows that variation in phytoplankton assemblages and mainly composed of Bacillariophyta (Tsuchiya et al. Citation2014). Similarly, in the SCS Li, Wu, and Gao (Citation2009) reported that enhancement of Bacillariophyta after “Kaemi” typhoon in 2016. Even on the coast of Western Gulf of Mexico the total phytoplankton cell abundance and Bacillariophyta cell abundance was observed higher after the four super tropical cyclones (Angles, Jordi, and Campbell Citation2015). These reports suggesting the significance of phytoplankton community enhancement after typhoon effect, however, some studies have shown insignificance (Fu et al. Citation2009).
In the present study, to explore the effects of typhoon and KC intrusion on the spatial distribution of phytoplankton in the neSCS, we traced the typhoon and collected total 196 samples from the neSCS before and after the typhoon “Roke” and “Haitang.” This study may yield a better understanding of the typhoon influence on phytoplankton communities in the neSCS.
Materials and methods
Study area and sampling stations
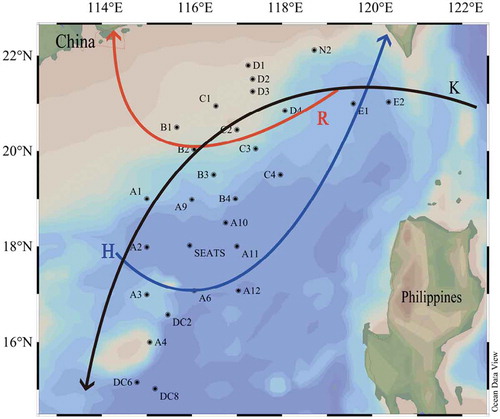
The cruise was carried out from latitude 15° ~ 22°N, and longitude 114° ~ 120°E from 12th July to 11th August in summer 2017 by the RV “Dongfanghong 2“ in the neSCS covering 28 stations with a total of 196 seawater samples (). The two typhoons “Roke” and ”Haitang” were occurred during the sampling, thus the study area was deeply impacted. According to the direction of the two typhoons, the section R (including the Roke typhoon unaffected stations E1, D4 and C1, called pre-typhoon stations, and the Roke typhoon-affected stations C2, C3, B2, B1, called post-typhoon stations), and the section H (including the Haitang typhoons unaffected stations E1, D4, C4 and A10, called pre-typhoon stations, and the Haitang typhoon-affected stations SEATS, A2, A3, A6, and called post-typhoon stations) respectively. Meanwhile, the section K was selected according to the route of KC intrusion in the neSCS, (from station E1, E2, N2, D3, D4, C2, C3, B2, B3, A9, A1 to A2).
Figure 1. The investigation map in the neSCS (R: Typhoon Roke route; H: Typhoon Haitang route; K: Kuroshio current intrusion route)
Phytoplankton and nutrients analysis methods
At each site, seawater samples were collected at different depths: 5, 25, 50, 75, 100, 150 and 200 m, using a Rosette sample equipped with CTD (seabird 917 Plus). Simultaneously, CTD data of water temperature, salinity, and depth also were recorded. For phytoplankton analysis, water samples were fixed in 2% buffered formalin and placed in the dark area until further analysis. The seawater samples also collected for the nutrient analysis: nitrate, nitrite, inorganic phosphate, and silicate by following standard protocol Grasshoff, Kremling, and Ehrhardt (Citation1999). In the laboratory 100 mL of phytoplankton samples enumerated and identified as Utermöhl method described by (Sun, Liu, and Qian Citation2002b) under an inverted microscope (Motic AE 2000). The phytoplankton identification was carried out as described by Jin, Chen, and Huang (Citation1965), Isamu (Citation1991), Sun and Liu (Citation2002a) and Sun, Liu, and Qian (Citation2002b).
The diversity of phytoplankton community structure was acquired by the Shannon–Wiener’s index (H’), Pielou’s index (J) and the dominant index(Y) by following protocols (Shannon and Weaver, Citation1949; Pielou Citation1969; Sun and Liu Citation2004).
The Ocean Data View (ODV) was used to analyze the obtained data: temperature, salinity, and phytoplankton distribution. In addition, the vertical distribution of phytoplankton abundance was analyzed by Grapher 10.0. SPSS software (version 14.0) was used to carry out the correlation analysis between the phytoplankton community and the environmental factors.
Results
Environmental characteristics of the survey area
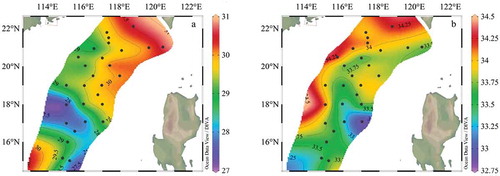
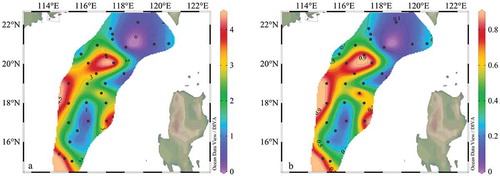
The sea surface temperature (SST) and salinity varied from 27.3 ~ 30.7°C ()), and 32.8 ~ 34.3 PSU ()) respectively. Both temperature and salinity were gradually decreased from offshore to the open sea. The lower temperature and high salinity in the central and southern survey area were caused by the past influence of typhoons “Rock“ and ”Haiang.”
Figure 2. The temperature (a) and salinity (b) distribution of 5 m water depth in the survey area
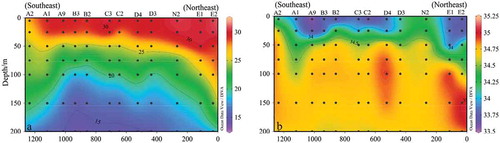
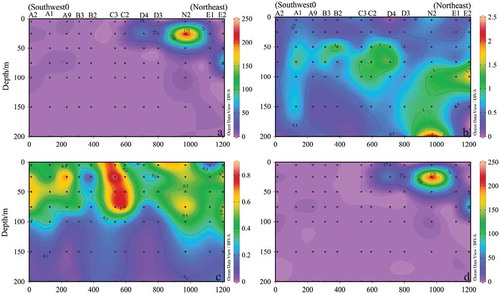
Further, the sectional plane distribution of temperature and salinity in the K section are shown in . Figures show as the KC intrusion distance increases gradually (from northeast to southwest), the effect of KC on the SCS was gradually weakened, and the surface temperature gradually decreases, along with increased salinity. Station E1 and E2, which were most affected by the KC, were composed of mixed water masses. The surface seawater has shown high temperature and low salinity, and the deep seawater has shown low temperature and high salinity, due to the phenomenon caused by the intrusion of subsurface KC water to the surface waters in SCS (Fu et al. Citation2009).
Figure 3. Sectional distribution of temperature (a) and salinity (b) in section K
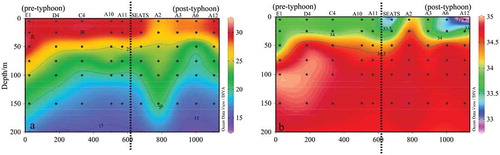
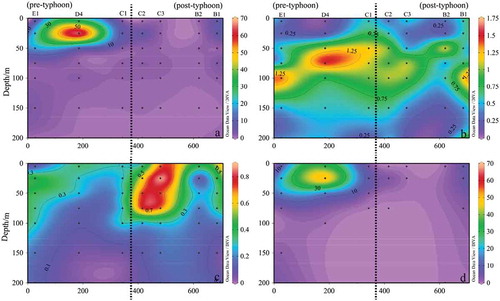
& showing the temperature and salinity distributions of R and H sections. It was observed that both temperature and salinity in the surface of seawater were lower than those that were not affected by the typhoon. The typhoon also brought the high salinity seawater from the sub-surface layer at some stations, i.e. A2 and B1.
Figure 4. Sectional distribution of temperature (a) and salinity (b) in section R
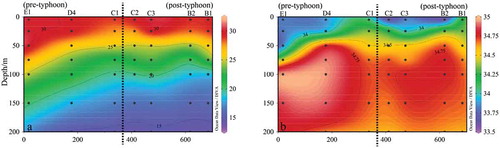
Figure 5. Sectional distribution of temperature (a) and salinity (b) in Section H
The phytoplankton species composition
A total of 299 phytoplankton species were identified belonging to 82 genera from the samples collected in the present investigation. Bacillariophyta was the most diversified group in which 159 species belonging to 56 genera were identified accounting 53.36% of all species richness in this study. It was followed by Dinophyta, which recorded 132 species belonging to 22 species accounting 44.29% of total species richness. However, Chrysophyta and Cyanophyta were also identified noticeably. Chaetoceros spp. was the predominated species of Bacillariophyta accounting for 13.21% of the species richness of Bacillariophyta. Whereas, Protoperidinium spp., was the most abundant species of Dinophyta with an account of 25% of species richness in dinophyta.
Further, it was observed that Richia intracellularis species belong to Cyanophyta can be symbiotic with three kinds of Bacillariophyta; Guinardia cylindrus, Rhizosolenia hebetata f. semispina and Rhizosolenia styliformis. In the study area the phytoplankton was dominated by temperate and warmer-water species, then followed by the tropical and subtropical species, and the cold-water species were the least.
The dominant species of phytoplankton in this survey were Trichodesmium thiebautii, Thalassionema nitzschioides, Thalassionema frauenfeldii, Prorocentrum lenticulatum, Thalassiosira minima, Prorocentrum minimum, Thalassiothrix longissima, Navicula spp., Prorocentrum compressum, Cyclotella striata, etc. The frequent occurrence of each dominant species is given in . Trichodesmium thiebautii mainly appeared in these offshore stations N2, E1, E2, B1, C1 D1, accounting 64.3% of its total cell abundance. Most of the Trichodesmium thiebautii mainly thrived in the surface waters (5 ~ 50 m) of the surveyed area, which was consistent with the previous study (Zhang and Dong Citation2007).
Table 1. Dominant phytoplankton species in the northeastern South China sea in summer 2017
Phytoplankton cell abundance
In this investigation, the cell abundance of phytoplankton ranged from 0.17 × 10³ cells L−1 to 236.46 × 10³ cells L−1 with an average of 5.28 × 10³ cells L−1 at different water layers. Cyanophyta cell abundance ranged from 0 to 235.34 × 10³ cells L−1 with an average of 4.27 × 10³ cells L−1. The abundance of Cyanophyta cells accounted for 80.87% of the total cell abundance. A large number of Trichodesmium thiebautii were observed at the Station N2 and it was also the maximum cell abundance species in the study area. The Bacillariophyta cell abundance ranged from 0.08 × 10³ cells L−1 to 11.21 × 10³ cells L−1 with an average of 0.65 × 10³ cells L−1, and it accounted for 12.33% of the total phytoplankton cell abundance. The cell abundance of dinophyta was between 0.01 × 10³ and 1.16 × 10³ cells L−1, and its average abundance was 4.27 × 10³ cells L−1.
Vertical distribution of phytoplankton
The vertical distribution of phytoplankton is shown in , indicating gradually decreased abundance with increasing depth.
Figure 6. Vertical distribution of phytoplankton cell abundance (Log base 10). (a): Phytoplankton; (b): Bacillariophyta;(c): Dinophyta; (d): Cyanophyta
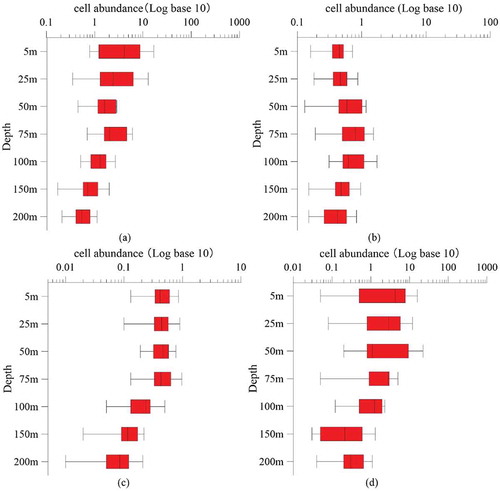
The abundance of Bacillariophyta cells showed a different trend with other phytoplankton groups of the subsurface maximum, and the maximum cell abundance appeared near the deep chlorophyll maximum (DCM) 75 m. While the maximum cell abundance of Cyanophyta was mainly located in the shallow water less than 50 m.
Horizontal distribution of phytoplankton
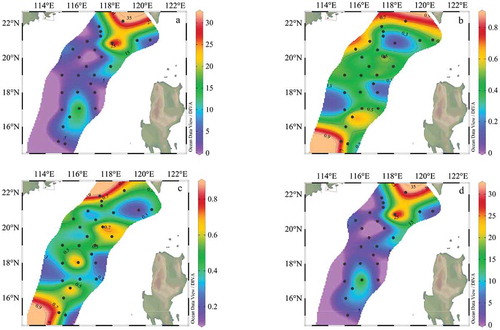
The horizontal distribution of surface phytoplankton cell abundance is shown in , it ranged from 0.79 to 32.2 × 10³ cells L−1 with an average of 6.76 × 10³ cells L−1. The maximum phytoplankton cell abundance was located in the offshore area and the northern part of this investigation (). It was followed by secondary higher cell abundance near the northwestern part of the Philippines with a higher abundance of dinophyta.
Figure 7. Horizontal distribution of phytoplankton cell abundance in the surface water layer (103 cells L−1). (a): Phytoplankton; (b): Bacillariophyta; (c): Dinophyta; (d): Cyanophyta
The horizontal distribution of top 10 dominant species of phytoplankton is shown in and . It shows Trichodesmium thiebautii, Thalassionema nitzschioides, Thalassionema frauenfeldii and Thalassiosira minima were gradually decreased in abundances from the offshore to the open sea. Among all Trichodesmium thiebautii was predominant species during this investigation.
Table 2. Horizontal distributions of the dominant species in the survey area
Figure 8. Horizontal distribution of dominant species (103 cells L−1). (a): Trichodesmium thiebautii; (b): Thalassionema nitzschioides; (c): Thalassionema frauenfeldii; (d): Prorocentrum compressum; €: Thalassiosira minima; (f): Prorocentrum minimum; (g): Thalassiothrix longissima; (h): Navicula spp.; (i): Prorocentrum compressum; (j): Cyclotella striata
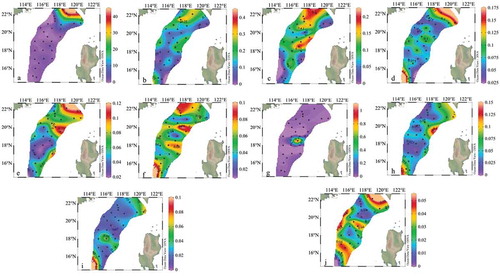
The maximum cell abundance of Trichodesmium thiebaultii and Thalassionema nitzschioides observed in the southwestern offshore area of the Taiwan island. However, the maximum cell abundances of Thalassionema frauenfeldii was found in both southwestern offshore area of the Taiwan island and the central part of this cruise. Similarly, the maximum cell abundance of the Thalassiosira minima was found in the southwestern offshore area of Taiwan island and the eastern part of the survey area, nevertheless, the maximum cell abundance of the Prorocentrum lenticulatum, Prorocentrum compressum, and Navicula spp. appeared in both southwest offshore area of Taiwan island and the southern part of the survey area. Moreover, the maximum cell abundances of Prorocentrum minimum and Cyclotella striata was also observed in the offshore area of the southwestern of Taiwan island and the central and southern parts of the survey area.
Phytoplankton community diversity
Shannon–Wiener diversity index (H’) and Pielou’s evenness index (J) were analyzed in this study (Sun and Liu Citation2004). The phytoplankton species dominance distribution of this study is shown in , which are roughly consistent.
Figure 9. Horizontal distribution of Shannon–Wiener diversity index (a) and Pielou’s evenness index (b) surface for phytoplankton communities
The Shannon–Wiener diversity index ranged from 0.16 to 4.46 with an average of 2.16, the Pielou’s index ranges from 0.03 to 0.88 with an average of 0.46. Notably, the highest value of the Shannon–Wiener index and Pielou’s index all appeared in the middle of the survey area, whereas, the lowest indices located in the northeast part of this study area. This pattern is consistent with the phenomena of the low biodiversity and high cell abundance in the previous study (Xue, Sun, and Li Citation2016).
Discussion
Comparison with historical data
Due to fewer investigations of this study area on phytoplankton composition, therefore, we compared the similar region of SCS . In comparison, with previously published reports, it is clear that Bacillariophyta was dominant in species and cell abundance in the SCS, whereas, Cyanophyta had lower cell abundance. It is interesting that in this study the cell abundance of Trichodesmium thiebautii in the investigation area was particularly high, especially in survey sites near the Luzon Strait. This phenomenon was mainly due to the seasonal upwelling, freshwater flushing in summer, KC in the Western Pacific and mesoscale eddies (Yin, Qian, and Wu Citation2001; Xie, Xie, and Wang Citation2003; Caruso, Beardsley, and Gawarkiewicz Citation2004; Centutioni, Niiler, and Lee Citation2004). It was reported that Trichodesmium is widely distributed in the western boundary currents of the western Pacific Ocean (Li, Lin, and Yang Citation2008), and mixed often with South China Sea (Capone, Zehr, and Paerl Citation1997). Warm eddies exist in the southern Luzon Strait all the year round, together with KC intrusion, which can bring abundant Trichodesmium to the neSCS (Chang, Chiang, and Gong Citation2000).
Table 3. Historical data of the phytoplankton community in the northern South China sea in summer
Phytoplankton and its controlling environmental factors
The nutrient concentration determines the growth and distribution of marine phytoplankton (Xu Citation2007). Previous studies have shown that in summer, the northern SCS was limited by phosphorus in addition to nitrate (Xu Citation2007; Chen and Chen Citation2006). Correlation analysis has been carried out to better understand the driving environmental factors to phytoplankton abundance in this study (). Results show a significant positive correlation of silicate and Bacillariophyta, which may the attribution of the utilization of silicate by Bacillariophyta for their siliceous cell wall formation.
Table 4. Pearson correlation between phytoplankton and environmental factors
Dinophyta was positively correlated with temperature and phosphate and was negatively correlated with salinity and nitrate. The influence of silicate on the growth of Cyanophyta was not significant as it was mainly controlled by phosphate. Dominance species Trichodesmium thiebautii in this study has strong nitrogen fixation capacity, so its growth was mainly restricted by the concentration of phosphate in the neSCS. Together, it shows temperature, nitrate, silicate, and phosphate were the major controlling factors for the distinct groups of phytoplankton in the neSCS.
The impact of KC intrusion on phytoplankton species composition in SCS
It was found that the intrusion of KC into the South China Sea would cause phytoplankton blooms, which lasted from November to February of next year and reached the peak of phytoplankton blooms in December (Shang et al. Citation2012).
The regional structure of phytoplankton blooms is twin-core structure, one of which is located in the deep basin to the northwest of Luzon strait, the other in the Babuyan Channel (Shang et al. Citation2012). In our study, the distribution of phytoplankton in the Kuroshio-track section (K section) was shown in (cf. ), KC subsurface water intrudes from northeast to southwest in this section. It was obvious that Cyanophyta, mainly the species Trichodesmium thiebautii, was majorly distributed in the Luzon strait and suddenly decreased in the southwest part of the survey area ()). Meanwhile, the Bacillariophyta were also slightly decreased after the intrusion of KC ()), mainly consisting of Thalassionema nitzschioides and Thalassionema frauenfeldii. On the contrary, dinophyta were mainly distributed in shallow water, less than 100 m and showed higher cell abundance at C2 and C3 stations, possibly due to the influence of the typhoon “Roke” ()). The influence of KC on phytoplankton in the study area was mainly manifested that there was no obvious change in the abundance of dinophyta cells, and lightly decreased of Bacillariophyta along the intrusion passage of KC ()). The cell abundance of Trichodesmium thiebautii decreased significantly along with the intrusion of KC ()). Therefore, it can be deduced that the Trichodesmium thiebautii was a major dominant species brought into SCS by the intrusion of the KC.
Figure 10. Sectional distribution of phytoplankton abundance in Section K (103 cells L−1). (a): Phytoplankton; (b): Bacillariophyta; (c): Dinophyta; (d): Trichodesmium thiebautii.
The impact of the typhoon on phytoplankton
During the sampling, we met two typhoon events, namely “Roke“ and “Haitang“. Subsequently, the sampling was carried out to study the phytoplankton community structure influenced by typhoons. The distribution of phytoplankton in the typhoon-track ”Roke” section (R section, cf. ) is shown in , in which the distribution pattern of phytoplankton was mainly contributed by that of Cyanophyta. It was obvious that Cyanophyta was disappeared sharply after typhoon ”Roke,” while during the typhoon, Bacillariophyta were mainly distributed in the subsurface seawater, and after the typhoon, its cell abundance decreased. After the typhoon, dinophyta were mainly distributed in the shallow water layer of 100 m with highest cell abundance at stations C2 and C3 ()), and its cell abundance increases, mainly composed of Prorocentrum.
Figure 11. Sectional distribution of phytoplankton abundance in Section R (103 cells L−1). (a): Phytoplankton; (b): Bacillariophyta; (c): Dinophyta; (d): Cyanophyta
The distribution of phytoplankton in the typhoon-track “Haitang“ section (H section, cf. ) is shown in , it was similar to that of R section (). Phytoplankton cell abundance distribution was majorly determined by Cyanophyta. The Cyanophyta distribution was heavily affected by typhoon “Haitang“, it was only appeared at stations E1 and D4 in “pre-typhoon“ stage and disappeared in ”post-typhoon” stage ()). The influence of typhoon ”Haitang” was also mainly reflected in the decrease of abundance of diatoms cells in the subsurface, Bacillariophyta only has higher cell abundance in the 75 m water layer of stations A10 and C, and Thalassiothrix longissima was dominant there ()). As expected, Dinophyta obviously increased after the typhoon ”Haitang,” higher cell abundance existed in the shallow waters less than 100 m at Station SEATS, mainly contributing by the increasing of Prorocentrum and Oxytoxum ()).
Figure 12. Sectional distribution of phytoplankton abundance in Section H (103 cells L−1). (a): Phytoplankton; (b): Bacillariophyta; (c): Dinophyta; d: Cyanophyta
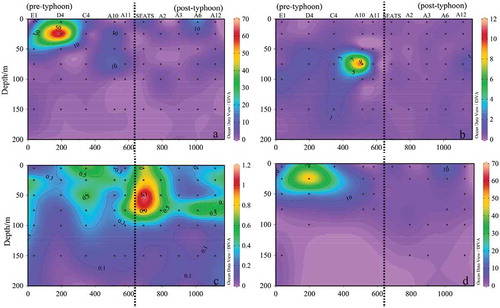
Overall, showing by our study, after the typhoons, the cell abundance of the total of phytoplankton was significantly reduced in the surface seawater, and the cell abundance of the subsurface seawater did not change significantly ( and ). Most interestingly the subsurface dinophyta abundance, were increasing significantly just after the passage of both two typhoons, “Roke“ and ”Haitang.”
Our study demonstrates a snapshot of the phytoplankton distribution just after the two typhoon events. Dinophyta was the most favored group of phytoplankton in the surface water driven by typhoon events and most of them were belonging to Prorocentrum spp. Though the abundance of the cell of diatom did not show any significant variation, simultaneously, Cyanophyta cell abundance showing a decreasing trend, nevertheless, it is uncertain to determine decreasing Cyanophyta was caused by either KC seawater intrusion or the typhoon.
Acknowledgments
We thank our colleagues Prof. Jianyu Hu from Xiamen University who provided the temperature and salinity data, and Dr. Weifang Chen also from Xiamen University for her assistance on cruise coordination. Satheeswaran Thangaraj helped on language and grammar check.
Disclosure statement
No potential conflict of interest was reported by the authors.
Additional information
Funding
Related Research Data
References
- Angles, S., A. Jordi, and L. Campbell. 2015. “Responses of the Coastal Phytoplankton Community to Tropical Cyclones Revealed by High-frequency Imaging Flow Cytometry.” Limnology and Oceanography 60 (5): 1562–1576. doi:10.1002/lno.10117.
- Capone, D. G., J. P. Zehr, and H. W. Paerl. 1997. “Trichodesmium, a Globally Marine Cyanobacterium.” Science 276 (5316): 1221–1229. doi:10.1126/science.276.5316.1221.
- Caruso, M. J., R. C. Beardsley, and G. G. Gawarkiewicz. 2004. “Interannual Variability of the Kuroshio Intrusion in the South China Sea.” Gayana 68 (2): 91–95. doi:10.1007/s10872-006-0076-0.
- Centutioni, L. R., P. P. Niiler, and D. K. Lee. 2004. “Observations of Inflow of Philippine Sea Surface Water into the South China Sea through the Luzon Strait.” Journal of Physical Oceanography 34 (1): 113–121. doi:10.1175/1520-0485(2004)034<0113:ooiops>2.0.
- Chang, J., K. P. Chiang, and G. C. Gong. 2000. “Seasonal Variation and Cross-shelf Distribution of the Nitrogen-fixing Cyanobacterium, Trichodesmium, in Southern East China Sea.” Continental Shelf Research 20 (4/5): 479–492. doi:10.1016/S0278-4343(99)00082-5.
- Chen, L. Y. L., and H. Y. Chen, 2006. “Seasonal Dynamics of Primary and New Production in the Northern South China Sea: The Significance of River Discharge and Nutrient Advection“. Deep-Sea Research Part A: Oceanographic Research Papers, 53: 971–986. doi: 10.1016/j.dsr.2006.02.005.
- Cione, J. J., and E. W. Uhlhorn. 2003. “Sea Surface Temperature Variability in Hurricanes: Implications with respect to Intensity Change.” BOSTON: Monthly Weather Review 131: 1783–1796. doi:10.1175/2562.1.
- Fu, D., D. Pan, Y. Ding, and J. Zou. 2009. “Quantitative Study of Effects of the Sea Chlorophyll-a Concentration by Typhoon Based on Remote-sensing.” [In Chinese.] Acta Oceanologica Sinica 31 (3): 46–56. doi:10.3321/j.issn:0253-4193.2009.03.006.
- Grasshoff, K., K. Kremling, and M. Ehrhardt. 1999. Methods of Seawater Analysis, Third Ed. Weinheim, Germany: VerlagChemie.
- Guan, B., and Y. Yuan. 2006. “Overview of Studies on Some Eddies in the China Seas and Their Adjacent Seas. I. The South China Sea and the Region East of Taiwan.” Acta Oceanologica Sinica 28 (3): 1–16. doi:10.3321/j.issn:0253-4193.2006.03.001.
- Harvell, C. D. 2002. “Climate Warming and Disease Risks for Terrestrial and Marine Biota.” Science 296 (5576): 2158–2162. doi:10.1126/science.1063699.
- Isamu, Y. 1991. Illustrations of the Marine Plankton of Japan. Third Ed, 1–158. Tpkyo: Hoikusha Press.
- Jansen, M. F., R. Ferrari, and T. A. Mooring. 2010. “Seasonal versus Permanent Thermocline Warming by Tropical Cyclones.” Geophysical Research Letters 37 (3): L03602. doi:10.1029/2009GL041808.
- Jin, D., J. Chen, and K. Huang. 1965. Chinese Marine Planktonic Diatoms, 1–230. Shanghai: Shanghai Scientific & Technical Press.
- Ke, Z., L. Huang, and Y. Tan. 2011. “Species Composition and Abundance of Phytoplankton in the Northern South China Sea in Summer 2007.” [In Chinese.] Journal of Tropical Oceanography 30 (1): 131–143. doi:10.3969/j.issn.1009-5470.2011.01.020.
- Le, F., J. Sun, X. Ning, S. Song, Y. Cai, and C. Liu. 2006. “Phytoplankton in Northern South China Sea in Summer 2004.” [In Chinese.] Oceanologia Et Limnologia Sinica 37 (3): 238–248. doi:10.3321/j.issn:0029-814X.2006.03.008.
- Li, G., Y. Wu, and K. Gao. 2009. “Effects of Typhoon Kaemi on Coastal Phytoplankton Assemblages in the South China Sea, with Special Reference to the Effects of Solar UV Radiation.” Journal of Geophysical Research 114: G4. doi:10.1029/2008JG000896.
- Li, T., M. Lin, and Q. Yang. 2008. “Studies on a Trichodesmium Erthraeum Red Tide in Daya Bay.” Marine Environmental Science 27 (3): 224–227.
- Lin, I. I. 2012. “Typhoon-induced Phytoplankton Blooms Sand Primary Productivity Increase in the Western North Pacific Subtropical Ocean.” Journal of Geophysical Research: Oceans 117: 1–15. doi:10.1029/2011JC007626.
- Lin, I. I., C. H. Chen, I. F. Pun, W. T. Liu, and C. C. Wu. 2009. “Warm Ocean Anomaly, Air Sea Fluxes, and the Rapid Intensification of Tropical Cyclone Nargis (2008).” Geophysical Research Letters 36 (3): L03817. doi:10.1029/2008GL035815.
- Pielou, E. C. 1969. An Introduction to Mathematical Ecology, 1–286. New York: Wiley Interscience.
- Sakaida, F., H. Kawamura, and Y. Tobe. 1998. “Sea Surface Cooling Caused by Typhoons in the Tohoku Areain August 1989.” Journal of Geophysical Research 103 (C1): 1053–1065. doi:10.1029/97JC01859.
- Shang, S., L. Li, J. Li, J. Li., Y. Li, G. Lin, and J. Sun. 2012. “Phytoplankton Bloom during the Northeast Monsoon in the Luzon Strait Bordering the Kuroshio.” Remote Sensing of Environment 124 (9): 38–48. doi:10.1016/j.rse.2012.04.022.
- Shannon, C. E., and W. Weaver. 1949. The Mathematical Theory of Communicaion, 1–125. Urbana IL: University of Illinois Press.
- Sriver, R. L., and M. Huber. 2010. “Modeled Sensitivity of Upper Thermocline Properties to Tropical Cyclone Winds and Possible Feedbacks on the Hadley Circulation.” Geophysical Research Letters 37 (8): L08704. doi:10.1029/2010GL042836.
- Su, J. 2004. “Overview of the South China Sea Circulation and Its Influence on the Coastal Physical Oceanography outside the Pearl River Estuary.” Continental Shelf Research 24: 1745–1760. doi:10.1016/j.csr.2004.06.005.
- Su, J., and Y. Yuan. 2005. Offshore Hydrology of China, 250–296. Beijing: China Ocean Press.
- Sun, J. 2011. “Marine Phytoplankton and Biological Carbon Sink.” Acta Ecologica Sinica (in Chinese) 31 (18): 5372–5378.
- Sun, J., and D. Liu. 2002a. “The Preliminary Notion on Nomenclature of Common Phytoplankton in China Sea Waters.” Oceanologia Et Limnologia Sinica (in Chinese) 33 (3): 271–286. doi:10.3321/j.issn:0029-814X.2002.03.008.
- Sun, J., and D. Liu. 2004. “The Application of Diversity Indices in Marine Phytoplankton Studies.” [In Chinese.] Acta Oceanologica Sinica 26 (1): 62–75. doi:10.3321/j.issn:0253-4193.2004.01.007.
- Sun, J., D. Liu, and S. Qian. 2002b. “A Quantative Research and Analysis Metthod for Marine Phytoplankton: An Introduction to Utermöhl Method and Its Modification”.” Journal of Oceanography of Huanghai & Bohai Seas (in Chinese) 20 (2): 105–112. doi:10.3969/j.issn.1671-6647.2002.02.016.
- Tang, D., and G. Sui. 2014. Typhoon Impact and Crisis Management, 7–15. Berlin, Heidelberg: Springer Press.
- Tsuchiya, K., V. S. Kuwahara, T. Yoshiki, N. Ryota Hideo, K. Norikazu, T. Kikuchi, and T. Toda. 2014. “Phytoplankton Community Response and Succession in Relation to Typhoon Passages in the Coastal Waters of Japan.” Journal of Plankton Research 36 (2): 424–438. doi:10.1093/plankt/fbt127.
- Wang, L., K. H. Lau, C. H. Fung, and J. P. Gan. 2007. “The Relative Vorticity of Ocean Surface Winds from the QuikSCAT Satellite and Its Effect on the Genesis of Tropical Cyclones in the South China Sea.” Tellus A 59 (4): 1–8. doi:10.1111/j.1600-0870.2007.00249.x.
- Xie, S., Q. Xie, and D. Wang. 2003. “Summer Upwelling in the South China Sea and Its Role in Regional Climate Variations.” Journal of Geophysical Research 108 (C8): 3261. doi:10.1029/2003jc001867.
- Xu, J., 2007. “Nutrient Limitation in the Pearl River Estuary, Hong Kong Waters and Adjacent South China Sea Waters.” Dissertation Abstracts International. doi: http://respository.ust.hk/ir/Record/1783.1-3146.
- Xue, B., J. Sun, and T. Li. 2016. “Phytoplankton Community Structure of Northern South China Sea in Summer 2014.” [In Chinese.] Acta Oceanologica Sinica 38 (4): 54–65. doi:10.3969/j.issn.0253-4193.2016.04.005.
- Yang, B., Y. Hou, P. Hu, Z. Liu, and Y. Liu. 2015. “Shallow Ocean Response to Tropical Cyclones Observed on the Continental Shelf of the Northwestern South China Sea.” Journal of Geophysical Research: Oceans 120 (5): 3817–3836. doi:10.1002/2015JC010783.
- Yin, K., P. Qian, and M. Wu. 2001. “Shift from P to N Limitation of Phytoplankton Growth across the Pearl River Estuarine Plume during Summer.” Marine Ecology Progress Series 221: 17–28. doi:10.3354/meps221017.
- Zhang, X., and X. Lin. 2001. “Some Statistical Features of Tropical Cyclones Originating from Northeast South China Sea.” Journal of Tropical Oceanography (in Chinese) 20 (4): 61–67.
- Zhang, Y., and J. Dong. 2007. “Research Development of Marine Cyanobacteria Trichodesmium Spp.” [In Chinese.] Marine Sciences 31 (3): 84–88. doi:10.3969/j.issn.1000-3096.2007.03.018.
- Zhao, H., D. Tang, and Y. Wang. 2008. “Comparison of Phytoplankton Blooms Triggered by Two Typhoons with Different Intensities and Translation Speeds in the South China Sea.” Marine Ecology Progress Series 365: 57–65. doi:10.3354/meps07488.
- Zheng, G., and D. Tang. 2007. “Offshore and Nearshore Chlorophyll Increases Induced by Typhoon Winds and Subsequent Terrestrial Rainwater Runoff.” Marine Ecology Progress Series 333: 61–74. doi:10.3354/meps333061.
- Zhu, G., X. Ning, Y. Cai, Z. Liu, and C. Liu. 2003. “Studies on Species Composition and Abundance Distribution of Phytoplankton in the South China Sea.” Acta Oceanologica Sinica (in Chinese) 25 (2): 8–23.