
 ?Mathematical formulae have been encoded as MathML and are displayed in this HTML version using MathJax in order to improve their display. Uncheck the box to turn MathJax off. This feature requires Javascript. Click on a formula to zoom.
ABSTRACT
Introduction: Ecosystem services are the benefits delivering from the natural environment to human society. Ecosystem services are regarded as important tools for decision-makers to understand the impacts of land use and land cover (LULC) change. Outcomes: The dynamic of four primary ecosystem service indicators were assessed over 1984–2014 based on InVEST model and their responses to LULC changes have been analyzed by the ecosystem service change index (ESCI) and ecosystem service state index (ESSI). Our results confirmed the significant increment in land reclamation in Zhoushan City and over half of the reclamation area was used for human-induced urbanization and over a quarter for the fishery. For the whole territory, the most significant LULC conversions were observed between agricultural land and urban. The study period witnessed the degradation of habitat quality and soil sediment, an increment of the water yield and no significant change of carbon storage. Discussion and Conclusion: Most changes in LULC are significantly related to the dynamics of ecosystem services, which were more impacted in the reclamation area than the rest of the city. Our study highlights the importance of ecosystem service assessments for sustainable land planning and securing economic development.
Introduction
Ecosystems provide a wide variety of goods and services that benefit humanity, known as ecosystem services (Costanza et al. Citation1997; G. Daily Citation1997; Elliott et al. Citation2014),which have been recognized as the linkages bridging human and nature, accounting for environmental externalities and supporting conservation efforts (Raymond et al. Citation2013). Previous studies have indicated that rapid changes in land use may have a direct impact on ecosystems, resulting in the degradation of critical ecosystem services provided by natural or semi-natural ecosystem (Bryan Citation2013; Burkhard et al. Citation2009; Defries, Foley, and Asner Citation2004). Land-use conversion is the main driver of ecosystem alteration affecting the status and dynamics of ecosystem services (A.Foley et al. Citation2005; Goldstein et al. Citation2012; S. Li et al. Citation2018; Song and Deng Citation2017). Different change type of land use may affect multiple ecosystem services (Bennett, Peterson, and Gordon Citation2009; Bryan Citation2013; Bullock et al. Citation2011). And complex and multiple land-use changes may exert a cumulative impact on individual ecosystem service (Bryan Citation2013). Both positive and negative correlations between different ecosystem services can be found in different land-use conversions (R. S. de Groot et al. Citation2010; Tallis et al. Citation2008). Land-use change may enhance a specific ecosystem service at the expense of other ecosystem services. For instance, the expansion of agriculture land increases the provision of food and fiber, whereas bringing degradation of soil and water and a decrease of sediment regulation and species diversity (Bryan Citation2013; Swallow et al. Citation2009; Tallis et al. Citation2008). And some studies have evaluated the environmental impacts of land reclamation on coastal ecosystem and environments, and have confirmed land reclamation could induce environmental damages on the coastal ecosystem (Duan et al. Citation2016; Yu et al. Citation2017). However, the role of land reclamation in the dynamics of ecosystem services still needs further exploration, and ecosystem services in coastal areas are expected to have long-term traces.
For centuries, human civilization has been congregated at coastlands and deltas due to the multiple eco-benefits provided by their geographical characteristics (El Banna and Frihy Citation2009; Stanley and Warne Citation1998; Zhang et al. Citation2005). Advances in agriculture, science, and medicine have facilitated the exponential growth in populations, promoting human-induced land-use change, such as farmland expansion, rapid industrialization and sea-ward land reclamation in the coastal cities (Schwarz, Lautenbach, and Seppelt Citation2011; Watson et al. Citation2000; Zhao et al. Citation2004). The natural environment was strongly affected by human activities, and these influences could intensify in the coming decades, especially in ecologically sensitive areas (Watson et al. Citation2000). These impacts may enlarge on the islands due to their ecological sensitivity. Islands are usually highlighted as the important ecological habitat and ecologically sensitive areas to human activities, because of the high biodiversity of creatures and future probability of habitat loss (Whittaker Citation2007). Land reclamation, regarded as an intensive land-use change, may have devastating impacts on ecosystem processes and ecosystem services. The reclamation can transform the entire region in a relatively short period (Ghazali Citation2006) and subsequently affect the surrounding environment.
Ecosystem service assessment played a significant role in ecosystem service management. Decision-makers may focus more on beneficial outcomes of ecosystem services and the natural process which provide and deliver the ecosystem services with the aid of ecosystem service assessments (Armsworth et al. Citation2007; G. Daily Citation2000; Wong et al. Citation2015). To better understand the economic value and contribution supported by ecosystem services, monetary approaches, such as cost-benefit valuation, contingent valuation, and willingness-to-pay assessment, are usually associated with ecosystem services evaluation (Jim and Chan Citation2016; Silvertown Citation2015; Society and Applications Citation2013). However, the outcomes of monetary approaches are often despondent because of the excessive economic focus and improper value estimates for ecosystem services without active markets (Burkhard et al. Citation2012), as well as the subjective biases of evaluation from different estimators.
Mapping ecosystem services can enhance awareness of natural resources and their benefits, allowing multiple stakeholders and decision-makers to achieve efficient ecosystem service management schemes that meet both individual and social needs. The increasing demands for spatial analysis regarding ecosystem services have prompted current research to develop spatial assessment frameworks. Several spatiotemporal ecosystem services assessment tools, such as InVEST (Integrated Valuation of Ecosystem Services and Tradeoffs), SolVES (Social Values for Ecosystem Services), EVT (Ecosystem Valuation Toolkit), ARIES (ARtificial Intelligence for Ecosystem Services), and TESSA (Toolkit for Ecosystem Service Site-based Assessment), have boosted the evaluation of ecosystem services by providing visible and spatially heterogeneous maps (Posner et al. Citation2016). In this study, we utilized the InVEST model, which is a geospatial modeling framework for assessing the impact of LULC changes on ecosystem services (Leh et al. Citation2013). It provides a socio-ecological framework, generating ecosystem service maps that visualize the correlation between land use and ecosystem services, and the trade-offs between individuals and multiple ecosystem services (G. C. Daily et al. Citation2009; Goldstein et al. Citation2012). SolVES and EVT were the toolkits for calculating the social and economic values of natural capital. TESSA was widely applied on a site scale to trace and measure ecosystem services, and ARIES was used to monitor trade-offs between ecosystem services. InVEST could be more suitable and accessible for a city-scale study to evaluate the ecosystem services and their responses to LULC change.
This project assessed the environmental impacts of land-use change on variable ecosystem services in an island city, with a focus on reclamation areas. The assessment was captured by exploring the quantitative indices to understand the relationship and linkages between ecosystem services and land-use change in Zhoushan islands with those specific objectives: (1) to monitor and quantify the LULC change on the local and reclamation area scale, (2) to quantify ecosystem services that were affected by LULC change on different scales, (3) to develop quantitative indices to measure the change and status of ecosystem services, (4) to analyze the linkages between LULC change, land reclamation, and ecosystem services. Compared with other literatures, this study can be highlighted in three aspects: (1) The unique study focused on the ecosystem services in the island city and the reclamation area along coastlines. (2) We validated the InVEST model with long-time spatial data in Zhoushan City. (3) We monitored the change of LULC and ecosystem services in a short-time interval within a long-time study period.
Methodology and study area
Study area
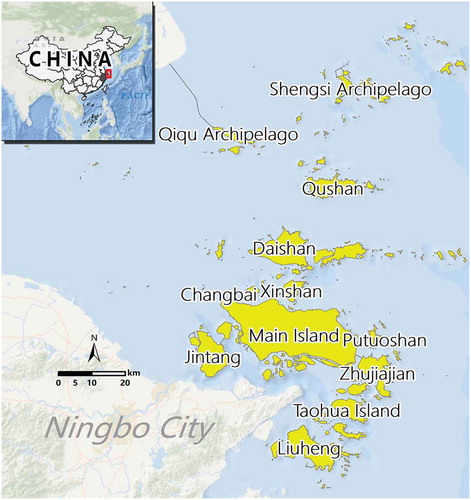
Zhoushan City is located on the East China Sea opposite to the Hangzhou Bay (between 29°32′N and 31°04′N latitude, and between 121°30′E and 123°25′E longitude) as shown in (the most important islands were labeled with names). It consists of 1390 islands, of which only 103 are inhabited with the total population about 986,000 (Wikipedia Citation2019). The rest were enclosed environment without human activities. This city will become one of the most important sea routes in the East China Sea due to its location and 2447.87 km coastline (China.com Citation2018). In 2011, it was designated as Zhoushan Archipelago New Area by the Chinese government, which is the first state-level developing area with the marine theme in China (Xinhua Citation2011). Currently, about 45 islands have a proficiency for deep-water ports. Furthermore, it is the biggest fishing ground in China providing a broad range of aquatic products (Wikipedia Citation2019).
Figure 1. The location of Zhoushan City in China
Land use and land cover(LULC)change
A database containing LULC information of Zhoushan city (lacking information about the reclamation area) at six time points (1984, 1990, 2000, 2005, 2010 and 2014) was applied in this paper and it was provided by the Chinese Ministry of Environmental Protection. The LULC categories include urban, wetlands, waters, agricultural land, forests and barren to trace the LULC changes in the study period.
The land reclamation and the coastline identification applied visual image interpretation. Images from Landsat Multispectral Scanner with 80 m resolution were used for drawing the coastline of Zhoushan City in 1975, which was regarded as the baseline of land reclamation in this study. The images from Landsat Thematic Mapper with 30 m resolution were applied for the LULC classification of 1984, 1990, 2000, 2005 and 2010 in reclamation area. The images from Landsat Operational Land Imager with 30 m resolution were applied for 2014. The satellite imagery for LULC classification was available at the U.S. Geological Survey website (https://glovis.usgs.gov/) with TIF format. The details of these images can be found in .
Table 1. The detailed information about the images used for LULC classification
We analyzed each LULC category in Zhoushan city and divided it into two scales: city scale and reclamation scale. The city scale refers to the entire territory of Zhoushan city, including inland areas and new reclamation areas. The reclamation scale focuses on the new reclamation area.
Additionally, we used the transfer matrix to reflect the features of LULC changes. To match the resolution of other raster data (e.g., Digital Elevation Map), the LULC maps were resampled to 10 m after interpretation.
Mapping of primary ecosystem services indicators
According to previous research, ecosystem services can be divided into 17–25 different functions or processes (Costanza et al. Citation1997; Rudolf S. de Groot, Wilson, and Boumans Citation2002; Hein et al. Citation2006; Millennium Ecosystem Assessment Citation2005; Raudsepp-Hearne, Peterson, and Bennett Citation2010). For our study, we selected four primary ecosystem services that have been and will continue to be affected by land reclamation and artificial activities. The four ecosystem services are 1) habitat quality, 2) carbon storage, 3) soil sediment and 4) water yield. We used InVEST (version 2.5.1) to model the changes of the critical ecosystem services (including habitat quality, carbon storage, soil sediment, and water yield) from 1984 to 2014 in Zhoushan City. The InVEST is a suite of spatially and temporally based modeling tools used to quantify a variety of ecosystem services and their trade-offs (Crossman et al. Citation2013; Mushet, Neau, and Euliss Citation2014; Tallis and Polasky Citation2009). Because the InVEST model is designed for worldwide application, some functions involving in the model are general functions without local features. We replaced functions (4) – (10) in the soil sediment module with the results from local studies for better results.
Habitat quality
The Habitat Quality pattern evaluates the ecological quality of LULC changes. The following four factors are considered in the Habitat Quality model: recognition of habitat from LULC categories, threats posed to habitat, the sensitivity of habitat to threats, and the longest influence distance of threats. The LULC maps are transformed into a habitat map by defining what LULC counts as habitat. Dxj represented the total threat level in grid x whose LULC type is j (Sharp et al. Citation2016):
where Dxy is the degradation score. R indicates the set of threats, y represents the cell with threat setting on a threat raster map and Yr indicates the set of all the threat cells in the raster map. wr, within the data from 0 to 1, means the relative threat degree of a threat source r to the different habitat type. The impacts of the threat r are also decreased with the distance between the grid cell y and grid cell x, shown as iexy here, βx is the accessibility of the grid cell x, with the value ranging from 0 to 1, where the larger means the more accessible. Sjr is the sensitivity of habitat type j to the threat r and greater sensitivity is with larger figure (the maximum is 1). When the Sjr is equal to zero, Dxj is no longer an equation about the threat r.
The translation from Dxy into Qxj (Habitat quality score) is applied a half-saturation function with a user-defined constant. The relationship between the degradation score and habitat quality score is negative. The habitat quality score in grid cell x with the habitat type j is identified as the Qxj (Sharp et al. Citation2016):
where z (z = 2.5 in this paper) and each habitat type is assigned a habitat score Hj, from 0 to 1 where the 0 means this habitat is not a suitable habitat for the target species or human. The half-saturation constant is given by k which is the same as the D when the .
The main threats considered in this paper were human activities, including the expansion of cities, roads, and agricultural lands. According to landscape ecology and conservation biology studies, the habitat type’s sensitivity to threats would be tailored to different cases (Polasky et al. Citation2011). The levels of sensitivity and the maximum effective distance as well as the decay types of the threats are determined by expert knowledge and previous literature.
Soil sediment module
The InVEST sediment delivery model allows the generation of mapping overland soil sediment and allows it to be transported into the stream (Sharp et al. Citation2016). The amount of soil sediment was measured by the difference between the amount of potential and actual soil erosion (Sharp et al. Citation2016). The following function can express it:
where SC means soil sediment (tons ha−1 year−1). Rainfall erosivity factor (R) was based on the research in Fujian Province of China (Fujian et al. Citation1995) and the unit of R is . The model to estimate the rainfall erosivity used average monthly precipitation data (Pm) and is described as:
Soil Erodibility Factor (K) was calculated by EPIC function (Sharpley and Williams Citation1990):
where K presented soil erodibility factor (0.1317 * t * hm2 * h * hm-2 * MJ-1 * mm-1), ,
and
respectively presented sand content, silt content and clay content in soil (%).
indicated the organic content of particular soil type. The soil structure data were from the second national soil survey. Because the classification standard of soil particles was different between China and USA, the quadratic spline interpolation was used to evaluate the percentage of soil content according to Chinese standard.
The topographic factor (LS) was the most sensitive parameter of Universal Soil Loss Equation/Revised Soil Loss Equation (USLE/RUSLE) and was calculated with the following functions (Desmet and Govers Citation1996):
where S and L present the steepness factor and slope length factor, respectively. was the degree of slope (°),
was the flow accumulation,
was the resolution of the raster map (m), and
was the flow direction. Cover management factor (C) is a related constant accounting for how land cover, crops and crop management cause soil losses compared to that occurring in the bare fallow (Kinnell Citation2010). Support practice factor (P) accounted for control practices that reduce the potential erosion of runoff by their influence on the soil surface. C-factor and P-factor both ranged from 0 to 1. In this study, we obtained the data from relevant literature and research (Sharp et al. Citation2016).
Carbon storage
The carbon storage model in InVEST evaluated carbon stored in carbon pools, such as aboveground biomass, belowground biomass, soil, and dead organic matter. In the InVEST model, the amount of carbon stored in these pools was derived from the LULC maps. In the instruction of InVEST, it has been pointed out that the aboveground biomass consists of all living plant material above the soil (e.g., bark, trunks, branches, leaves). Belowground biomass encompasses the living root systems of aboveground biomass. Soil organic matter is the organic component of the soil and represents the largest terrestrial carbon pool. Dead organic matter includes litter as well as lying and standing dead wood (Sharp et al. Citation2016). The total carbon storage sum up those four carbon pools:
With means the total carbon storage in grid cell i of LULC type j.
The carbon storage data are based on the detailed ecosystem classification found in the final report of the project “National Ecosystem Survey and Assessment of Zhejiang Province (2000–2010)”(The People’s Government of Zhejiang Province Citation2015). We expanded the timeline from 1984 to 2014 based on that classification.
Water yield
The water yield model, which is based on the Budyko curve and annual average precipitation, estimated the contribution from different LULC classes to annual surface water yield (Sharp et al. Citation2016). The annual water yield y (x) for each grid with LULC type x is as follows (Sharp et al. Citation2016):
For forest, the relationship between actual evapotranspiration and precipitation is followed:
where AE(x) and P(x) is the annual actual evapotranspiration and precipitation on grid x. PET(x) is the annual potential evapotranspiration.
where ET0(x) means the reference evapotranspiration and is the vegetation evapotranspiration coefficient. ET0(x) is affected by local climatic conditions.
is an empirical parameter which characterizes the natural climatic-soil attributes:
AWC (x) is defined as the amount of water that can be used by a plant in the soil, which is affected by the soil texture and effective rooting depth. It is related to the minimum of vegetation rooting depth and root restricting layer depth, and the plant available water capacity (PAWC). z is an empirical constant, known as “seasonality factor,” which captures the additional hydrogeological pattern and local precipitation characteristics.
For all other LULC, actual evapotranspiration is directly computed from ET0(x) and has an upper limit defined by P(x)(Sharp et al. Citation2016):
Ecosystem service change and status index
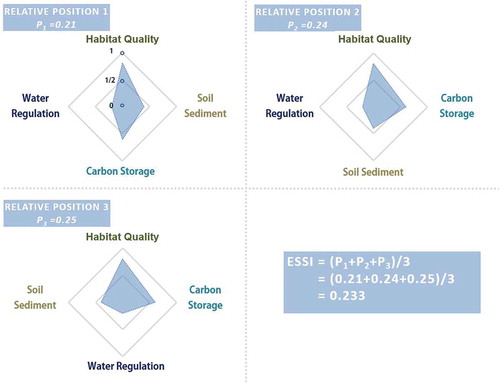
Ecosystem service assessments aim to qualify the status and dynamics of ecosystem service. Mapping the spatiotemporal variability of individual ecosystem services and the status of integrated ecosystem services can help explore the heterogeneity of ecosystem services on different scales (Leh et al. Citation2013). To analyze the status and change of ecosystem services, our research generated Ecosystem Services Change Index (ESCI) and Ecosystem Service Status Index (ESSI) to trace the situations. ESCI described the changes in ecosystem services throughout the study period, and ESSI was applied to demonstrate the status of synthetical ecosystem services. ESCI was calculated at short-time intervals to reveal the relationship between changes in ecosystem services and rapid urban expansion and reclamation. We did not determine the ESSI as the average of four ESCIs, which was easily affected by the extreme values. Instead, we identified ESSI as the area proportion of irregular polygon in the diamond, with different directions representing different ecosystem services to reduce the impact of extreme values and provide a better representation of ecosystem service status ().
Figure 2. Example of ESSI calculation: With the same value of four ecosystem services (2014), the relative position of the four in the diamond map resulting in a different irregular polygon which occupied different area of the total area. With four kinds of ecosystem services, there are three different relative positions which means three different display orders. In this example habitat quality, water yield, soil sediment, and carbon storage are equal to 0.8, 0.2, 0.4, and 0.6, respectively. The area proportions of different relative position (display orders) respectively yield 0.21, 0.24, and 0.25 which means the final figure for the ESSI, in this case, was 0.233 (the average of the three)
To measure the spatial and temporal change of ecosystem services, ESi was represented as an individual ecosystem service at the time i. The change of ecosystem services in a certain time interval can be specified by:
where ESCIx is the Ecosystem Service Change Index of ecosystem services X, ESCURxj and ESFORxj are ecosystem state value of ecosystem services X at time j and time i, separately.
As different ecosystem services have different units (habitat quality is with no unit, soil sediment and carbon storage are tons/hectare and water yield is millimeter), soil sediment, carbon storage, and water yield are normalized to 0–1 before the calculation of ESSI.
As shown in , in each diamond, the four directions represent four ecosystem services, and the four relative positions can be different, resulting in different display orders of the diamond. For the four ecosystem services, there were totally three display orders for them in the diamond map. Therefore, ESSI is defined as the average of the proportions under all possible displays. In this case, four ecosystem services are considered to assess the ecosystem services status.
where ESSI is the ecosystem service status index of the year j; P1, P2, and P3 present the respective area proportion of irregular polygon in the diamond under different display orders.
Spatial analysis was completed via ArcGIS (version 10.2.2). The effects of LULC changes were captured by analyzing ecosystem services along the timeline in LULC and regarding the ecosystem changes as the results of LULC transformation.
Results
Land use and land cover (LULC) change
City scale (entire study area)
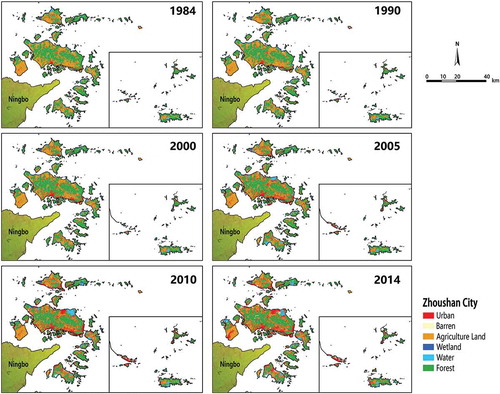
and illustrated the LULC changes of Zhoushan during the study period (1984–2014). Because of coastal reclamation, the territory of the Zhoushan City has increased remarkably from 125,956.70 ha in 1984 to 138,432.24 ha in 2014. By 2014, 44.71% of the territory was covered by forests mainly situated in the middle of the islands; Agricultural land, a buffer between forest and urban area, was 22.19%; Urban, which was usually near the coast, registered 24.02%. Urban expanded significantly over the study period from 6,350.30 ha (5.04%) to 33,253.17 ha (24.02%), and it replaced agricultural land as the second largest LULC category in 2014. The city core sited on the north coast of the main island and was accompanied by some extension along the coastline and neighboring islands in 1984. By 2005, a significant spread of urban can be observed on the east coast of the main island and Daishan island which is closest to the main island. By 2014, the reclamation on the north coast of the main island was remarkable and the natural coast close to the reclamation area also transferred into the urban from other LULC categories. With the evolution of city landscapes, agricultural land and forest decreased. The forest fluctuated slightly in the first 15 years, after 2000, it started to shrink from 68,373.46 ha in 2000 to 61,898.68 ha in 2014. The 35-year continuous decrease in agricultural land was more obvious to 30,712.52 ha in 2014, down 36.53% since 1984. The other LULC types (water, wetland and barren) occupied less than 10% in the study area. The changes in those LULC types were relatively small compared to the big three.
Table 2. The area and percentage of LULC from 1984 to 2014 in Zhoushan City. Ecosystem services in LULC (city scale) are represented by the percentage of ecosystem services provided by different LULC in total ecosystem services
Figure 3. The distribution of LULC in Zhoushan City on the city scale(1984–2014)
illustrates the converts of LULC in Zhoushan city during the study period. 71.49% of the total converts were related to urban. The most notable convert was from agricultural land to urban,12,311.59 ha accounting for 31.68%. Except for agricultural land, reclamation and forest were the other two main sources of urban with 29.38% and 10.31%, respectively.
Table 3. Transition Matrix of LULC Type from 1984 to 2014 (ha)
Reclamation area
In this research, the land reclamation area is the artificial land which has been reclaimed from the ocean (the reference year of land reclamation is 1975). The water in the reclamation area is usually used for fishery breeding or further landfilling. Before filling up the ocean, a dam bank is firstly built to determine the boundaries of land reclamation, and the encircled ocean will change to solid land in the future. Over the last 35 years, the expansion of coastal reclamation was extraordinary, from 2,468.04 ha in 1984 to 14,943.57 ha in 2014, with a notable increase rate of 505.48%. In 2014, the largest LULC type in this area was urban area, over 55%, followed by water (26.29%) and barren (9.95%). It should be noted that there were little agriculture land and no forest in the reclamation area (). The reclamation mainly occurred in the east and north coast of the main island, the south and east coast of Daishan island, and Qichu archipelago.
The LULC type with the most significant change was urban. In 1984, the urban was 55.40 ha, accounting for 2.24%. Urban kept a sustained growth during the entire study period, from 2000 to 2005 rising from 18.23% to 39.08%, and to 2014 up to 55.71%. The water had a relatively slow growth rate in which the area of water increased from 1,084.44 ha to 3,926.97 ha, but the water proportion of the reclamation area went down.
Ecosystem services (ES) change
Ecosystem services indices were analyzed on the city and reclamation-area scales. The average performances of the ecosystem services differed from each other.
On the city scale, habitat quality and soil sediment experienced a downward trend, from 0.47 to 0.30 and from 96.84 t/ha to 89.37 t/ha, respectively (). The output of water yield had a steady climb to 518.39 t/ha, except a decrease to 464.95 t/ha in 2000; within the carbon storage fluctuating (only slightly), over the same period (). The complex changes of ecosystem services (according to ESCI) can be detected in Zhoushan City. The improvement area in habitat quality was much lower than the degradation area. The significant deterioration started in 2000 and lasted for 10 years due to the rapid urbanization. No large area gaps were detected in soil sediment, carbon storage, and water yield. Combined with their average in , the degradation had a more extreme impact on the ecosystem because the area of degradation was smaller than improvement whereas the averages were stable. Additionally, an enormous variability existed in the distribution of ecosystem services according to the ESCI and ESSI.
Table 4. The average values of ecosystem services change index (ESCI) and the average values of ecosystem services status index (ESSI) from 1984 to 2014 on the city scale and reclamation-area scale. Habitat quality has no unit; the unit of soil sediment and carbon storage is ton per hectare (t/ha), and the unit of water yield is millimeter (mm). The unit of ESSI is the percentage (%)
Table 5. The degradation area and improvement area of habitat quality, carbon storage, soil sediment and water yield in Zhoushan City across the study period (city scale)
On the reclamation-area scale, ecosystem services varied more intensely. According to , the provision of ecosystem services on the reclamation-area scale was lower than that on the city scale, whereas water yield had the opposite performance as the decrease of the previous land surface. With the expansion of reclamation area, most ecosystem services deteriorated over time. Both habitat quality and carbon storage had a sharply consistent decrease. The trend over time of soil sediment on the city scale was very similar to that on the reclamation-area scale, but with higher overall values.
The overall status of ecosystem services represented by ESSI. ESSI ranged from 16.22 to 13.23 with a straightforward decease on the city scale. In the reclamation area, ESSI decreased from 11.65 to 4.40 and the average were lower than that on the city scale ().
Discussion
Land-use impacts on ecosystem services
The focus of this study is to detect the status and dynamics of four primary ecosystem services in an island city and their responses to the change in LULC, especially the human-induced reclamation. The terrestrial ecosystem (the main object of the ecosystem services research), is usually associated with a particular ecosystem service or ecological function (Burkhard et al. Citation2012; Goldstein et al. Citation2012; Lawler et al. Citation2014; Plieninger et al. Citation2013; Watson et al. Citation2000; Zorrilla-Miras et al. Citation2014). However, limited studies have paid attention to the ecosystem services change on islands, especially the reclamation areas. Islands may be more sensitive to environmental changes. Zhao et al. (Citation2004) and Xiao et al. (Citation2000) assessed the ecosystem services of Chongming island and Hainan island with ecological valuation, but the evaluation of the reclamation area was ignored. According to our study, the city landscape has been evaluated at a rapid speed since 1984. The significant conversion from agricultural land to urban land witnessed the development of economic structure in Zhoushan City. From 1984 to 1990, the primary industry occupied most of Zhoushan City’s Gross Domestic Product (GDP). In this regard, excluding forests, the dominated LULC type was agriculture land which supported the majority of GDP. After 1990, investment in public transportation facilities connecting the major islands and development of the marine economy lent supported the succedent transformation. During this period, the GDP of Zhoushan City increased from 2.46 billion CNY (Chinese Yuan) in 1990 to 101.53 billion CNY in 2014, while the industry structure of Zhoushan stepped into the service-industry dominated period (Statistical Bureau of Zhoushan Citation2015). The demand for land increased with the upgrade of instructional section, which resulted in a large amount of land reclamation. Consequently, this also contributed to the increase of urban land and water in the reclamation area and accompanied by a decrease in agriculture land. Due to the productive fishery in Zhoushan, planting agriculture was not considered as an essential contribution to the local economy, so re-planting of agriculture was not a high priority. With the decreasing of agricultural land, the water along the coastline (in reclamation area) has increased significantly since 1990.
Ecosystem services followed a similar pattern of distribution by LULC, with more than 80% of the ecosystem services detected in the forest and agriculture land which covered over 65% of the city, suggesting that these LULC are significantly critical for sustainable ecosystem services support. Urban lands and barren only provided very limited ecosystem services (). Many studies have identified forests as an important source for ecosystem services. On the global scale, the forest is regarded as the sources of timber supply and carbon storage for mitigation of climate change (Bellassen and Luyssaert Citation2014) as well as important sources of habitat to maintain biodiversity-related ecosystem services (Isbell et al. Citation2011). Regionally, the forest is a highly efficient provider of ecosystem services and is identified in hotspots of high percentage of ecosystem services in different regions (Egoh et al. Citation2009; Society and Applications Citation2013). However, the identification of importance of ecosystem services may affect the selection of ecosystem service indices in this study. As an island city, Zhoushan is surrounded by ocean, but marine ecosystem services were not taken into consideration in this research, which mainly focuses on terrestrial ecosystem services. The ecosystem services concerned in the marine ecosystem were different from that in the terrestrial ecosystem which attributed to the differences in organisms and biological interactions (Steele Citation1985). The results could differ from the current ones if more marine ecosystem services were involved in the evaluation. It also inflected the complex and specific features of ecosystem services and the demand for standardized ecosystem service indices for spatiotemporal comparison.
Ecosystem services in the reclamation area
This study confirmed that the ecosystem services in the reclamation areas were more degraded than that on a city scale, and this lent support to the profound influence of land reclamation on the coastal environment. The history of land reclamation in Zhoushan can be traced back to 1000 years ago. Reclamation can completely change the natural environment entirely in a very short period (Ghazali Citation2006). With increasing reclamation projects, the vegetation cover rate dropped, and the area of impervious surface grew (Lautenbach et al. Citation2011; Ruiz-luna Citation2014). Degradation of water quantity and quality cannot be ignored, especially on some small islands where groundwater conditions have completely changed (Ghazali Citation2006; Guo and Jiao Citation2007; Hu and Jiao Citation2014; Ni et al. Citation2019). Land reclamation also reduced the sediment accumulation rate, thus preventing new mud flats, which may provide essential habitats and ecosystem services (Ghazali Citation2006; Mai and Bartholomä Citation2000). Not only was the terrestrial ecosystem and environment affected, but also was the marine resources (Ge and Jun-yan Citation2011). The decreased diversity indices of phytoplankton and zooplankton were found during the marine reclamation projects (K. Li et al. Citation2010). Contaminants in marine sediments were rapidly accumulated due to development-induced human activities and land-fill waste (Buckley, Smith, and Winters Citation1995).
The objective of creating land was achieved with a higher fraction of urban areas. Although the ESSI in the reclamation area was always at a low level, a sudden drop was caught during the interval from 2000 to 2005 in line with the significant increase of urban areas. In this study, the food provision is excluded from the list of primary ecosystem services, but it is an important ecosystem service for our study area. The increasing demands for food have affected the food supply chains with consequent growth of water in the reclamation area. The water expanded to 29.55% of the reclamation with the booming of the fishing industry. The yield of this industry was from 19.6 thousand CNY in 1984 to 1.83 billion CNY in 2014 (Statistical Bureau of Zhoushan Citation2015), which represented a significant increase in food provision capacity.
Overall, the practice of reclamation has caused serious environmental damages to ecosystem services in the study area, and these damages can be substantial (Duan et al. Citation2016). In a few selected cases, the impacts of land reclamation on coastal ecosystem and surrounding areas have been recognized, but the mitigations should be further explored. Local governments should slowdown the paces of land reclamation before finding effective mitigation measures. The urban plans related to land reclamation should be approved after environmental argumentations among urban designers, decision-makers, and environment experts. Also, practical environmental advices and pre-construction environmental evaluation should be added to guidelines for contractors who undertake reclamation projects. The land reclamation projects can no longer be carried out at the expenses of environment any more.
Limitations and uncertainties
Although the original resolution of data from USGS was 30 m, the LULC maps were resampled to a 10 m resolution to match other input data in ecosystem service modeling. For the patches less than 900 m2, their information cannot represent very well for LULC categories with a 30 m resolution (Gan et al. Citation2014). In the absence of higher resolution data, some useful information about the relative impacts of LULC changes cannot be provided through the present database.
The reliability and accuracy of ecosystem services evaluation should be improved in the future studies. In this paper, Zhoushan City is surrounded by ocean, and the marine ecosystem services should be taken consideration into the model, but the InVEST model was mainly designed for the terrestrial ecosystem. At the same time, the calculation of soil sediment was based on USLE, which required long-term average precipitation for rainfall erosivity factor (R factor),and this could weaken the annual variability of soil sediment (Sharp et al. Citation2016). The hold rate of soil erosion in each pixel could not be taken into consideration in the model, because soil erosion is generally a dynamic process with an interaction between neighboring grid cells. For carbon storage, we referred to previous studies and estimated the different parts of carbon density for each LULC type. This method is accessible and flexible, but the model requires more consideration about the forest structure and the growth processes of vegetation, or it could whittle the spatiotemporal differences in results. The assumption that the underground water resource stayed stable during the evaluation was applied in the water yield model, and the present results ignored the water yield from the underground water. Additional ecosystem services (e.g., water regulation, pollination, and food support) should be involved and more conservation purposes also should be integrated. Finally, more attention should be paid to improving the current decision-making systems of the local government, which usually do not emphasize the importance of ecosystem services in the current administration.
Conclusion
We have applied LULC data in the InVEST model for ecosystem services mapping to analyze the relationship between changes in LULC and ecosystem services, especially in reclamation area. The territory of Zhoushan islands expanded rapidly from 1984 to 2014 because the land reclamation was driven by the demands for economic development and growing population. The land structure of the reclamation area was different from that of the islands. Over half of the reclamation area was used for urbanization and over a quarter was occupied by fishery, while, for the whole territory, the forest was still the largest LULC type. During the study period, the biggest change of ESCI was detected in the habitat quality from 2000 to 2010, while the other three ecosystem services have no significant changes showing on the ESCI maps. It should be noted that the decline in ESSI of Zhoushan City implied the degradation of ecosystem services. According to the results, the mapping of ecosystem services can be used to measure the changes and states of ecosystem services in the certain area, and the assessment can be used by the decision-makers in city management to trace the multiple ecosystem services changes and to evaluate the services and disservices of the ecosystem. Further improvements in ecosystem service mapping can provide stronger evidence to support sustainable land-use planning.
Acknowledgments
Special thanks to the anonymous reviewers and the editor for their valuable comments to improve our manuscript.
Disclosure statement
No potential conflict of interest was reported by the authors.
Additional information
Funding
Related Research Data
References
- A. Foley, J., R. DeFries, G. P.Asner, C. Barford, G. Bonan, S. R.Carpenter, … P. K. Snyder. 2005. “Global Consequences of Land Use.” Science 309: 570–574. doi:10.1126/science.1111772.
- Armsworth, P. R., K. M. A. Chan, G. C. Daily, P. R. Ehrlich, C. Kremen, T. H. Ricketts, and M. A. Sanjayan. 2007. “Ecosystem-service Science and the Way Forward for Conservation.” Conservation Biology 21 (6): 1383–1384. doi:10.1111/j.1523-1739.2007.00821.x.
- Bellassen, V., and S. Luyssaert. 2014. “Carbon Sequestration: Managing Forests in Uncertain Times.” Nature 506 (7487): 153–155. doi:10.1038/506153a.
- Bennett, E. M., G. D. Peterson, and L. J. Gordon. 2009. “Understanding Relationships among Multiple Ecosystem Services.” Ecology Letters 12 (12): 1394–1404. doi:10.1111/j.1461-0248.2009.01387.x.
- Bryan, B. A. 2013. “Incentives, Land Use, and Ecosystem Services: Synthesizing Complex Linkages.” Environmental Science and Policy. doi:10.1016/j.envsci.2012.12.010.
- Buckley, D. E., J. N. Smith, and G. V. Winters. 1995. “Accumulation of Contaminant Metals in Marine Sediments of Halifax Harbour, Nova Scotia: Environmental Factors and Historical Trends.” Applied Geochemistry 10 (2): 175–195. doi:10.1016/0883-2927(94)00053-9.
- Bullock, J. M., J. Aronson, A. C. Newton, R. F. Pywell, and J. M. Rey-Benayas. 2011. “Restoration of Ecosystem Services and Biodiversity: Conflicts and Opportunities.” Trends in Ecology and Evolution 26 (10): 541–549. doi:10.1016/j.tree.2011.06.011.
- Burkhard, B., F. Kroll, F. Müller, and W. Windhorst. 2009. “Landscapes’ Capacities to Provide Ecosystem Services - A Concept for Land-cover Based Assessments.” Landscape Online 15 (1): 1–22. doi:10.3097/LO.200915.
- Burkhard, B., F. Kroll, S. Nedkov, and F. Müller. 2012. “Mapping Ecosystem Service Supply, Demand and Budgets.” Ecological Indicators 21: 17–29. doi:10.1016/j.ecolind.2011.06.019.
- China.com. (2018). “General Situation of Zhoushan.” Retrieved April 4, 2018, from 4 April 2018 http://www.china.com.cn/chinese/zhuanti/zjcf/581701.htm
- Costanza, R., R. D’Arge, R. de Groot, S. Farber, M. Grasso, B. Hannon, … M. van Den Belt. 1997. “The Value of the World’s Ecosystem Services and Natural Capital.” Nature 387 (6630): 253–260. doi:10.1038/387253a0.
- Crossman, N. D., B. Burkhard, S. Nedkov, L. Willemen, K. Petz, I. Palomo, … J. Maes. 2013. “A Blueprint for Mapping and Modelling Ecosystem Services.” Ecosystem Services 4: 4–14. doi:10.1016/j.ecoser.2013.02.001.
- Daily, G. 1997. Nature’s Services: Societal Dependence on Natural Ecosystems. Washington, D.C.: Island Press.
- Daily, G. 2000. “Ecology: TheValue of Nature and the Nature of Value.” Science 289 (5478): 395–396. doi:10.1126/science.289.5478.395.
- Daily, G. C., S. Polasky, J. Goldstein, P. M. Kareiva, H. A. Mooney, L. Pejchar, … R. Shallenberger. 2009. “Ecosystem Services in Decision Making: Time to Deliver.” Frontiers in Ecology and the Environment 7 (1): 21–28. doi:10.1890/080025.
- de Groot, R. S., R. Alkemade, L. Braat, L. Hein, and L. Willemen. 2010. “Challenges in Integrating the Concept of Ecosystem Services and Values in Landscape Planning, Management and Decision Making.” Ecological Complexity 7 (3): 260–272. doi:10.1016/j.ecocom.2009.10.006.
- de Groot, R. S., M. A. Wilson, and R. M. J. Boumans. 2002. “A Typology for the Classification, Description and Valuation of Ecosystem Functions, Goods and Services.” Ecological Economics 41 (3): 393–408. doi:10.1016/S0921-8009(02)00089-7.
- Defries, R. S., J. A. Foley, and G. P. Asner. 2004. “Land-use Choice : Balancing Human Needs and Ecosystem Function.” Frontiers in Ecology and the Environment 2 (5): 249–257. doi:10.1890/1540-9295(2004)002[0249:LCBHNA]2.0.CO;2.
- Desmet, P., and G. Govers. 1996. “A GIs Procedure for Automatically Calculating the USLE LS Factor on Topographically Complex Landscape Units.” Journal of Soil and Water Conservation 51 (5): 427–433.
- Duan, H., H. Zhang, Q. Huang, Y. Zhang, M. Hu, Y. Niu, and J. Zhu. 2016. “Characterization and Environmental Impact Analysis of Sea Land Reclamation Activities in China.” Ocean and Coastal Management 130: 128–137. doi:10.1016/j.ocecoaman.2016.06.006.
- Egoh, B., B. Reyers, M. Rouget, M. Bode, and D. M. Richardson. 2009. “Spatial Congruence between Biodiversity and Ecosystem Services in South Africa.” Biological Conservation 142 (3): 553–562. doi:10.1016/j.biocon.2008.11.009.
- El Banna, M. M., and O. E. Frihy. 2009. “Human-induced Changes in the Geomorphology of the Northeastern Coast of the Nile Delta, Egypt.” Geomorphology 107 (1): 72–78. doi:10.1016/j.geomorph.2007.06.025.
- Elliott, J., D. Deryng, C. Müller, K. Frieler, M. Konzmann, and D. Gerten. 2014. “Constraints and Potentials of Future Irrigation Water Availability on Agricultural Production under Climate Change.” Proceedings of the National Academy of Sciences 111 (9): 3239–3244. doi:10.1073/pnas.1222474110.
- Fujian, Z., C. Minghua, L. Fuxing, H. Yanheng, and L. Chenglong. 1995. “The Rainfall Erosivity Index in Fujian Province.” Journal of Soil and Water Conservation, 9 (1): 13–18.
- Gan, M., J. Deng, X. Zheng, Y. Hong, and K. Wang. 2014. “Monitoring Urban Greenness Dynamics Using Multiple Endmember Spectral Mixture Analysis.” PloS One 9 (11): e112202. doi:10.1371/journal.pone.0112202.
- Ge, Y., and Z. Jun-yan. 2011. “Analysis of the Impact on Ecosystem and Environment of Marine reclamation–A Case Study in Jiaozhou Bay.” Energy Procedia 5: 105–111. doi:10.1016/j.egypro.2011.03.020.
- Ghazali, N. H. M. 2006. “Coastal Erosion and Reclamation in Malaysia.” Aquatic Ecosystem Health & Management 9 (2): 237–247. doi:10.1080/14634980600721474.
- Goldstein, J. H., G. Caldarone, T. K. Duarte, D. Ennaanay, N. Hannahs, G. Mendoza, … G. C. Daily. 2012. “Integrating Ecosystem-service Tradeoffs into Land-use Decisions.” Proceedings of the National Academy of Sciences 109 (19): 7565–7570. doi:10.1073/pnas.1201040109.
- Guo, H., and J. J. Jiao. 2007. “Impact of Coastal Land Reclamation on Ground Water Level and the Sea Water Interface.” Ground Water 45 (3): 362–367. doi:10.1111/j.1745-6584.2006.00290.x.
- Hein, L., K. van Koppen, R. S. de Groot, and E. C. van Ierland. 2006. “Spatial Scales, Stakeholders and the Valuation of Ecosystem Services.” Ecological Economics 57 (2): 209–228. doi:10.1016/j.ecolecon.2005.04.005.
- Hu, L., and J. J. Jiao. 2014. “Analytical Studies on Transient Groundwater Flow Induced by Land Reclamation Using Different Fill Materials.” Hydrological Processes 28 (4): 1931–1938. doi:10.1002/hyp.9710.
- Isbell, F., V. Calcagno, A. Hector, J. Connolly, W. S. Harpole, P. B. Reich, … M. Loreau. 2011. “High Plant Diversity Is Needed to Maintain Ecosystem Services.” Nature 477 (7363): 199–202. doi:10.1038/nature10282.
- Jim, C. Y., and M. W. H. Chan. 2016. “Urban Greenspace Delivery in Hong Kong: Spatial-institutional Limitations and Solutions.” Urban Forestry & Urban Greening 18: 65–85. doi:10.1016/j.ufug.2016.03.015.
- Kinnell, P. I. 2010. “Event Soil Loss, Runoff and the Universal Soil Loss Equation Family of Models: A Review.” Journal of Hydrology 385 (1–4): 384–397. doi:10.1016/j.jhydrol.2010.01.024.
- Lautenbach, S., C. Kugel, A. Lausch, and R. Seppelt. 2011. “Analysis of Historic Changes in Regional Ecosystem Service Provisioning Using Land Use Data.” Ecological Indicators 11 (2): 676–687. doi:10.1016/j.ecolind.2010.09.007.
- Lawler, J. J., D. J. Lewis, E. Nelson, A. J. Plantinga, S. Polasky, J. C. Withey, … V. C. Radeloff. 2014. “Projected Land-use Change Impacts on Ecosystem Services in the United States.” Proceedings of the National Academy of Sciences of the United States of America 111 (20): 7492–7497. doi:10.1073/pnas.1405557111.
- Leh, M. D. K., M. D. Matlock, E. C. Cummings, and L. L. Nalley. 2013. “Quantifying and Mapping Multiple Ecosystem Services Change in West Africa.” Agriculture, Ecosystems and Environment 165: 6–18. doi:10.1016/j.agee.2012.12.001.
- Li, K., X. Liu, X. Zhao, and W. Guo. 2010. “Effects of Reclamation Projects on Marine Ecological Environment in Tianjin Harbor Industrial Zone.” Procedia Environmental Sciences 2: 792–799. doi:10.1016/j.proenv.2010.10.090.
- Li, S., Y. Zhang, Z. Wang, and L. Li. 2018. “Mapping Human Influence Intensity in the Tibetan Plateau for Conservation of Ecological Service Functions.” Ecosystem Services 30: 276–286. doi:10.1016/j.ecoser.2017.10.003.
- Mai, S., and A. Bartholomä. 2000. “Muddy Coast Dynamics and Resource Management.” Proceedings in Marine Science 2: Elsevier. doi:10.1016/S1568-2692(00)80021-2.
- Millennium Ecosystem Assessment. 2005. “Ecosystems and Human Well-being: Biodiversity Synthesis.” Ecosystems 86: doi:10.1088/1755-1307/6/3/432007.
- Mushet, D. M., J. L. Neau, and N. H. Euliss. 2014. “Modeling Effects of Conservation Grassland Losses on Amphibian Habitat.” Biological Conservation 174: 93–100. doi:10.1016/j.biocon.2014.04.001.
- Ni, C. F., W. C. Li, S. M. Hsu, I. H. Lee, and C. P. Lin. 2019. “Numerical Assessments of Recharge-dominated Groundwater Flow and Transport in the Nearshore Reclamation Area in Western Taiwan.” Environmental Monitoring and Assessment 191: 2. doi:10.1007/s10661-019-7199-4.
- The People’s Government of Zhejiang Province. 2015. National Ecosystem Survey and Assessment of Zhejiang Province (2000–2010). HangZhou: Zhejiang Environmental Protection Bureau.
- Plieninger, T., S. Dijks, E. Oteros-Rozas, and C. Bieling. 2013. “Assessing, Mapping, and Quantifying Cultural Ecosystem Services at Community Level.” Land Use Policy 33: 118–129. doi:10.1016/j.landusepol.2012.12.013.
- Polasky, S., E. Nelson, D. Pennington, and K. Johnson. 2011. “The Impact of Land-use Change on Ecosystem Services, Biodiversity and Returns to Landowners: A Case Study in the State of Minnesota.” Environmental and Resource Economics 48 (2): 219–242. doi:10.1007/s10640-010-9407-0.
- Posner, S., G. Verutes, I. Koh, D. Denu, and T. Ricketts. 2016. “Global Use of Ecosystem Service Models.” Ecosystem Services 17: 131–141. doi:10.1016/j.ecoser.2015.12.003.
- Raudsepp-Hearne, C., G. D. Peterson, and E. M. Bennett. 2010. “Ecosystem Service Bundles for Analyzing Tradeoffs in Diverse Landscapes.” Proceedings of the National Academy of Sciences of the United States of America 107 (11): 5242–5247. doi:10.1073/pnas.0907284107.
- Raymond, C. M., G. G. Singh, K. Benessaiah, J. R. Bernhardt, and J. Levine. 2013. “Ecosystem Services and Beyond: Usingmultiple Metaphors to Understand Human-environment Relationships.” BioScience 63 (7): 536–546. doi:10.1525/bio.2013.63.7.7.
- Ruiz-luna, V. C. A. 2014. “Effects of Land Use Changes on the Ecosystem Service Values of Coastal Wetlands.” Environmental Management 54 (4): 852–864. doi:10.1007/s00267-014-0332-9.
- Schwarz, N., S. Lautenbach, and R. Seppelt. 2011. “Exploring Indicators for Quantifying Surface Urban Heat Islands of European Cities with MODIS Land Surface Temperatures.” Remote Sensing of Environment 115 (12): 3175–3186. doi:10.1016/j.rse.2011.07.003.
- Sharp, R., H. T. Tallis, T. Ricketts, A. D. Guerry, S. A. Wood, R. Chaplin-Kramer, … J. K (2016). InVEST 2.5.1 user guide. Retrieved October 10, 2016, from 10 October 2016 http://data.naturalcapitalproject.org/nightly-build/invest-users-guide/html/
- Sharpley, A. N., and J. R. Williams (1990). “EPIC: The Erosion-productivity Impact Calculator. U.S.” Department of Agriculture Technical Bulletin, (1768), 235. Retrieved from http://agris.fao.org/agris-search/search.do?recordID=US9403696
- Silvertown, J. 2015. “Have Ecosystem Services Been Oversold?” Trends in Ecology & Evolution 30 (11): 641–648. doi:10.1016/j.tree.2015.08.007.
- Society, E., and E. Applications. 2013. “An Assessment of Ecosystem Services : Water Flow Regulation and Hydroelectric Power Production.” Ecological Applications 10 (3): 925–936.
- Song, W., and X. Deng. 2017. “Land-use/land-cover Change and Ecosystem Service Provision in China.” Science of the Total Environment 576: 705–719. doi:10.1016/j.scitotenv.2016.07.078.
- Stanley, D. J., and A. G. Warne. 1998. “Nile Delta in Its Destruction Phase.” Journal of Coastal Research 14 (3): 795–825.
- Statistical Bureau of Zhoushan. 2015. Zhoushan Statistical Yearbook. Beijing: China Statistics Press.
- Steele, J. H. 1985. “A Comparison of Terrestrial and Marine Ecological Systems.” Nature 313 (6001): 355–358. doi:10.1038/313355a0.
- Swallow, B. M., J. K. Sang, M. Nyabenge, D. K. Bundotich, A. K. Duraiappah, and T. B. Yatich. 2009. “Tradeoffs, Synergies and Traps among Ecosystem Services in the Lake Victoria Basin of East Africa.” Environmental Science and Policy 12 (4): 504–519. doi:10.1016/j.envsci.2008.11.003.
- Tallis, H., P. Kareiva, M. Marvier, and A. Chang. 2008. “Ecosystem Services Special Feature: An Ecosystem Services Framework to Support Both Practical Conservation and Economic Development.” Proceedings of the National Academy of Sciences of the United States of America 105 (28): 9457–9464. doi:10.1073/pnas.0705797105.
- Tallis, H., and S. Polasky. 2009. “Mapping and Valuing Ecosystem Services as an Approach for Conservation and Natural-resource Management.” Annals of the New York Academy of Sciences 1162: 265–283. doi:10.1111/j.1749-6632.2009.04152.x.
- Watson, R. T., I. Noble, B. Bolin, N. H. Ravindranath, D. J. Verardo, and D. J. Dokken. 2000. Land Use, Land-Use Change, and Forestry. Cambridge: Cambridge University Press.
- Whittaker, R. J. 2007. Island Biogeography: Ecology, Evolution, and Conservation. Oxford: Oxford University Press.
- Wikipedia. (2019). “Zhoushan.” Retrieved May 2, 2019, from 2 May 2019 https://en.wikipedia.org/wiki/Zhoushan
- Wong, C. P., B. Jiang, A. P. Kinzig, K. N. Lee, and Z. Ouyang. 2015. “Linking Ecosystem Characteristics to Final Ecosystem Services for Public Policy.” Ecology Letters. doi:10.1111/ele.12389.
- Xiao, H., Z. Ouyang, J. Zhao, and X. Wang. 2000. “Forest Ecosystem Services and Their Ecological Valuation—A Case Study of Tropical Forest in Jianfengling of Hainan Island” Chinese Journal of Applied Ecology 11 (4): 481–484. Retrieved from http://europepmc.org/abstract/med/11767660
- Xinhua. (2011). “China Approves Zhoushan Archipelago New Area.” Retrieved 20 December 2017, from http://europe.chinadaily.com.cn/china/2011-07/07/content_12862514.htm
- Yu, S., B. Cui, P. Gibbons, J. Yan, X. Ma, T. Xie, … X. Shao. 2017. “Towards a Biodiversity Offsetting Approach for Coastal Land Reclamation: Coastal Management Implications.” Biological Conservation 214 (December 2016): 35–45. doi:10.1016/j.biocon.2017.07.016.
- Zhang, Q., C. Zhu, C.-L. Liu, and T. Jiang. 2005. “Environmental Change and Its Impacts on Human Settlement in the Yangtze Delta, PR China.” Catena 60 (3): 267–277. doi:10.1016/j.catena.2004.12.001.
- Zhao, B., U. Kreuter, B. Li, Z. Ma, J. Chen, and N. Nakagoshi. 2004. “An Ecosystem Service Value Assessment of Land-use Change on Chongming Island, China.” Land Use Policy 21 (2): 139–148. doi:10.1016/j.landusepol.2003.10.003.
- Zorrilla-Miras, P., I. Palomo, E. Gómez-Baggethun, B. Martín-López, P. L. Lomas, and C. Montes. 2014. “Effects of Land-use Change on Wetland Ecosystem Services: A Case Study in the Doñana Marshes (SW Spain).” Landscape and Urban Planning 122 (2014): 160–174. doi:10.1016/j.landurbplan.2013.09.013.