
 ?Mathematical formulae have been encoded as MathML and are displayed in this HTML version using MathJax in order to improve their display. Uncheck the box to turn MathJax off. This feature requires Javascript. Click on a formula to zoom.
ABSTRACT
This study was conducted in the KVRS to; evaluate the seasonal eco-toxicity of water, soil and sediment samples; establish the suitability of using temperate biotest batteries in tropical systems; classify the toxicity of samples using Fuzzy Rules to estimate potential ecological risks. 143 water, sediment, and soil samples were collected during dry and rainy seasons in plantation areas. Pseudokirchneriella subcapitata, Aliivibrio fischeri and Arthrobacter globiformis bioassays were used to assess the toxicity of the samples. Results were categorized and classified into toxicity classes.
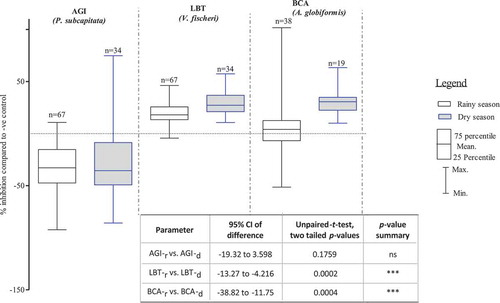
Dry season presented a significantly higher mean inhibition of 31% than 5% shown by rainy season samples (p < 0.001) in the bacterial bioassays, indicating a lower concentration of contaminants due to flooding and increased surface runoff. A few sediment samples resulted into 100% inhibition of A. globiformis, implying organisms were physiologically inactive upon exposure to contaminants. Seventy-three percent of samples posed little or no toxic potential risk, 25% posed critical risk and 1% posed elevated critical risk, implying the KVRS ecosystem might be at risk if the extensive usage of pesticides in the area is not well managed and monitored. The temperate micro-biotests can be used in tropical systems, but with further research on suitable organisms and standardized methods.
Introduction
Agricultural and industrial activities, if not well monitored and managed, potentially release toxic chemicals into the environment. Exposure of biological communities to contaminants can have effects at different levels of complexity and time-space scale. These effects are often difficult to distinguish from the impact of highly variable physical and social environmental factors. Studying field organisms alone, observation of ecological effects depends on what is measured (bioindicators/biomarkers), where (body of the exposed) and how often (duration) (Lu et al. Citation2015), and whether the affected organisms are in aquatic or terrestrial ecosystems (Abarikwu et al. Citation2017). Chemical and physical analyses of environmental samples inform about the amount of single or specific contaminants but are not able to detect all dangerous substances present in such samples (Wadhia and Thompson Citation2007), nor do they provide information on the combined effect of pollutants on organisms. The risks of identified hazardous substances in the ecosystem depend on the characteristics of the chemicals and on the level and pattern of exposure (Gerba Citation2019), as well as on the history of pollution and on the matrix in which it is found. Use of laboratory bioassays/biotests in ecological surveys, on the other side, has a potential to verify the bioavailability of contaminants (Fent Citation2004) and establish likelihood of ecological risks of contaminants in the biota (Bucheli and Fent Citation2009). Micro-biotests utilize the capacity of specific organisms to respond to exposure of contaminants or contaminated field samples under standardized conditions by change in their vital functions. Therefore, bioassays can be used for various purposes, such as bio-monitoring (Rakshith et al. Citation2016), early warning systems, for regulatory purposes (Power and Boumphrey Citation2004; Tonkes, den Besten, and Leverett Citation2016), and effect screening (Carbajo et al. Citation2015). Due to species-specific sensitivities and different exposure pathways, a combination of biotests, a so-called “battery,” with different test organisms at different trophic levels is usually applied (Allan et al. Citation2006; Hagner et al. Citation2018; Szklarek et al. Citation2015). Interpretations of results from a battery of biotests, as an integrative assessment, provide an opportunity to identify and prioritize hotspots and actual bioavailability of contaminants, thus providing a reliable, valid and reproducible tool in the determination of ecological risk assessment (Wolska et al. Citation2007; Wolska, Kochanowska, and Namiesnik Citation2009; Palma, Ledo, and Alvarenga Citation2016).
Extrapolation of biotest results to a potential impact on the ecosystem, however, is limited by the complexity of interspecies relationship, confounding environmental factors, species diversity, biological functions and structure (e.g. Fent Citation2004). Thus, bioassays are often used as one line of evidence among others in risk assessment and are as such widely accepted by regulatory authorities of developed countries (Sullivan et al. Citation2011; Brown et al. Citation2016; Coady et al. Citation2019, USEPA Citation2016). The application in developing countries, however, is limited and novel to Tanzanian setting. This study thus provides the first eco-toxicological testing of samples from the tropical freshwater wetland ecosystems of the Kilombero Valley Ramsar site, Tanzania. A biotest battery was used, for which a lot of data and experience exists in temperate regions. A classification system, integrating the various biotest results, was applied in order to potentially identify and communicate the location of hot spots in the area. The suitability of temperate bioassay batteries for tropical agronomic systems is discussed. This study focused on the following specific objectives: (i) evaluate the seasonal eco-toxicity of water, soil and sediment samples of Kilombero valley wetlands from plantations applying agrochemicals; (ii) establish the suitability of using already established temperate biotest batteries for assessing agrochemicals contamination in tropical agronomic systems by using data derived from temperate-originated samples; (iii) using Fuzzy Rule-Based (FRB) toxicity classification of sediment and soil samples at different sampling stations to estimate the potential risks of contaminated samples from agricultural fields to humans and aquatic life.
Materials and methods
Description of study area
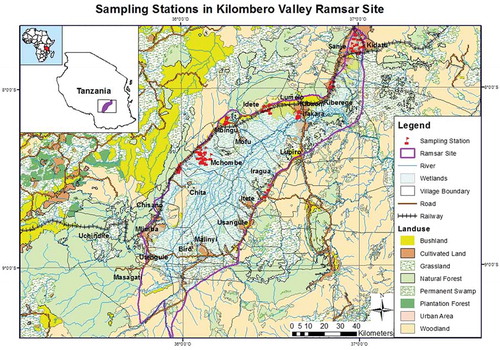
This study was conducted in the Kilombero Valley Ramsar Site (KVRS), the largest low-altitude freshwater wetland in East Africa (MNRT Citation2004). The Kilombero Valley Ramsar site is located in the Morogoro region between three districts, namely Kilombero, Malinyi (formerly known as one-Kilombero district) and Ulanga, in Tanzania. It is situated in the conserved eastern arc mountains of Tanzania, between the Udzungwa catchment mountains reserve in the north-west (7°47’S, 36°36ʹE) and the Mahenge escarpment in the southern east (8°45’S, 36°39ʹE) (Ramsar Citation2002). The Ramsar site (assigned since 2002) central coordinate points are 8°40’S and 36°10ʹE which covers an area of 796,735 ha with a wetland catchment area of 40,000 km2 (Ramsar Citation2002). Moreover, the Ramsar site has numerous temporal and permanent rivers (), which serve as a source of freshwater and livelihood activities for surrounding communities. According to the Ramsar Advisory Mission Report of 2017, the KVRS is under intense pressure and subject to unsustainable levels of negative human-induced change which is compromising the ecological character of the site. There are massive land-use changes especially for agriculture and livestock keeping, thus encroaching in all areas of wetlands and the native grasslands have been changed to arable lands (RAM, Citation2017). More than 60% of the area covered by wetlands and grasslands in the Kilombero floodplain has decreased (Muro et al. Citation2017) because it has been converted to arable lands for monoculture cropping (rice, sugarcane or maize). According to the Tanzanian National Bureau of Statistics (NBS) report of 2016, the population in the three districts, where KVRS is located, is projected to grow by approximately 3% per annum over the next 20 years thus turning to about 1,548,215 people in 2036 (NBS Citation2016). Therefore, there is a need to perform eco-toxicological tests to address the ecological risks associated with the intensification of agriculture and other human activities in this Ramsar wetland. Surface sediments, water, and soil samples were collected during rainy and dry seasons from eight different sizes of plantations of rice, sugarcane and teak located within or adjacent to the Ramsar area ().
Figure 1. A map of Tanzania showing location of Kilombero Valley Ramsar Site and sampling stations (adapted from Materu Citation2015)
Sample collection, preservation, handling, and storage
One hundred and forty-three samples were collected during rainy (March/April) and dry seasons (January/early February) from different locations, i.e., up and downstream rivers that drain agricultural farmland, and from all accessible inlet and outlet canals that drain the eight surveyed sugarcane, rice and teak plantations in the KVRS. Fifty-eight fine sediments samples were collected directly from either the surface banks or beneath a shallow sluggish aqueous layer using a stainless steel spoon. Sixty-eight water samples were collected by using previously acid-washed plastic bottles either adjacent or at the same sites where the sediments were collected. During dry season, 17 representative soil samples were randomly collected from newly plowed or planted rice and sugarcane agricultural fields while avoiding areas of variability within the same field. GPS coordinates of each sample and all relevant sample information were recorded. Following collection, sediments and soil samples were transferred to the previously acid washed dry polythene plastic bottles. Samples were kept cold during and after the sampling by using ice chests and cooled to 4°C on the last day of sampling followed by 1 day holding time before transported to Germany by using an ice chest box. All laboratory experiments were conducted at the laboratory of Applied Aquatic Toxicology, Hamburg University of Applied Sciences, Germany. Samples were stored at 4°C to minimize microbial activities. Biotest analyses were carried out within 3 weeks.
Eco-toxicological assessments
Algae growth inhibition test (AGI) using Pseudokirchneriella subcapitata
The microalgae P. subcapitata culture was obtained from SAG-The Culture Collection of Algae of Göttingen University Germany (strain number 61.81). Algae pre-culture was prepared according to DIN EN ISO 8692 (Citation2012). Elutriates were prepared in a sediment-to-water ratio of 1:4 on a volume basis, at room temperature and shaken for 24 hours at 70 rpm according to USEPA (Citation1991). The slurries were then centrifuged at 10,000 g for 20 min to obtain a clear supernatant. pH values were recorded and the elutriates were serially diluted (at the ratio of 1:1, 1:2, 1:4, 1:8, 1:16) to maintain the percentage concentration of the sample in the test medium as 100, 50, 25, 12.5, 6.25, respectively. Three replicates of each dilution step were used in a miniaturized 24 wells cell culture plates. Two hundred microliters of exponentially growing P. subcapitata, incubated under the conditions of the test for 3 days were added into the well plates that contain the diluted samples and a nutrient-rich medium (OECD Citation1984). The inoculated test plates were incubated in a continuous light in a range between 70 and 87 µEinstein/m2S at 20 ± 2°C while shaking at 250 rpm. The auto-fluorescence emitted by chlorophyll was measured at the beginning of the test and after every 24 h and the growth rate was calculated over 72-h incubation time. Bi-distilled water was taken as negative control and freshly prepared solution of 1 mg/L of 3, 5-Dichlorophenol (DCP) was used as positive control to verify the sensitivity of laboratory culture. 3, 5-DCP was purchased from Alfa Aesar GmbH & Co KG, Germany. Three replicates of samples and controls were used. Blank wells were used to correct any potential interference from the sample matrices; thus, their values were deducted from the test or control values. The percentage inhibition or stimulation of the algae exposed to the samples was compared to that of reference substance and the controls.
Bacterial sediment/soil contact assay (BCA) using Arthrobacter globiformis
The culture of A. globiformis (strain number 20124) was obtained from German collection of microorganisms and cell cultures (DSMZ). Bacteria culture preparation and test procedures were conducted according to DIN 38412-48 (Citation2002). This test was chosen in order to evaluate the toxicity of particle-bound contaminants.
Sample slurries preparation and test procedures were followed as described by DIN 38412-48 (Citation2002). pH and redox potential for soil and sediment sample slurries were recorded before mixing with a quartz sand (Millisil W4) suspension of the same dry weight using the following ratios: 1:1, 1:2, 1:4, 1:8. A miniaturized method using 96-wells cell culture plates was employed. A quartz sand suspension with 50% water content was used as negative control (reference) and the quartz sand suspension containing 1.3 mg/kg BAC (Benzyl-dimethyl-hexadecyl-ammonium chloride) was used as positive control. Quartz sand and BAC were supplied by Carl Roth GmbH & Co.KG, Germany. After 2 h of incubation, 80 µL of redox indicating dye resazurin (45 mg/L in 0.1 M MOPs buffer (pH = 8.2) was added and the reduced fluorescent dye product resorufin was measured fluorometrically using a TECAN-infinite 200 multimode plate reader. The plates were measured at the beginning of the test and after every 15 min up to 45 min. Three replicates of each diluted sample and controls were used. The calibrated slope of dehydrogenase kinetic between 15 and 45 min was used to calculate the inhibition percent of dehydrogenase activity.
Luminescent bacteria test (LBT) using Aliivibrio fischeri (formerly Vibrio fischeri)
Test procedure and culture preparation
The freeze-dried bacterium charge numbers 11229, 12164, 13037, and bacterial reconstitution activator solution were obtained from Hach Lange GmbH-Germany. All test procedures and culture preparation were carried out according to DIN EN ISO 11348-3 (Citation2007). Water samples and sediment or soil elutriates were prepared as in algae test, but before using in the test, pH and salinity were first adjusted to 7.0 ± 0.2 (using NaOH or HCl) and 2.0% to 2.2% (using NaCl), respectively. Elutriates were further serially diluted with laboratory prepared artificial seawater (ASW) to obtain a final test concentration in a decreasing order from 80% to 16.67% elutriate. Fifty-microliter activated bacteria (A. fischeri) in ASW were exposed to 200 µL elutriates for 30 min at 15°C. ASW and 3, 5-DCP (1 mg/L) were used as negative and positive controls, respectively. Two replicates of each sample dilution step and controls were carried out. The bacterial luminescence was measured by using multimode microwell plate reader (TECAN Infinite-200) before and after the exposure to elutriate. Growth rate over 30 min was calculated as an endpoint response.
Fuzzy rule-based classification of bioassays results
The bioassays database of the Applied Aquatic Toxicology Research group of the Hamburg University of Applied Science – Faculty of Life Sciences was used. It comprised more than 200 data sets of P. subcapitata, A. globiformis and A. fischeri bioassays for sediment and water samples that had been collected from different rivers and locations in Germany between 2009 and 2014. The data contained a wide range of bioassay toxicity responses, which varied from very low to extreme inhibition responses due to a wide range of historic contaminations and other anthropogenic activities upstream. Toxicity responses were calculated as the percentage of inhibition compared to the respective negative control. Box whiskers plots with median, 25, 75 percentiles were used to get an overview of the specific potential response span of different bioassays. The distribution of biotest responses in each test as demonstrated by the box plots was used to assign three categories of toxicity, namely no or low toxicity, moderate and high toxicity according to Ahlf and Heise (Citation2005). In order to determine the eco-toxicological impact in Kilombero valley, P.subcapitata, A. fischeri, and A. gobiformis bioassays results for each sediment and soil sample were used to estimate the overall toxicity response in comparison to the derived categories on the basis of the database. Maximum overlap between the bioassay categories was determined on the assessment of the fulfillment of validity criteria of the biotests results as shown in . Only data from the bioassay responses, which met the biotest criteria in , were used in this classification system.
Table 1. Validity criteria of the optimal performance of the micro-biotests
Fuzzy slopes and specific overlaps were defined by average standard deviations of the percentage inhibition among the replicates of positive and negative controls (). The variation among replicates of positive controls indicated the precision of the test procedures and the influence of sample matrices to test organisms. The combinations of fuzzy sets within the rule base were calculated according to Ahlf and Heise (Citation2005) by using MIT Data engine software Package-Version 4 under the following inferences, (i) operator of aggregation: minimum, (ii) operators of implication; algebraic product, (iii) operator of accumulation: maximum. A FRB classification system was setup to provide logical and transparent means of interpreting the results from the array of bioassays. Each variable was fitted to a fuzzy set and the knowledge or information was represented by “if … .and then … ” rules in order to model the uncertainties of various parameters (Ahlf and Heise Citation2005; Topuz and van Gestel Citation2016; Hu et al. Citation2016).
Table 2. Estimation of the size of overlaps between the toxicity categories based on the standard deviation of inhibition values of replicates of positive and negative controls
Statistical analysis
All statistical analysis and graphs were prepared with Graph Pad Prism5 statistical package. One-way analysis of variance (ANOVA) was used to compare seasonal variation among the bioassay results.
Results
Eco-toxicity: dry vs. rainy seasons
During dry season, samples were more toxic than during rainy season (sediment, soil, water). Dry season samples (sediment, soil, water) showed significantly higher mean inhibition of 29% and 31% as opposed to 18% and 5% inhibition shown by rainy season samples (sediment, soil, water) for A. fischeri and A. globiformis bioassays, respectively (p < 0.001, ). Dry and rainy season sediment and soil samples exhibited 34% and 26% mean stimulation of P. subcapitata bioassays, respectively. However, the observed stimulation between the two seasons did not differ significantly with this test (p = 1.759, ).
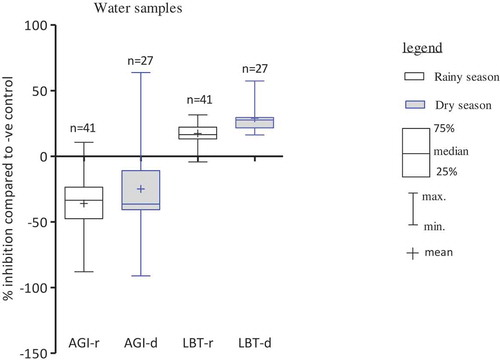
Figure 2. Endpoint responses of the test organisms upon exposure to environmental samples. AGI = Algae growth inhibition test, LBT = Luminescence bacteria test, BCA = Bacteria contact assays, r = rainy season, d = dry season, n = number of samples
Bioassay response for sediment, soil and water samples
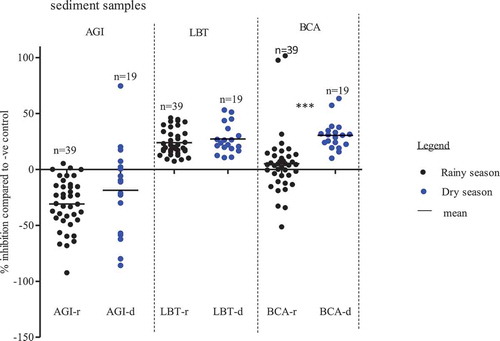
Sediment samples
shows that for all three bioassays, higher inhibitions with dry season (n = 19) than rainy season (n = 39) sediment samples were observed. P. subcapitata test was mostly stimulated up to 92%. Toxicity range was higher in dry than in rainy season for only six samples that showed inhibition responses. Only one toxic sample, collected at KSC, showed a highest inhibition of 74%, while all rainy season samples were below 6% inhibition. For the luminescence bacteria test (A. fischeri), there were no significant differences between rainy and dry seasons inhibitions, which ranged from 7% to 53% (p > 0.05). The A. globiformis test showed some toxic spots during both dry and rainy seasons. However, significance highest toxicity of 100% inhibition was shown by the samples collected during rainy season (p < 0.001).
Figure 3. Mean, minimum and maximum of measured endpoint responses of test organisms exposed to sediment samples. AGI = Algae growth inhibition test, LBT = Luminescence bacteria test, BCA = Bacteria contact assays, r = rainy season, d = dry season, ***: p < 0.001, 1-way ANOVA, with posttest Dunn´s multiple comparison tests
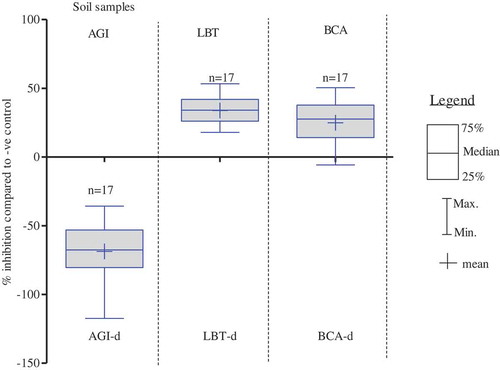
Soil samples
Soil samples were collected during dry season only because the site was flooded during rainy season. Dry season soil samples (n = 17) exhibited 69% mean stimulation of P. subcapitata, in opposite to 34% and 25% mean inhibitions of A. fischeri and A. globiformis, respectively (). There was no inhibition of P. subcapitata by dry season soil samples (n = 17).
Figure 4. Mean, minimum and maximum values of measured endpoint responses of test organisms exposed to dry season soil samples. AGI = Algae growth inhibition Test, LBT = Luminescence bacteria test, BCA = Bacteria contact assays, d = dry season
Water samples
More than 92% of both rainy and dry season water samples resulted in stimulation of P. subcapitata. Water samples collected during dry season showed a larger toxicity range with up to 64% inhibition than rainy season samples (). Thus, this trend is similar to sediment samples, although the samples were not necessarily from the same hotspots. Although there were no significant differences (p > 0.05), dry season water samples showed clearly a higher toxicity range for A. fischeri, in than rainy season samples.
Figure 5. Mean, minimum and maximum percentage of measured endpoint responses of test organisms exposed to water samples. AGI = Algae growth inhibition test, LBT = Luminescence bacteria test, r = rainy season, d = dry season
FRB classification of bioassay results
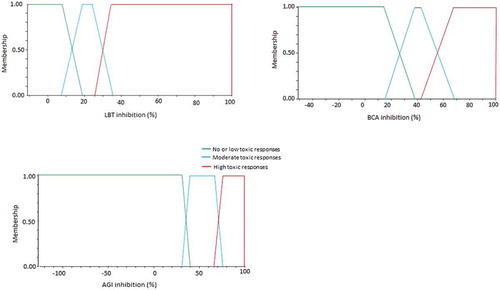
shows the fuzzy overlaps of the three bioassays. The size of the overlaps represents the intrinsic variability and the set criteria of the biotest results which were different for each test system. The standard deviation when measuring replicates (samples, positive or negative controls) was considered as an indicator of this variability. The fuzzy overlaps of BCA were the highest among the three test systems (25% compared to 10% in the other two tests) due to methodological procedures.
The deduced categories with their fuzzy overlaps which also show the fuzzy membership functions for Kilombero samples were described in the following three categories:
Category 1: little or no toxic responses. Corresponded to <15
% inhibition of bioluminescence of A. fischeri, <35
Category 2: Moderate toxic responses. Corresponded to inhibition of A. fischeri bioluminescence of from 15
Category 3: High toxic responses. Corresponded to >30
The overview overlaps and to what extent the bioassay data belong to a particular fuzzy set of the three toxic categories is summarized in . Membership functions of bioassays, which were defined by any value between 0 and 1, were used to obtain three fuzzy quality classes, namely; Class 1: Little or no potential risk, Class 2: Critical risk, Class 3: Elevated critical risk
Figure 6. Membership functions of the fuzzy sets for the Luminescent Bacteria Test (LBT), Bacteria Contact Assay (BCA) and Algae Growth Inhibition test (AGI). Fuzzy overlaps are derived from standard deviation of inhibition values of replicates of positive and negative controls
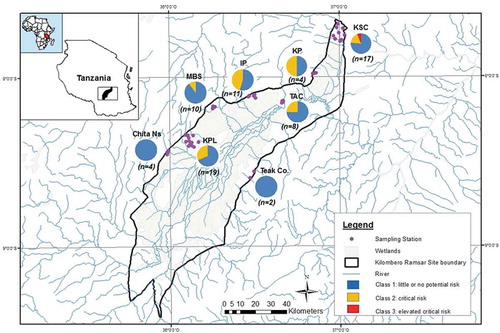
An overview of the outcome of the FRB classification and the distribution of toxic classes is shown in the map of sampling stations .
Figure 7. A map of Kilombero Valley Ramsar Site with pie charts showing the proportion of bioassay toxicity classes of 75 samples (sediment and soils), for each sampling stations (adopted from Materu Citation2015)
Discussion
Bioassays assessment: dry vs. rainy season
The biotest data in this study did not indicate any toxicity to microalgae from soil elutriates (dry season) and from sediment elutriates sampled during rainy season (). When sampled during dry season, a few sediments elutriate and water samples inhibited microalgae in the tests, especially for the samples collected in the Kilombero sugar plantations. The on average low toxicity indicates either, that the studied sites were not much polluted with soluble herbicides or that effects were masked by stimulating factors. Stimulation in the algae growth inhibition test is a common phenomenon when testing soil or sediment elutriates, and possibly due to complementary co-eluate nutrients (e.g. Hall et al. Citation1996; Hund Citation1997; Hsu et al. Citation2007). This problem has not yet been tackled successfully by regulatory frameworks, also due to the challenge of finding a suited-uncontaminated sediment, elutriates of which could be used to complement the control media in the test. Moreover, the stimulation effects could also be due to hormesis (Stebbing Citation1982) which further complicates the issue. Comparing pesticide analysis with ecotox data for the Kilombero region, glyphosate, AMPA and chlorpyrifos were more often detected in samples during dry season than during rainy season (data not shown) even though in concentrations below 1 µg/L in water and 1 µg/g DW in soils and sediments, which may provoke a hormesis effect. As to many agronomic systems of Tanzania, seedling season starts on the fall of the first or second rains and thus for Kilombero valley is from end of February to end of March. Sampling in the dry season may have overlapped with pesticide application before seedling, as measured glyphosate and AMPA concentrations were higher in samples from dry than from rainy season. Both have strong soil adsorptive characteristics due to their large organic carbon to water partition coefficient (Koc) up to 60,000 L/kg (Okada, Costa, and Bedmar Citation2016; Maqueda et al. Citation2017; Erban et al. Citation2018) and half-lives in soil of 42–44 days, depending on the physicochemical properties of the applied soils (Kollman and Segawa Citation1995; Zhang et al. Citation2015). Tsui and Chu (Citation2003) showed that the glyphosate-containing product Roundup® had a high toxicity to different trophic levels of aquatic organisms in the laboratory such as bacteria, algae, protozoa and zooplankton, whereby almost 50% of the effect could be attributed to the toxicity of the surfactant polyoxyethyleneamine (POEA) as complementary component of the product which has not been analyzed in this study. Effects of pesticides on bacteria are not well studied, especially considering their enormous diversity (DeLorenzo, Scott, and Ross Citation2001), and no data are available yet for soil bacteria of the genus Arthrobacter. Considering the affinity of many pesticides to sediments, the bacterial contact test with A. globiformis may prove to be of highly relevant for tropical regions.
Table 3. Summary of the measured endpoints responses of different test organisms to sediment, water and soil samples collected during rainy and dry season
The loss of effective substances from soil when heavy rainfall floods the area, followed by dilution within the aquatic system, could be the reason for lower toxicities during rainy than dry season. Increased leaching, drain-flow, and surface run-off have been identified as the major pathways leading to ecological exposure to contaminants (Boardman et al. Citation2019; Sandin et al. Citation2018; Tsaboula et al. Citation2019). The extent of how these processes contribute to the ecological exposure depends on the soil properties, the physico-chemical characteristics of the substances and on the formulation (Gouy et al. Citation1999; Sandin et al. Citation2018). According to Carter (Citation2002), the loss of herbicide from soil is typically less than 0.1–1%, but can occasionally go beyond 5% of the applied mass. After release to the water, eroded particles and dissolved contaminants are transported along the river channels during rainy season, while dilution within the residual or stagnant water during dry conditions is much lower than rainy season, thus increasing the localized impact. Therefore, in this study sediments collected during rainy season had fewer or lower concentrations of bioavailable organic contaminants than dry season samples. High humus content and high tropical temperatures might increase the ability of organic compounds, such as pesticides to be adsorbed by the anion-exchange resin through ion exchange forces; the equilibrium is influenced by temperature and exposure time (Farha et al. Citation2016; Ogbeide et al. Citation2018).
Additionally, the dry season water and sediment samples which showed extreme or elevated toxic responses in the three bioassays were identified as those collected either from the outlet streams that receive drains from the rice paddies or adjacent to pesticide mixing/sprayer filling point or from the small forests located within the KPL rice farms. Both rainy and dry season sediment samples collected in the banks of the rivers that flow within the KPL and KSC agricultural fields, showed elevated toxicity in A. globiformis bioassay. This indicated that contaminants were transported from their points of origin downstream and were potentially deposited in the river banks, especially when the discharge rate was low or when flow velocity decreased during dry seasons. The observed stimulation of A. globiformis by a few rainy season sediment samples might be due to degradation of organic pollutants in the samples, or due to excess organic nutrient in the test matrices (Culp et al. Citation2017). Since different organisms have different toxicokinetics and toxicodynamics, the information obtained from the micro-biotests used in this study, was thus seen as complementary and used in an integrated way to assign toxicity classes to the tested samples.
FRB classification of bioassay results
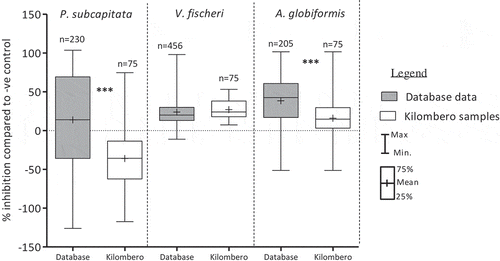
A fuzzy logic expert system is used as a tool to handle uncertain or imprecise information by allowing a subject instead of a strict decision such as yes/no, high/low, to belong to a specific category (fuzzy set) with a gradual membership value between zero and one (Keiter et al. Citation2009; Salski Citation2006). A very limited number of samples showed elevated toxic responses in the three bioassays (). Since the results of a single toxicity test system could not provide enough information for risk assessment of the study area, the bioassays results were classified in order to integrate the results of the three bioassays into the overall ecological risk posed by the KVRS samples collected from agrarian areas. Three fuzzy toxicity categories were deduced based on the distribution of data from the large database at the German research group that allowed an estimation of species specific response ranges. Compared to the database with biotests results from Europe, Kilombero samples showed lower mean inhibition responses in the P. subcapitata and A. globiformis, while A. fischeri showed an overlap in the mean toxicities (). These differences in toxicity responses could be due to presence of less effective (toxic) compounds in the Kilombero samples. Under the three fuzzy logic toxicity categories of Kilombero valley samples (sediments and soils), fuzzy rules (See supplementary material) resulted in three toxic classes for sediments and soils:
Class 1: Little or no potential risk. Seventy-three percent of Kilombero valley samples (sediments and soils) were assigned to this class. They fulfilled the following fuzzy rules: “no bioassays showed any toxic response,” or “low toxic responses (category 1) in at least two of the bioassays.”
Class 2: Critical risk. This class comprised 25% of Kilombero samples (sediments and soils) and included samples, which showed “moderate toxic responses in at least two tests,” and “no bioassay showed high responses (category 3).”
Class 3: Elevated critical risk. Only 1 sample from KVRS was assigned to this class. The fuzzy rule for this class was “high toxic responses in at least two of the bioassays (category 3) and at least moderate toxic responses in one bioassay.”
Table 4. Results of FRB classification of bioassays results of 75 samples (sediments and soils) for both rainy and dry seasons, classified according to resulted toxic responses
Figure 8. Comparison of bioassays endpoint responses between database samples and the Kilombero valley samples (soils and sediments), ***: p < 0.001, 1-way ANOVA, with posttest Dunn´s multiple comparison test
The assignment of Chita Ns and Teak Co. into class one (little or no potential risk) is caused by low toxicity shown by rainy season sediment samples to the three bioassays. Estimated land used for teak plantation (Teak Co) is about 8,000 ha while Chita Ns, had about 80.9 ha used for irrigated and paddy rice production. However, a minimum of two samples for Teak Co. and four samples for Chita Ns might not be a good representative of these plantations. The number of samples collected in these two plantations was limited by poor accessibility to the agricultural fields during rainy season due to flooding. In addition, the farms were located very far from human settlements and were surrounded by thick natural forests/vegetation cover which also limited accessibility. Sediment samples collected from Chita Ns resulted in moderate to elevated stimulation in both A. globiformis and P. subcapitata bioassays, while those from Teak Co had shown moderate stimulation in P. subcapitata and low toxic responses in A. globiformis (). This indicates that Chita Ns farms had high nutrient enrichment or organic matter due to the surrounding dense natural vegetation cover. Assignment of 1 sediment sample from sugar plantation (KSC) out of 75 samples (sediment and soils) into class three (elevated critical risk) is due to high toxic responses in the three bioassays, especially for the samples collected near the pesticide mixing zones, filling stations, and water channels draining from the sugar factory. Among the samples which showed moderate toxicity, class two (critical risk) was largely contributed to by dry season samples (soil and sediments) suggesting low bioavailability of contaminants. In dry season, there was less effect of surface washout, and therefore, good proportions of toxic chemicals such as pesticides were retained in the application sites and could be reduced by solar radiation, volatilization and microbial degradation. A few sediment samples resulted into 100% inhibition of A. globiformis, indicating that organisms were physiologically inactive upon exposure to contaminated sample matrices.
Conclusion
Eco-toxicological assessments as those performed in this study indicate the combined effect of all bioavailable toxic substances/stressors on the biochemical, physiological or metabolic functions of the test organisms. Since not all contaminants may be known and metabolites formed during biodegradation process might not be taken into consideration during analytical assessment, eco-toxicological tests provide valuable additional information for early warning or for screening purposes.
This study has shown that samples collected during dry season showed higher inhibition than rainy season samples (), implying that toxicants are more bioavailable in dry than rainy season. Although, during rainy seasons, such contaminants will be diluted, persistent pollutants like heavy metals and organochlorine pesticides have a potential to spread to a wide area in the flood plain and might contaminate the whole river basin. The study concludes that continuous use of agrochemicals in the Kilombero valley flood plain agrarian areas has a potential of causing ecological damage of the river basin and the aquatic ecosystem, and a potential of surface and groundwater contamination. During sampling surveys, it was revealed that poor households that lived in the remote villages of Kilombero valley, where big plantations were located, depended on the neighboring waterbodies being either wetlands, shallow wells, rivers or streams to provide water for domestic purposes and even fishing for household sustenance. Therefore, continued use of unhygienic water, which might be associated with agricultural drains or consuming contaminated fish might contribute to long-term human health impacts. This study has shown the suitability of using already established temperate biotest batteries for assessing and monitoring agrochemicals contamination in tropical agronomic systems. The FRB classification results revealed that, samples from highly contaminated sugarcane and rice plantations, where pesticides are used extensively, showed elevated toxicities to test organisms, while the rest of sampling stations showed no or little toxicities. Monitoring of pesticide use and management of big agronomic investments in the sensitive ecosystems such as Ramsar wetlands is recommended in order to establish potential risks to humans and aquatic life.
The major concern about anthropogenic inputs of pesticides to the ecosystem arises from the eco-toxicological impact on plants, soil organisms, and on aquatic organisms due to surface runoff and long-term health effects on animals and humans via food chains. The restricted and limited scope of eco-toxicological studies of impacts of toxic chemicals such as pesticides in Tanzania and other tropical African countries in general point out the area of research priority in the region. Identification of sensitive organisms of ecological value that can be used in toxicity testing is of vital importance, to develop sufficient eco-toxicological data on the impact of toxic chemicals emitted by agribusiness investments in Tanzania. Availability of such scientific data (database) will enhance the capacity to manage decisions by policymakers which will be coupled by scientific reality. Research is needed in tropical countries to develop a better insight of bioassays to study the potential impacts of repetitive low-level exposure of toxicants to aquatic organisms. The application of this test battery can be regarded as a pilot study for future research in monitoring rice and sugarcane production for sustainability of wetlands ecosystems in the sub-Saharan Africa.
Correction Statement
This article has been republished with minor changes. These changes do not impact the academic content of the article.
Supplemental Material
Download MS Word (17.8 KB)Acknowledgments
We gratefully acknowledge the financial support from the German Academic Exchange Service (DAAD) and the Schlumberger Foundation-Faculty for the Future. We are very thankful to the reviewers for their critical comments to improve this article.
Disclosure statement
No potential conflict of interest was reported by the authors.
Supplemental material
Supplemental data for this article can be accessed here.
Additional information
Funding
Related Research Data
References
- Abarikwu, S. O., E. B. Essien, O. O. Iyede, K. John, and C. Mgbudom-Okah. 2017. “Biomarkers of Oxidative Stress and Health Risk Assessment of Heavy Metal Contaminated Aquatic and Terrestrial Organisms by Oil Extraction Industry in Ogale, Nigeria.” Chemosphere 185: 412–422. doi:10.1016/j.chemosphere.2017.07.024.
- Ahlf, W., and S. Heise. 2005. “Sediment Toxicity Assessment: Rationale for Effect Classes (5 Pp).” Journal of Soils and Sediments 5 (1): 16–20. doi:10.1065/jss2005.01.127.
- Allan, I. J., B. Vrana, R. Greenwood, G. A. Mills, J. Knutsson, A. Holmberg, N. Guigues, A. M. Fouillac, and S. Laschi. 2006. “Strategic Monitoring for the European Water Framework Directive.” TrAC Trends in Analytical Chemistry 25 (7): 704–715. doi:10.1016/j.trac.2006.05.009.
- Boardman, J., K. Vandaele, R. Evans, and I. D. Foster. 2019. “Off‐site Impacts of Soil Erosion and Runoff: Why Connectivity Is More Important than Erosion Rates.” Soil Use and Management 1–12. doi:10.1111/sum.12496.
- Brown, A. R., G. Whale, M. Jackson, S. Marshall, M. Hamer, A. Solga, P. Kabouw, et al. 2016. “Toward the Definition of Specific Protection Goals for the Environmental Risk Assessment of Chemicals: A Perspective on Environmental Regulation in Europe.” Integrated Environmental Assessment and Management 13 (1): 17–37. doi:10.1002/ieam.1797.
- Bucheli, T. D., and K. Fent. 2009. “Induction of Cytochrome P450 as a Biomarker for Environmental Contamination in Aquatic Ecosystems.” Critical Reviews in Environmental Science and Technology 25 (3): 201–268. doi:10.1080/10643389509388479.
- Carbajo, J. B., J. A. Perdigón-Melón, A. L. Petre, R. Rosal, P. Letón, and E. García-Calvo. 2015. “Personal Care Product Preservatives: Risk Assessment and Mixture Toxicities with an Industrial Wastewater.” Water Research 72: 174–185. doi:10.1016/j.watres.2014.12.040.
- Carter, A. D. 2002. “Herbicide Movement in Soils: Principles, Pathways and Processes.” Weed Research 40 (1): 113–122. doi:10.1046/j.1365-3180.2000.00157.x.
- Coady, K., P. Browne, M. Embry, I. I. I. Hill, E. Leinala, T. Steeger, and T. Hutchinson. 2019. “When are Adverse Outcome Pathways and Associated Assays “Fit for purpose” for Regulatory Decision‐Making and Management of Chemicals?” Integrated Environmental Assessment and Management 15 (4): 633–647. doi:10.1002/ieam.4153.
- Culp, J. M., A. G. Yates, D. G. Armanini, and D. J. Baird. 2017. “Establishing Cause–Effect Relationships in Multistressor Environments.” In Methods in Stream Ecology: Volume 2: Ecosystem Function, edited by G. A. Lamberti and F. R. Hauer, Third ed., 335–351. Cambridge, Massachusetts: Academic Press. doi:10.1016/B978-0-12-813047-6.00018-8.
- DeLorenzo, M. E., G. I. Scott, and P. E. Ross. 2001. “Toxicity of Pesticides to Aquatic Microorganisms: A Review.” Environmental Toxicology and Chemistry: an International Journal 20 (1): 84–98. doi:10.1002/etc.5620200108.
- DIN 38412-48. 2002. German Standard Methods for the Examination of Water, Waste water and Sludge-Bioassays group L)-Part 48: Toxicity test with Arthrobacter globiformis for contaminated solids (L 48). Berlin https://www.beuth.de/en/standard/din-38412-48/53594175
- DIN EN ISO 11348-3. 2007. “Water Quality - Determination of the Inhibitory Effect of Water Samples on the Light Emission of Vibrio Fischeri (Luminescent Bacteria Test) - Part 3: Method Using Freeze-dried Bacteria.” https://www.iso.org/standard/40518.html doi:10.1094/PDIS-91-4-0467B.
- DIN EN ISO 8692. 2012. Water quality-Freshwater algal growth inhibition test with unicellular green algae. Berlin. https://www.iso.org/standard/54150.html doi:10.1094/PDIS-11-11-0999-PDN.
- Erban, T., M. Stehlik, B. Sopko, M. Markovic, M. Seifrtova, T. Halesova, and P. Kovaricek. 2018. “The Different Behaviors of Glyphosate and AMPA in Compost-amended Soil.” Chemosphere 207: 78–83. doi:10.1016/j.chemosphere.2018.05.004.
- Farha, W., A. A. El-Aty, M. M. Rahman, H. C. Shin, and J. H. Shim. 2016. “An Overview on Common Aspects Influencing the Dissipation Pattern of Pesticides: A Review.” Environmental Monitoring and Assessment 188 (12): 693. doi:10.1007/s10661-016-5709-1.
- Fent, K. 2004. “Ecotoxicological Effects at Contaminated Sites.” Toxicology 205 (3): 223–240. doi:10.1016/j.tox.2004.06.060.
- Gerba, C. P. 2019. “Risk Assessment.” In Environmental and Pollution Science, edited by M. L. Brusseau, I. L. Pepper, and C. P. Gerba, Third ed., 541–563. Cambridge, Massachusetts: Academic Press. doi:10.1016/B978-0-12-814719-1.00029-X.
- Gouy, V., J. C. Dur, R. Calvet, R. Belamie, and V. Chaplain. 1999. “Influence of Adsorption–Desorption Phenomena on Pesticide Run-off from Soil Using Simulated Rainfall. Pesticide.” Science 55 (2): 175–182.
- Hagner, M., M. Romantschuk, O. P. Penttinen, A. Egfors, C. Marchand, and A. Augustsson. 2018. “Assessing Toxicity of Metal Contaminated Soil from Glassworks Sites with a Battery of Biotest.” Science of the Total Environment 613: 30–38. doi:10.1016/j.scitotenv.2017.08.121.
- Hall, N. E., J. F. Fairchild, T. W. La Point, P. R. Heine, D. S. Ruessler, and C. G. Ingersoll. 1996. “Problems and Recommendations in Using Algal Toxicity Testing to Evaluate Contaminated Sediments.” Journal of Great Lakes Research 22: 545–556. doi:10.1016/S0380-1330(96)70979-6.
- Hsu, P., A. Matthäi, S. Heise, and W. Ahlf. 2007. “Seasonal Variation of Sediment Toxicity in the Rivers Dommel and Elbe.” Environmental Pollution 148 (3): 817–823. doi:10.1016/j.envpol.2007.01.026.
- Hu, Y., Z. Wang, J. Wen, and Y. Li. 2016. “Stochastic Fuzzy Environmental Risk Characterization of Uncertainty and Variability in Risk Assessments: A Case Study of Polycyclic Aromatic Hydrocarbons in Soil at a Petroleum-contaminated Site in China.” Journal of Hazardous Materials 316: 143–150. doi:10.1016/j.jhazmat.2016.05.033.
- Hund, K. 1997. “Algal Growth Inhibition Test-feasibility and Limitations for Soil Assessment.” Chemosphere 35 (5): 1069–1082. doi:10.1016/S0045-6535(97)00173-2.
- Keiter, S., T. Braunbeck, S. Heise, S. Pudenz, W. Manz, and H. Hollert. 2009. “A Fuzzy Logic-classification of Sediments Based on Data from in Vitro Biotests.” Journal of Soils and Sediments 9 (3): 168–179. doi:10.1007/s11368-009-0087-8.
- Kollman, W. S., and R. Segawa. 1995. “Interim Report of the Pesticide Chemistry Database.” Environmental Hazards Assessment Program, State of California, Environmental Protection Agency, Department of Pesticide Regulation, Environmental Monitoring and Pest Management Branch. http://citeseerx.ist.psu.edu/viewdoc/download?doi=10.1.1.432.8080&rep=rep1&type=pdf
- Lu, Y., R. Wang, Y. Zhang, H. Su, P. Wang, A. Jenkins, R. C. Ferrier, M. Bailey, and G. Squire. 2015. “Ecosystem Health Towards Sustainability.” Ecosystem Health Towards Sustainability 1 (1): 2. doi:10.1890/EHS14-0013.1.
- Maqueda, C., T. Undabeytia, J. Villaverde, and E. Morillo. 2017. “Behaviour of Glyphosate in a Reservoir and the Surrounding Agricultural Soils.” Science of the Total Environment 593: 787–795. doi:10.1016/j.scitotenv.2017.03.202.
- Materu, S. F. 2015. “Applicability of a Biotest Battery Developed for Temperate Regions to Tropical Environments: Implications for Sustainable Wetland Management –A Case Study of Kilombero Ramsar Site.” PhD Thesis, Germany: Leuphana University of Lüneburg, 233
- MNRT. 2004. Ministry of Natural Resources and Tourism: The development and Implementation of an Integrated Management Plan of Kilombero Valley Flood Plain- Ramsar Site Identification Report, Dar es Salaam, Tanzania, 160
- Muro, J., A. Lopez, A. Strauch, S. Steinbach, J. Truckenbrodt, and F. Thonfeld. 2017. “25 Years of Landscape Changes in the Kilombero Floodplain, Tanzania.” Abstract-Worldcover 2017 Conference, 14-16 March 2017, Frascati (Rome), Italy: European Space Agency-ESRIN.
- NBS. 2016. The National Bureau of Statistics, Tanzania in Figures. Dar es salaam: United Republic of Tanzania. 17–23. http://www.nbs.go.tz/index.php/en/tanzania-in-figures/277-tanzania-in-figures-2016
- OECD. 1984. “Organization for Economic Co-operation and Development, Guideline for Testing of Chemicals “Alga, Growth Inhibition test”.” http://www.oecd.org/chemicalsafety/risk-assessment/1948257.pdf
- Ogbeide, O., A. Chukwuka, I. Tongo, and L. Ezemonye. 2018. “Relationship between Geosorbent Properties and Field-based Partition Coefficients for Pesticides in Surface Water and Sediments of Selected Agrarian Catchments: Implications for Risk Assessment.” Journal of Environmental Management 217: 23–37. doi:10.1016/j.jenvman.2018.03.065.
- Okada, E., J. L. Costa, and F. Bedmar. 2016. “Adsorption and Mobility of Glyphosate in Different Soils under No-till and Conventional Tillage.” Geoderma 263: 78–85. doi:10.1016/j.geoderma.2015.09.009.
- Palma, P., L. Ledo, and P. Alvarenga. 2016. “Ecotoxicological Endpoints, are They Useful Tools to Support Ecological Status Assessment in Strongly Modified Water Bodies?” Science of the Total Environment 541: 119–129. doi:10.1016/j.scitotenv.2015.09.014.
- Power, E. A., and R. S. Boumphrey. 2004. “International Trends in Bioassay Use for Effluent Management.” Ecotoxicology 13 (5): 377–398. doi:10.1023/B:ECTX.0000035290.89590.03.
- Rakshith, D., P. Santosh, T. P. Pradeep, D. M. Gurudatt, S. Baker, H. Y. Rao, A. Pasha, and S. Satish. 2016. “Application of Bioassay-guided Fractionation Coupled with a Molecular Approach for the Dereplication of Antimicrobial Metabolites.” Chromatographia 79(23-24): 1625–1642. doi:10.1007/s10337-016-3188-8.
- RAM (Ramsar Advisory Mission) Report. 2017. Kilombero Valley, United Republic of Tanzania, Ramsar Site No. 1173
- Ramsar. 2002. “Information Sheet on Ramsar Wetlands, the Kilombero Valley Flood Plain, United Republic of Tanzania.” https://rsis.ramsar.org/ris/1173?language=en
- Salski, A. 2006. “Ecological Applications of Fuzzy Logic.” In Ecological Informatics: Scope, Techniques and Applications, edited by F. Recknage, 3–14. Berlin, Heidelberg: Springer. doi:10.1007/3-540-28426-5_1.
- Sandin, M., K. Piikki, N. Jarvis, M. Larsbo, K. Bishop, and J. Kreuger. 2018. “Spatial and Temporal Patterns of Pesticide Concentrations in Streamflow, Drainage and Runoff in a Small Swedish Agricultural Catchment.” Science of the Total Environment 610: 623–634. doi:10.1016/j.scitotenv.2017.08.068.
- Stebbing, A. R. D. 1982. “Hormesis—The Stimulation of Growth by Low Levels of Inhibitors.” Science of the Total Environment 22 (3): 213–234. doi:10.1016/0048-9697(82)90066-3.
- Sullivan, K., N. Beck, C. Sandusky, and C. Willett. 2011. “A Discussion of the Impact of US Chemical Regulation Legislation in the Field of Toxicity Testing.” Toxicology in Vitro : an International Journal Published in Association with BIBRA 25: 1231–1236. doi:10.1016/j.tiv.2011.05.005.
- Szklarek, S., M. Stolarska, I. Wagner, and J. Mankiewicz-Boczek. 2015. “The Microbiotest Battery as an Important Component in the Assessment of Snowmelt Toxicity in Urban Watercourses—Preliminary Studies.” Environmental Monitoring and Assessment 187 (2): 16. doi:10.1007/s10661-014-4252-1.
- Tonkes, M., P. J. den Besten, and D. Leverett. 2016. “Bioassays and Tiered Approaches for Monitoring Surface Water Quality and Effluents.” In Ecotoxicological Testing of Marine and Freshwater Ecosystems; Emerging Techniques, Trends and Strategies, edited by P. J. den Besten and M. Munawar, 57–100. Boca Raton: CRC Press. doi:10.1201/9781420037500.
- Topuz, E., and C. A. van Gestel. 2016. “An Approach for Environmental Risk Assessment of Engineered Nanomaterials Using Analytical Hierarchy Process (AHP) and Fuzzy Inference Rules.” Environment International 92: 334–347. doi:10.1016/j.envint.2016.04.022.
- Tsaboula, A., G. Menexes, E. N. Papadakis, Z. Vryzas, A. Kotopoulou, K. Kintzikoglou, and E. Papadopoulou-Mourkidou. 2019. “Assessment and Management of Pesticide Pollution at a River Basin Level Part II: Optimization of Pesticide Monitoring Networks on Surface Aquatic Ecosystems by Data Analysis Methods.” Science of the Total Environment 653: 1612–1622. doi:10.1016/j.scitotenv.2018.10.270.
- Tsui, M. T. K., and L. M. Chu. 2003. “Aquatic Toxicity of Glyphosate-based Formulations: Comparison between Different Organisms and the Effects of Environmental Factors.” Chemosphere 52: 1189–1197. doi:10.1016/s0045-6535(03)00306-0.
- USEPA. 1991. “Evaluation of Dredged Material Proposed for Ocean Disposal (Testing Manual).” Water: Dredged Material Management (EPA 503/8-91/001). https://www.epa.gov/sites/production/files/2015-10/documents/green_book.pdf
- USEPA. 2016. “Frank R. Lautenberg Chemical Safety for the 21st Century Act, Updates to the Toxic Substance Control Act.” Accessed 11 Oct 2019. https://uscode.house.gov/view.xhtml?path=/prelim@title15/chapter53&edition=prelim
- Wadhia, K., and K. C. Thompson. 2007. “Low-cost Ecotoxicity Testing of Environmental Samples Using Microbiotests for Potential Implementation of the Water Framework Directive.” TrAC Trends in Analytical Chemistry 26 (4): 300–307. doi:10.1016/j.trac.2007.01.011.
- Wolska, L., A. Kochanowska, and J. Namiesnik. 2009. “Application of Biotests.” Chap. 9 In Analytical Measurements in Aquatic Environments, edited by J. Namiesnik and P. Szefer, 189–222. Boca Raton: CRC Press, IWA-UK Publishing. doi:10.1201/9781420082692.
- Wolska, L., A. Sagajdakow, A. Kuczyńska, and J. Namieśnik. 2007. “Application of Ecotoxicological Studies in Integrated Environmental Monitoring: Possibilities and Problems.” TrAC Trends in Analytical Chemistry 26 (4): 332–344. doi:10.1016/j.trac.2006.11.012.
- Zhang, C., X. Hu, J. Luo, Z. Wu, L. Wang, B. Li, Y. Wang, and G. Sun. 2015. “Degradation Dynamics of Glyphosate in Different Types of Citrus Orchard Soils in China.” Molecules 20 (1): 1161–1175. doi:10.3390/molecules20011161.