
 ?Mathematical formulae have been encoded as MathML and are displayed in this HTML version using MathJax in order to improve their display. Uncheck the box to turn MathJax off. This feature requires Javascript. Click on a formula to zoom.
ABSTRACT
Investigating the attributes of the dual oasis effect and oasis–desert interactions is crucial for understanding the climatic and ecological effects of oases. In this study, oasis effect intensity (OEI) was used as an indicator to investigate the factors that contribute to the dual oasis effect. The oasis effect has two attributes: the surface oasis heating effect (OHE) occurred in winter, while the oasis cooling effect (OCE) occurred in the other three seasons, especially in summer. During the day, the OEI of the whole oasis was −12.8°C, −5.2°C, and −4.5°C in summer, spring, and autumn, respectively, which indicated a strong OCE; and OEI was 0.5°C in winter, which indicated a weaker OHE. In arid regions, the OCE dominated most of the time, but the OHE occurred in winter and cannot be ignored. In addition, through statistical analysis and energy balance analysis, high evapotranspiration of the oasis was the main factor leading to the occurrence of OCE in the summer, while low albedo to the occurrence of OHE in winter.
Introduction
Arid and semi-arid regions cover more than 30% of the Earth’s terrestrial surface (Okin, Gillette, and Herrick Citation2006), and 22% of land in China (Bai et al. Citation2014). An oasis is a type of non-zonal landscape that occurs in these arid and semi-arid regions and is supported by natural or artificial rivers (Hao, Li, and Deng Citation2016; Pan et al. Citation2017; Yu et al. Citation2019). The oases in China are concentrated in the arid regions west of the Helan Mountain-Wushaoling line, and they are connected to other oases in Central Asia. Oases perform an important role in the arid region of northwest China. Although oases constitute only ~5% of the total arid and semi-arid area in this region, more than 90% of the population and 95% of the social wealth are concentrated within these oases (Wang et al. Citation2015; Zhang and Dong Citation2015). Moreover, oases regulate the regional climate via the vegetation and water resources within them (Li et al. Citation2012).
In arid regions, the oasis effect, which has been confirmed by a numerical model of the planetary boundary layer (Liu et al. Citation2005), was commonly defined as “the cooling island effect due to the extensive evapotranspiration in oasis compare to the surroundings.” Several studies have indicated that the oasis effect is a ubiquitous phenomenon in arid regions (Kai Citation1997; Potchter et al. Citation2012), and that the factors governing the oasis effect mainly include evaporative cooling (Xiong et al. Citation2016), vegetation shading (Kotzen Citation2003), and the surface energy balance (Kai Citation1997). Furthermore, the oasis effect improves the regional microclimate (Brunel et al. Citation2006); in particular, it considerably decreases the temperature in the oasis. The majority of studies on the oasis effect in deserts have focused on the phenomenon during the daytime in summer, primarily because the desert environment is characterized by extreme summer climate conditions. A study conducted in the Tarim Basin in northwest China showed that the summer air temperature of an oasis can be 3.85–9.08°C cooler than the surrounding desert (Hao and Li, Citation2016). Another study conducted in southern Israel demonstrated that an oasis creates an “oasis cooling effect” (OCE) in summer. The intensity of the OCE was dependent upon the combined influences of synoptic conditions, time of day, and type of vegetation and ranged from 1 to 4°C (Potchter et al. Citation2008). The authors also demonstrated that the oasis created an “oasis heating effect” (OHE) during the night in winter and reached a maximum of 2°C. The dual oasis effect is a unique climate phenomenon occurring in the arid region, which is caused by the difference in physical properties between the oasis and surrounding deserts, mainly manifested as OHE in winter, while OCE in other three seasons, especially in summer. Despite previous research, the attributes of the dual oasis effect, including OCE and OHE, at diurnal and seasonal scales remain unclear. The main reason is the lack of quantitative analysis of the influencing factors, including albedo, evapotranspiration, and surface energy flux.
In the present study, the investigation of climatic effects of oases for all seasons has been conducted to fill this gap in current understanding. To provide a basis for understanding the dual oasis effect in arid regions, and to reveal the driving factors that leads to their formation, the oasis effect intensity (OEI) based on remote sensing data was evaluated and the reasons for this phenomenon based on eddy covariance system (EC) data was examined. The mains objectives of this paper were to: (a) reveal the characteristics of OEI and land surface temperature (LST) of different land-cover types (LCT) in the oasis, which included settlement, shrubland, grassland, cropland, and water body and the surrounding desert, at diurnal and seasonal scales; (b) analyze the mechanism of OEI by exploring the influence of LCT on OEI; and (c) determine the reasons for the attributes of the dual oasis effect from the perspective of biophysical characteristics and energy balance. The implication of this study was to understand the dual oasis effect, especially the OHE which is rarely mentioned in previous studies; gain insight on processes affecting the long-term stability of desert-oasis microclimate; and provide meaningful context for oasis development and desert management strategies in China’s arid regions and beyond.
Study area
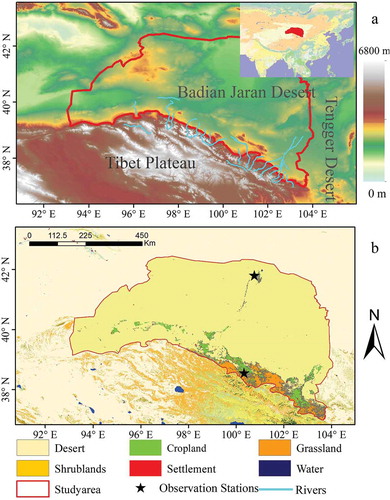
The Hexi Corridor Oasis and its surounding Desert (HCOD) is in northwest China and is surrounded by the Qilian Mountains to the south, by the Mazong, Heli, and Longshou Mountains and the Badain Jaran and Tengger Deserts to the north, by the Wushaoling Mountains to the east, and by the Kumtagh Desert to the west. This area is 323,680 km2, and the oases account for about 8.7% of this. The oases of the HCOD are beaded along a long and narrow passage, with a width of 40–100 km and stretching for 1,120 km from east to west, with an area of 27.6 × 10⁴ km2 (). The Hexi Corridor had a population of 4.92 million spread over 19 counties in 2014 (Xie et al. Citation2018). The HCOD is in a convergence zone of monsoon and continental climates, which is characterized by its distinct cold and arid landscapes, which contain scattered settlements, shrubland, grassland, cropland, water bodies, and deserts, as illustrated in ). The region has an arid continental climate with an annual rainfall reaching no more than 200 mm that mainly occurs in summer; whereas the annual potential evaporation is between 1,500 and 3,200 mm (Xie et al. Citation2018). The altitude of the HCOD decreases from the southern mountains (over 3,000 m) toward the northern convergence zone (2,000–1,300 m) ()). The region has an arid continental climate with an annual average rainfall of no more than 200 mm that mainly occurs in summer, while annual potential evaporation is between 1,500–3,200 mm (Huang et al. Citation2017). There are three independent landlocked river basins in the HCOD: the Shiyang river in the east, the Heihe river in the middle, and the Shule river in the west ()). These rivers are the only source of water for both artificial and natural oasis. Strips of oases in these three river basins play a vital ecological role in northwest China (Xie et al. Citation2018).
Figure 1. Topography (a) and land cover types (b) of the study area. Black stars represent the observations for eddy covariance system stations
Data collection and methodology
Remote sensing data and it’s pre-processing
The full archive (2016.1.1–2017.2.28) of the 8-d LST product (MOD11A2) from the Terra satellite has been downloaded (https://search.earthdata.nasa.gov), processed, and analyzed. The archive comprises the daily 1-km LST product (MOD11A1) and is stored on a 1-km grid as the average values of clear-sky during an 8-d period. It uses the generalized split-window algorithm on two thermal infrared band channels (31 with wavelength 10.78–11.28 mm and 32 with wavelength 11.77–12.27 mm), optimized to separate ranges of atmospheric column water vapor and lower boundary air surface temperatures into tractable sub-ranges. Surface emissivity was estimated from LCT using a look-up table and clouds method and clouds were masked with the MODIS Cloud Mask data product (MOD35 L2). LST products were validated with field campaigns and radiance-based validation studies and errors are within ± 0.6°C in most cases in the global (Wan Citation2014). Besides, the mean bias of the MODIS LST product was less than 1°C in Northwest China (Li et al. Citation2014; Yu et al. Citation2017; Duan et al. Citation2018). The MODIS LST product has applicability in comparison of LST over different LCTs in our study area. Particularly for northwest China, the LST view time is around 13:30 for daytime and around 01:30 for nighttime, corresponding to the pair of day/night view times for MODIS observations. To obtain the snow coverage, the MOD10A2 (2016.1.1–2017.4.30) was downloaded and maximum synthesized on a monthly scale.
The MCD12Q1 dataset describes yearly land cover properties, with 500-m spatial resolution, which was used to extract the LCT. LCT has been characterized using five global land cover classification systems (Mark et al. Citation2010). However, the International Geosphere-Biosphere Program (IGBP) classification was considered to be the most suitable to analyze land use in arid and semiarid regions of China (Ren, Zhu, and Liu Citation2012). The accuracy of the IGBP layer is estimated to be 75% globally, with a 95% confidence interval (Friedl et al. Citation2010; Zeng et al. Citation2015). Thus, the IGBP classification scheme of MODIS land-use and land-cover map (MCD12Q1) in 2014 was integrated into six LCTs including desert, settlement, shrubland, grassland, cropland, and water body, to explore the OEI of different LCTs and their effect on OEI in HCOD ().
Table 1. The land-cover types in the Hexi Corridor oasis and its surrounding desert integrated from the International Geosphere-Biosphere Program classification scheme of MODIS and the proportion of their areas
The MODIS ET data (MOD16) at 8-d intervals in 2016, which was generated using land cover, leaf area index, air temperature, air pressure, air humidity, and net radiation as input data (Mu, Zhao, and Running Citation2011), were used as the evapotranspiration data source. The mean absolute bias of MODIS ET was about 0.3 mm day−1 compared with the ET observations from eddy flux towers (Mu, Zhao, and Running Citation2011). The MODIS albedo products (MCD43B3) used in this study include black sky albedo and white sky albedo over shortwave broadband (0.3–5.0 μm), with 1-km spatial resolution and an 8-d interval in 2016 (Schaaf et al. Citation2002). We used white sky albedo in this study, and the bias of MODIS albedo was mostly less than 5% (Liu et al. Citation2009).
The MODIS images were organized in HDF-EOS format and were projected in the sinusoidal projection system. The pre-processing of MODIS images was carried out using the MODIS re-projection tool, which was used for subsetting data to an interested study area and re-projecting MODIS imagery to a universal transverse Mercator with world geodetic system 1984 datum. The quality flag, included in the MODIS product, provides information on algorithm results that can be viewed in a spatial context for each pixel (NASA Citation2013). Through QC information, this flag can be used to determine whether an algorithm result for a particular MODIS product is nominal, abnormal, or is some other defined condition that has been encountered for a pixel. The QC information was used to determine the usefulness of the MODIS product data in the present study and only the highest-quality pixels were used in our study.
Ground-based energy flux data collection
Ground-based observational data were provided by the Heihe Watershed Allied Telemetry Experimental Research (HiWATER) program (http://westdc.westgis.ac.cn/) as the main data source of surface energy balance. The EC system set observations located in desert (Desert station (100.99E, 42.11N)) and cropland (Daman station (100.37E, 38.86N), representative of a typical oasis) were used to collect the energy flux data. The EC system data were averaged over 30-min periods in 2016.1.1–2017.2.28. Data quality assessment was performed for turbulent flux in each 30-min. In addition, the 30-min flux data were rigorously filtered and the missing data were interpolated using a nonlinear regression method (Li et al. Citation2013). The energy closure ratio was from 0.78 to 1.04 with an average of 0.92. Details on the placement of the different sensors and data processing have been reported in previous studies (Li et al. Citation2013; Song et al. Citation2015; Xu et al. Citation2017). The surface energy balance is defined as:
where Rn is the net radiation, Hs the sensible heat flux, LE the latent flux, and Gs the soil heat flux. The net radiation, soil heat flux, the sensible heat flux, and latent heat flux come from the EC system data.
Oasis effect intensity (OEI) calculation
The magnitude of OEI can be expressed in terms of intensity, which is calculated as follows:
where OEI is the difference in LST between the oasis (including settlements, shrubland, grassland, cropland, water bodies, and the whole oasis) and the surrounding desert. If the difference is negative (oasis colder than desert), then there is an OCE. If the difference is positive, then there is an OHE. The greater the value of absolute OEI, the more intense the OCE or OHE, and vice versa. The LST considered in this study was subject to a larger change than the more commonly reported 2-m air temperature (Zhu et al. Citation2017).
The relationship between OEI and LST within different LCTs
A univariate linear regression analysis with the MODIS LST as the independent (or explanatory) variable and OEI as the dependent (or response) variable was applied to analyze the OEI-LST relationships with different LCTs. Significance was indicated when P < 0.05 and 0.01. Moreover, to investigate the influence of LCTs on the relationship between OEI and LST, a regression analysis was performed for each LCT both in daytime and nighttime, and the formula was as follows:
where a and b are the regression coefficients.
To identify any variability in the OEI and LST relationship on a diurnal basis, time series of both variables were separated into daytime and nighttime series based on the MODIS overpass times. In addition, seasonal daytime and nighttime time series were created for each LCT to further analyze how changing seasons affected the relationship between OEI and LST within different LCTs. Monthly measurements of OEI, LST, albedo, ET, and energy flux were averaged for each season. The seasonal values of OEI were averages over corresponding months (winter: December–February; spring: March–May; summer: June–August; autumn: September–November) according to previous research in this area (Wei Hou Citation2011).
Results and discussion
Characteristics of LST and OEI with different LCTs
LST during daytime and nighttime
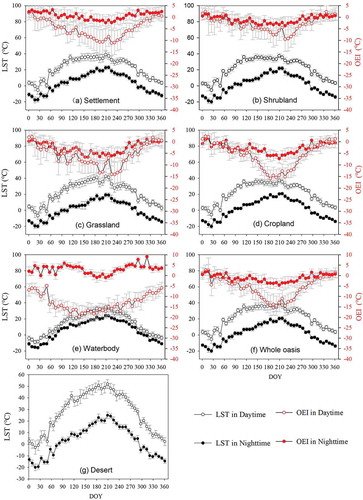
Owing to the study area being in an arid region of Central Asia, the annual variation process of the surface temperature of all LCTs presented a single peak. Desert LST varied significantly during the daytime throughout the year and ranged from −5°C in winter to almost 50°C in the Day of Year (DOY) of 225 in summer ()). The desert LSTs during the nighttime exhibited a similar trend but with a smaller range of −20 to 20°C. Owing to the biophysical characteristics of oases, the oasis LST was more moderately varied for daytime and nighttime, and the difference between day and night. For the whole oasis, the maximum LST during the daytime and nighttime was 40°C and 20°C, respectively, which occurred around the DOY of 220, while the minimum LST was −5°C and −22°C during the daytime and nighttime, respectively, which occurred around the DOY of 30. Analyzing the difference in oasis LST between day and night showed that the cropland had the most variable daily LST, followed by grassland, shrubland, settlement, and water body.
Although, the temperature in the northwest arid region experienced increases in the past 50 years (Chen et al. Citation2015; Xu and Li Citation2016), the temperature change in winter half-year and summer half-year showed the same trend, and there was no big change in temperature in 2016 compared to other years(Bai et al. Citation2019). Furthermore, the temperature difference between oasis and desert is much large than the annual variation of temperature and the annual randomness can be excluded for the study of OEI. While relatively short, this time sequence may be considered to be representative of a multi-year behavior of oasis–desert microclimatic conditions.
OEI during daytime and nighttime
The OEI, the difference in LST between the oasis and desert, exhibited a trend synchronous with that of LST, that is, the greater the LST, the greater the absolute value of OEI. For the whole oasis, the maximum OEI during the daytime and nighttime was −15°C and −4°C, respectively, which occurred around the DOY of 220, while the minimum OEI was 0.5°C and 0.4°C, respectively, which occurred around the DOY of 30.
Figure 2. Daily variation in land-surface temperature (LST) and oasis effect intensity (OEI) in all land-cover types (including desert) in 2016. The hollow dots represent the average of the day, the solid dots represent the average of the night, the black symbols represent the LST, the red symbols represent the OEI, and the gray error line represents the standard deviation (hereafter)
Attributes of OEI for different LCTs at a seasonal scale
Oasis cooling effect
To better understand the seasonal variation in OEI with different LCTs, the thermal environment should be considered. presents information regarding the seasonal values of OEI based on different LCTs in 2016. For the whole oasis, as shown in ), the OCE was observed in vegetation growing seasons including spring, summer, and autumn, both at day and night. The daytime OEI in summer reached up to 13°C, and in spring and autumn reached 5.2°C and 4.5°C, respectively. The nighttime OEI was different from the daytime OEI, and although it was observed in the corresponding seasons, the intensity was relatively small. The highest OEI was 3.3°C in summer, followed by 1.4°C and 0.6°C in spring and autumn, respectively. For each LCT, the changing trend of daytime OCE was generally consistent with those for the whole oasis; however, different LCTs have different characteristics (–)). For LCTs with vegetation (shrubland, grassland, and cropland), the OCE characteristics were similar, but with various intensity of OCE. The OEIs of different LCTs were observed in the order, cropland > grassland > shrubland for the daytime of the vegetation growing seasons. For the nighttime, this order was observed as grassland > cropland > shrubland. The OCE of the settlement was similar to the whole oasis during the daytime, but only in summer was the OCE observed at night. The water body had the strongest OCE throughout the year owing to its unique hydrothermal properties. The OCE from spring to autumn was higher than 12°C, and the lowest was observed in winter as up to 7.8°C ()). Owing to large heat capacity, water bodies store shortwave radiation during the daytime; therefore, the surface temperatures are lower than their surroundings and the OCE is strong. The oases in the Tarim Basin in Northwest China, of which the vegetation and climate characteristics exhibited OCE with the OEI highest in summer (−9.08°C), is followed by autumn (−4.24°C) and spring (−3.85°C). Besides, Farmland and water areas were found to be the key contributors that affected the OCE (Hao and Li, Citation2016). Another studies conducted on Southern Israel in the southeast coast of the Mediterranean Sea showed that all the vegetation had an OCE up to 2°C (Potchter et al. Citation2012) and 2.3°C (Saaroni et al. Citation2004) in the daytime of summer.
Oasis heating effect
Compared with the OCE, the OHE of the oasis and its components in both the daytime and nighttime throughout the year were considerably different (). For the whole oasis, a weak OHE of 0.4°C and 0.5°C occurred during the daytime and nighttime in winter, respectively. For the other LCTs, except water body, the OHE was observed during both daytime and nighttime in winter, but the OEI absolute values were small, some of which were close to zero. For the settlement, a weak OHE was recorded in the nighttime in spring. For the water body, a relatively strong OHE appeared in the nighttime throughout the year. Potchter et al. (Citation2012) investigated the influence of manmade oases on long-term climate changes occurring in the desert region of southern Israel. The results demonstrated that from nighttime throughout the morning all vegetation types were up to 2°C warmer than the surrounding desert. Since one characteristic of arid climates is extremely low nighttime temperatures during winter, warming created by the oasis has implications for human comfort and energy consumption in the desert environment. The amplitude of OHE in our study was smaller than that of study on the Mediterranean coast, mainly due to the difference of regional climate differences.
The daytime and nighttime OEI of oasis LCT showed an asymmetric diurnal variation, with a larger amplitude in daytime cooling than nighttime cooling (warming). This asymmetric diurnal cycle of OEI was significant in growing seasons, especially in summer, in which the daytime OEI was three to five times higher than the nighttime OEI. We concluded that the oasis had a strong OCE during vegetation growing seasons and a weak OHE in winter. Meanwhile, the OCE was much stronger in the day than at night, but the OHE was similar for both daytime and nighttime. From the perspective of sustainable planning, both OCE and OHE have the potential for energy conservation. Furthermore, from the perspective of human comfort, the forceful OCE occurs during the hotter seasons, especially during the daytime, and therefore lessens hot stress and creates a comfortable environment for human beings. As well as the OHE occurs during the cold season and nighttime and lessens cold stress.
Figure 3. Seasonal variation of oasis effect intensity (OEI) for all oasis land-cover types in 2016
Quantitative analysis of the response of OEI to LST and LCT
A regression analysis was applied for each LCT during daytime and nighttime to investigate the influence of LCTs on the relationship between OEI and LST (). Results revealed an inverse correlation between OEI and LST values for whole oasis and different LCTs. This means that, in general, higher LST leads to a stronger OEI. shows that the OEI-LST slope is highly dependent on the natural and artificial physical features of LCTs. There was a negative slope for all LCTs, and the slopes of the closed vegetation canopies, such as cropland and grassland, were steeper than that of sparse vegetation, such as shrubland. In addition, a notable increase in slope occurred for all LCTs when the LST exceeded 15°C except waterbody, especially in the cropland and grassland ().
Table 2. Linear regression equations between oasis effect intensity (OEI) and land-surface temperature (LST) for different land-cover types (LCTs)
Relatively speaking, the daytime regression coefficients were higher than those of the nighttime at the diurnal scale. The variation in regression coefficients was more noticeable during the daytime owing to the duration of heat and solar radiation (Zhou et al. Citation2014). The regression coefficients indicated that increases in LST led to a larger OCE (the absolute value of OEI) in oases. To summarize, we found that the relationship between OEI and LST depended on LCT and time of day. The higher the LST value was and the better the vegetation condition was, the stronger the absolute value of OEI was.
Figure 4. Scatter plots of oasis effect intensity (OEI) vs. land-surface temperature (LST) for different land-cover types (LCTs) in the daytime and nighttime
The differences in radiative temperature between the vegetation canopy and the ground affect the measurement of LST (Sandholt, Rasmussen, and Andersen Citation2002). For an area without vegetation, LST measurement typically represents the radiometric temperatures of sunlit surfaces, such as the desert. As the amount of vegetation cover increases, the radiative temperature recorded by a sensor more closely approximates the canopy temperature at complete canopy cover (Goward and Hope Citation1989). LST measurements are also subject to the influence of lower atmospheric temperatures and the temperature difference between the vegetation canopy and the soil (Friedl Citation2002). Thermal responses of vegetation can also be highly dependent on the biophysical properties of the vegetation itself (Quattrochi and Ridd Citation1998). Some internal properties, such as thermal conductivity, heat capacity, and thermal inertia, play important roles in controlling the temperature of a body at equilibrium with its environment. As a result of relatively low thermal inertia, the highest LST has been reported from bare, dry, and low-density soil (Larson and Carnahan Citation1997). Therefore, for areas characterized by low vegetation cover, surface thermal properties can strongly affect LST and OEI, through the thermal processes of convection, radiation, and conduction. Hence, the relationship between OEI (LST) and different LCTs have been investigated.
The main factors contributing to OEI variations
The OEI variations during daytime and nighttime in different seasons and the differences in OEI between daytime and nighttime for the whole oasis were shown in ). The daytime OEI absolute value in the vegetation growing seasons was higher than that of nighttime, at about 10°C in summer and about 5°C in spring and autumn, indicating that the oasis cools the land surface during nighttime and a signal of same sign but smaller magnitude than the daytime cooling. In contrast, the winter OEI values were opposite to those in growing seasons, and a weak OHE was observed during the daytime and nighttime.
The asymmetric annual and diurnal cycles of OEI result from different energy balance processes (Jia, Zhao, and Li Citation2013). LST during the daytime is controlled by incoming solar radiation, surface properties (such as albedo and emissivity), partitioning of latent and sensible heat fluxes, and mixing in the near-surface atmospheric boundary layer. Incoming solar radiation can be assumed to be similar between adjacent oasis LCTs and the surrounding desert. Therefore, surface albedo determines the amount of absorbed solar radiation. The expenditure of this energy as latent and sensible heat fluxes is controlled by vegetation activity and soil moisture status (Mu, Zhao, and Running Citation2011).
Figure 5. Seasonal variations of OEI (mean ± SD), ET (mean ± SD) and albedo OEI (mean ± SD), the difference of OEI between daytime and nighttime, and the difference of ET and albedo between oasis and desert
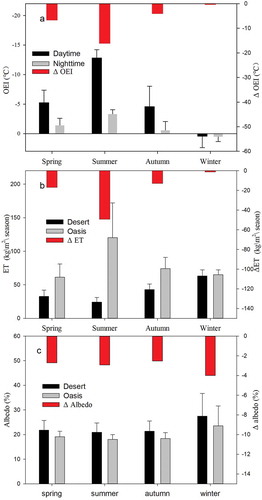
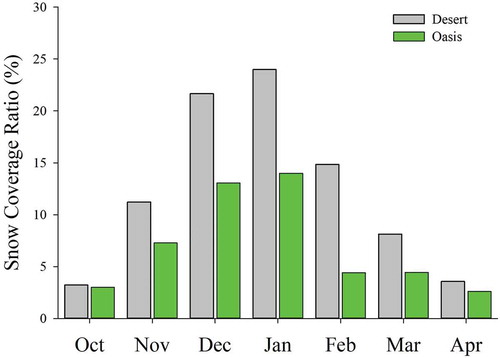
As shown in ), the albedo of the oasis was indeed lower than that of the desert throughout the year. The albedo of the oasis in the vegetation growing season was around 20%, which is 2% lower than that in the desert. Moreover, the albedo in winter reached 27% and 23% in the desert and oasis, respectively, which was higher than that of other seasons, and was mainly due to the low vegetation cover and relatively high snow cover in winter. As shown in , it began to snow in this study area in November and stopped in March of the following year with most of the snow falling between December and February, which is winter in our study. (Bourque and Mir Citation2012). The snow coverage ratio of desert and oasis reached 13% and 8% in November, peaked 25% and 15% in January and reduced 10% and 5% in March of the following year, respectively. Meanwhile, the snow cover in the oasis was less than that in the desert, which explains why the oasis albedo was lower (Zhang, Hamilton, and Wang Citation2017).
Figure 6. The snow coverage ratio of the desert and oasis from October to April of the following year in the study area
As shown in ), the distribution of ET in oasis LCTs and the difference between the oasis and the desert throughout the season showed a single peak in summer. ET in the oasis was recorded as high as 120 kg/m2/season in summer, and the highest ET (160 kg/m2/season) was observed in the cropland, followed by the grassland and shrubland (107 and 82 kg/m2/season, respectively). In contrast, desert ET during the same period was only 24 kg/m2/season, a fifth of that in oasis (). This indicated that oasis LCTs in northwest China absorbed more incoming radiation and dissipated more energy as latent heat than the surrounding desert (Davin and Nobletducoudré Citation2010). Thus, the oasis, on average, induced OCE during the daytime in the vegetation growing seasons owing to a large latent flux deficit caused by ET, which was much higher than the solar radiation surplus. These results suggested that the albedo heating effect in the vegetation growing seasons was weak and that the ET cooling effect controlled daytime OEI. Conversely, the ET cooling effect could be masked by the stronger albedo warming effect on OEI in winter. We found that the daytime and nighttime OEI were significantly negatively correlated with the difference in ET between the oasis and the desert, but was weakly correlated with the difference in albedo between the oasis and the desert ().
Table 3. Albedo and evapotranspiration (ET) values for different oasis land-cover types
The surface energy balance
The average energy flux values, obtained from the EC system, in the second month of the season were used for surface energy balance analysis. The net radiation (Rn) of all surfaces increases from sunrise until peak solar radiation. The peak energy flux of all surfaces was observed between 12:00 and 15:00. The energy flux then fell after peak Rn until 20:00 after which it maintained relative stability during the night, before increasing again after sunrise of the next day ().
The seasonal mean value of Rn in croplands followed the sequence: summer (479 w/m2) > spring (443 w/m2) > autumn (314 w/m2) > winter (216 w/m2), and values for the desert was in the same order but much smaller. There are two possible reasons for the low Rn in the desert: one was the higher albedo of the desert compared with that of the oasis (), and the other was the larger long-wave radiation due to the high LST of the desert (Xu et al. Citation2017).
The sensible heat flux (Hs) increased with increasing Rn. In summer when the peak Hs in the desert reached 241 w/m2, accounting for 53% of Rn, in cropland Hs was 65 w/m2, accounting for 13% of Rn. Also, Hs was low increasing during the morning hours, before decreasing to become negative after 15:00 in summer (). The lowest value of Hs was −28 w/m2 at about 15:00. The LE represents the annual cycle of latent heat flux and exhibited the opposite trend compared with that of Hs. The LE in the desert was small. Taking summer as an example, the peak LE in croplands reached 291 w/m2, accounting for 62% of Rn, while in the desert LE was 7.5 w/m2, accounting for 1.5% of Rn during the corresponding time.
In general, land surfaces absorb and store energy during the daytime and release energy during the nighttime. At nighttime, ET was negligible, and thus LST was closely related to the energy stored during the daytime and to the near-surface atmospheric boundary layer (Lee et al. Citation2011). Compared to the desert, the surface heat capacity increased in the oasis (e.g. as a result of an increase in soil moisture) and may result in higher levels of daytime heat storage, and thus more nighttime heating. Furthermore, the increase in air humidity (e.g. as a result of enhanced daytime evapotranspiration) near the surface and the enhancement of boundary layer cloud formation may result in higher levels of downward longwave radiation being received from the atmosphere and lower levels of outgoing longwave radiation from oasis LCTs.
The warming effect of the oasis LCTs in winter was augmented owing to the differences in albedo among oasis LCTs and the desert because the latter receives more snow cover (Bourque and Mir Citation2012; Anttila et al. Citation2018). Our findings suggested that the oasis had a net warming effect during both daytime (0.4°C) and nighttime (0.5°C) in winter. This was because ΔAlbedo was large (~4%) and the ΔET was almost negligible. The OHE during winter emphasized the existence of a significant snow albedo positive feedback.
Figure 7. Changing curves of surface energy balance for cropland and desert in different seasons (mean ± SD). Data is collected from eddy covariance systems. Terms as a function of time in the desert (right) and cropland (left) station in winter (top), spring (second row), summer (third row), and autumn (bottom). Rn is the net radiation, Hs the sensible heat flux, LE the latent heat flux, and Gs the soil heat flux. The insets show the average value of surface energy balance related to the main box from 12:00 to 14:00 (when the energy peaked)
Conclusions
The LST–OEI relationships in different LCTs in the HCOD have been investigated at different time scales (diurnal, seasonal, and annual) and the effects of different LCTs on the OEI has been analyzed. On this basis, the dual oasis effect (cooling and heating) and their dominant factors were further explored. The conclusions were as follows:
Different LCTs had significantly diverse effects on LST and OEI.The LST and OEI absolute values in the oasis were dependent on seasonal and diurnal variation. Both the daytime LST and OEI peaked in summer, followed by spring, autumn, and winter. The nighttime LST and OEI showed distinctly different patterns compared with the daytime values. For LCTs with vegetation, including shrubland, grassland, and cropland, OEI showed similar characteristics, but the intensity of OEI varies.
The OCE dominated in the oases, but the OHE could not be ignored.In the vegetation growing seasons, OCE was predominant during the daytime in all oasis LCTs and at nighttime in most oasis LCTs. In winter, the OHE was predominant, and all oasis LCTs presented OHE during the daytime and nighttime, except for water bodies and grasslands at nighttime. The oasis had a strong OCE during the vegetation growing seasons and a weak OHE in winter. Meanwhile, the daytime OCE was much stronger than the nighttime OCE, and the OHE during both day and night was similarly small.
The regression analysis between OEI and LST revealed an inverse correlation between OEI and LST for each LCT.By considering the slope of the regression functions, it was found that the regression coefficient was dependent on LCT and time of day. The slope of the daytime was steeper than that of the nighttime, which indicates that the oasis effect mainly occurs during the daytime. Furthermore, the cropland and grassland had steeper slopes than the other oasis LCTs, including shrubland, settlements, and water bodies.
ET is the main contributor to OCE in the growing season, and Albedo is the main factor of OHE in winter.The seasonal dynamic trend of ΔET was unimodal and peaked in summer at 55 mm, which is three times larger than the peak in spring or autumn. This trend was consistent with the OEI trend, which indicated that ET was a major contributor to OCE. ET cooling was a major process of the oasis effect during vegetation seasons but is negligible in winter. As compared to ET, the albedo of the oasis is lower than that of the desert all year round, but it is much lower in winter, partly due to the feedback from the snow in the desert, which could partly explain the OHE in winter. The energy balance analysis was conducted based on EC system data. Rn in the desert was lower than that of the cropland, mainly owing to its high albedo and long-wave radiation, which is the reason for OHE in winter. The LE accounted for the bulk of energy consumption in croplands, which can explain the OCE in spring, summer and autumn.
Disclosure statement
No potential conflict of interest was reported by the authors.
Additional information
Funding
References
- Anttila, K., T. Manninen, E. Jaaskelainen, A. Riihela, and P. Lahtinen. 2018. “The Role of Climate and Land Use in the Changes in Surface Albedo Prior to Snow Melt and the Timing of Melt Season of Seasonal Snow in Northern Land Areas of 40 Degrees N-80 Degrees N during 1982–2015.” Remote Sensing 10 (10): 1619. doi:10.3390/rs10101619.
- Bai, J., X. Chen, L. Li, G. Luo, and Q. Yu. 2014. “Quantifying the Contributions of Agricultural Oasis Expansion, Management Practices and Climate Change to Net Primary Production and Evapotranspiration in Croplands in Arid Northwest China.” Journal of Arid Environments 100: 31–13. doi:10.1016/j.jaridenv.2013.10.004.
- Bai, M., L. J. Niu, R. N. Wei, and X. J. Zheng. 2019. “Spatial and Temporal Distribution of Temperature in Hexi Corridor.” Journal of Gansu Sciences 31: 46–48.
- Bourque, C. P. A., and M. A. Mir. 2012. “Seasonal Snow Cover in the Qilian Mountains of Northwest China: Its Dependence on Oasis Seasonal Evolution and Lowland Production of Water Vapour.” Journal of Hydrology 454: 141–151. doi:10.1016/j.jhydrol.2012.06.008.
- Brunel, J.-P., J. Ihab, A. M. Droubi, and S. Samaan. 2006. “Energy Budget and Actual Evapotranspiration of an Arid Oasis Ecosystem: Palmyra (Syria).” Agricultural Water Management 84 (3): 213–220. doi:10.1016/j.agwat.2006.02.005.
- Chen, Y. N., Z. Li, Y. T. Fan, H. J. Wang, and H. J. Deng. 2015. “Progress and Prospects of Climate Change Impacts on Hydrology in the Arid Region of Northwest China.” Environmental Research 139: 11–19. doi:10.1016/j.envres.2014.12.029.
- Davin, E. L., and N. D. Nobletducoudré. 2010. “Climatic Impact of Global-scale Deforestation: Radiative versus Nonradiative Processes.” Journal of Climate 23 (1): 97. doi:10.1175/2009JCLI3102.1.
- Duan, S. B., Z. L. Li, H. Wu, P. Leng, M. F. Gao, and C. G. Wang. 2018. “Radiance-based Validation of Land Surface Temperature Products Derived from Collection 6 MODIS Thermal Infrared Data.” International Journal of Applied Earth Observation and Geoinformation 70: 84–92. doi:10.1016/j.jag.2018.04.006.
- Friedl, M. A. 2002. “Forward and Inverse Modeling of Land Surface Energy Balance Using Surface Temperature Measurements.” Remote Sensing of Environment 79 (2): 344–354. doi:10.1016/S0034-4257(01)00284-X.
- Friedl, M. A., D. Sulla-Menashe, B. Tan, A. Schneider, N. Ramankutty, A. Sibley, and X. Huang. 2010. “MODIS Collection 5 Global Land Cover: Algorithm Refinements and Characterization of New Datasets.” Remote Sensing of Environment 114 (1): 168–182. doi:10.1016/j.rse.2009.08.016.
- Goward, S. N., and A. S. Hope. 1989. “Evapotranspiration from Combined Reflected Solar and Emitted Terrestrial Radiation: Preliminary FIFE Results from AVHRR Data.” Advances in Space Research 9 (7): 239–249. doi:10.1016/0273-1177(89)90169-5.
- Hao, X., and W. Li. 2016. “Oasis Cold Island Effect and Its Influence on Air Temperature: A Case Study of Tarim Basin, Northwest China.” Journal of Arid Land 8 (2): 172–183. doi:10.1007/s40333-015-0060-x.
- Hao, X., W. Li, and H. Deng. 2016. “The Oasis Effect and Summer Temperature Rise in Arid Regions - Case Study in Tarim Basin.” Scientific Reports 6. doi:10.1038/srep35418.
- Huang, S., Q. Feng, Z. X. Lu, X. H. Wen, and R. C. Deo. 2017. “Trend Analysis of Water Poverty Index for Assessment of Water Stress and Water Management Polices: A Case Study in the Hexi Corridor, China.” Sustainability 9 (5): 17. doi:10.3390/su9050756.
- Jia, J. H., W. Z. Zhao, and S. B. Li. 2013. “Regional Evapotranspiration Rate of Oasis and Surrounding Desert.” Hydrological Processes 27 (24): 3409–3414. doi:10.1002/hyp.v27.24.
- Kai, K. 1997. “Oasis Effect Observed at Zhangye Oasis in the Hexi Corridor, China.” Journal of the Meteorological Society of Japan 75: 1171–1178. doi:10.2151/jmsj1965.75.6_1171.
- Kotzen, B. 2003. “An Investigation of Shade under Six Different Tree Species of the Negev Desert Towards Their Potential Use for Enhancing Micro-climatic Conditions in Landscape Architectural Development.” Journal of Arid Environments 55 (2): 231–274. doi:10.1016/S0140-1963(03)00030-2.
- Larson, R. C., and W. H. Carnahan. 1997. “The Influence of Surface Characteristics on Urban Radiant Temperatures.” Geocarto International 12 (3): 5–16. doi:10.1080/10106049709354592.
- Lee, X., M. L. Goulden, D. Y. Hollinger, A. Barr, T. A. Black, G. Bohrer, R. Bracho, et al. 2011. “Observed Increase in Local Cooling Effect of Deforestation at Higher Latitudes.” Nature 479: 384. doi:10.1038/nature10588.
- Li, B. F., Y. N. Chen, Z. S. Chen, and W. H. Li. 2012. “Trends in Runoff versus Climate Change in Typical Rivers in the Arid Region of Northwest China.” Quaternary International 282: 87–95. doi:10.1016/j.quaint.2012.06.005.
- Li, H., D. L. Sun, Y. Y. Yu, H. Y. Wang, Y. L. Liu, Q. H. Liu, Y. M. Du, H. S. Wang, and B. A. Cao. 2014. “Evaluation of the VIIRS and MODIS LST Products in an Arid Area of Northwest China.” Remote Sensing of Environment 142: 111–121. doi:10.1016/j.rse.2013.11.014.
- Li, X., G. Cheng, S. Liu, Q. Xiao, M. Ma, R. Jin, T. Che, Q. Liu, W. Wang, and Y. Qi. 2013. “Heihe Watershed Allied Telemetry Experimental Research (Hiwater): Scientific Objectives and Experimental Design.” Bulletin of the American Meteorological Society 94 (8): 1145–1160. doi:10.1175/BAMS-D-12-00154.1.
- Liu, J., C. Schaaf, A. Strahler, Z. Jiao, Y. Shuai, Q. Zhang, M. Roman, J. A. Augustine, E. G. Dutton, and C. Liu. 2009. “Validation of Moderate Resolution Imaging Spectroradiometer (MODIS) Albedo Retrieval Algorithm: Dependence of Albedo on Solar Zenith Angle.” Journal of Geophysical Research Atmospheres 114 (D1):1–11. doi:10.1029/2008jd009969.
- Liu, S. H., Y. Hu, F. Hu, F. M. Liang, J. H. Wang, and H. P. Liu. 2005. “Numerical Simulation of Land-atmosphere Interaction and Oasis Effect over Oasis-desert.” Chinese Journal of Geophysics-Chinese Edition 48 (5): 1019–1027.
- Mark, A. F., S.-M. Damien, T. Bin, S. Annemarie, R. Navin, S. Adam, and H. Xiaoman. 2010. “MODIS Collection 5 Global Land Cover: Algorithm Refinements and Characterization of New Datasets.” Remote Sensing of Environment 114 (1): 168–182. doi:10.1016/j.rse.2009.08.016.
- Mu, Q., M. Zhao, and S. W. Running. 2011. “Improvements to a MODIS Global Terrestrial Evapotranspiration Algorithm.” Remote Sensing of Environment 115 (8): 1781–1800. doi:10.1016/j.rse.2011.02.019.
- NASA. 2013. MODIS Land Surface Temperature Products Users’ Guide.
- Okin, G. S., D. A. Gillette, and J. E. Herrick. 2006. “Multi-scale Controls on and Consequences of Aeolian Processes in Landscape Change in Arid and Semi-arid Environments.” Journal of Arid Environments 65 (2): 253–275. doi:10.1016/j.jaridenv.2005.06.029.
- Pan, T., D. S. Lu, C. Zhang, X. Chen, H. Shao, W. H. Kuang, W. F. Chi, Z. J. Liu, G. M. Du, and L. Z. Cao. 2017. “Urban Land-Cover Dynamics in Arid China Based on High-Resolution Urban Land Mapping Products.” Remote Sensing 9 (7): 730. doi:10.3390/rs9070730.
- Potchter, O., D. Goldman, D. Iluz, and D. Kadish. 2012. “The Climatic Effect of a Manmade Oasis during Winter Season in a Hyper Arid Zone: The Case of Southern Israel.” Journal of Arid Environments 87: 231–242. doi:10.1016/j.jaridenv.2012.07.005.
- Potchter, O., D. Goldman, D. Kadish, and D. Iluz. 2008. “The Oasis Effect in an Extremely Hot and Arid Climate: The Case of Southern Israel.” Journal of Arid Environments 72 (9): 1721–1733. doi:10.1016/j.jaridenv.2008.03.004.
- Quattrochi, D. A., and M. K. Ridd. 1998. “Analysis of Vegetation within a Semi-arid Urban Environment Using High Spatial Resolution Airborne Thermal Infrared Remote Sensing Data.” Atmospheric Environment 32 (1): 19–33. doi:10.1016/S1352-2310(97)00179-9.
- Ren, Z., H. Zhu, and X. Liu. 2012. “Spatio-temporal Differentiation of Land Covers on Annual Scale and Its Response to Climate and Topography in Arid and Semi-arid Region.” Transactions of the Chinese Society of Agricultural Engineering 28 (15): 205–214.
- Saaroni, H., A. Bitan, E. Ben Dor, and N. Feller. 2004. “The Mixed Results Concerning the ‘oasis Effect’ in a Rural Settlement in the Negev Desert, Israel.” Journal of Arid Environments 58 (2): 235–248. doi:10.1016/j.jaridenv.2003.08.010.
- Sandholt, I., K. Rasmussen, and J. Andersen. 2002. “A Simple Interpretation of the Surface temperature/vegetation Index Space for Assessment of Surface Moisture Status.” Remote Sensing of Environment 79 (2): 213–224. doi:10.1016/S0034-4257(01)00274-7.
- Schaaf, C. B., F. Gao, A. H. Strahler, W. Lucht, X. Li, T. Tsang, N. C. Strugnell, X. Zhang, Y. Jin, and J. P. Muller. 2002. “First Operational BRDF, Albedo Nadir Reflectance Products from MODIS.” Remote Sensing of Environment 83 (1): 135–148. doi:10.1016/S0034-4257(02)00091-3.
- Song, Y., M. G. Ma, L. Jin, and X. F. Wang. 2015. “A Revised Temporal Scaling Method to Yield Better ET Estimates at A Regional Scale.” Remote Sensing 7 (5): 6433–6453. doi:10.3390/rs70506433.
- Wan, Z. 2014. “New Refinements and Validation of the Collection-6 MODIS Land-surface temperature/emissivity Product.” Remote Sensing of Environment 140: 36–45. doi:10.1016/j.rse.2013.08.027.
- Wang, T., X. Xue, L. Zhou, and J. Guo. 2015. “Combating Aeolian Desertification in Northern China.” Land Degradation & Development 26 (2): 118–132. doi:10.1002/ldr.v26.2.
- Wei Hou, S. S. 2011. “Season Division and Its Temporal and Spatial Variation Features of General Atmospheric Circulation in East Asia.” Acta Physica Sinica 60 (10): 109201.
- Xie, Y., Q. Bie, H. Lu, and L. He. 2018. “Spatio-Temporal Changes of Oases in the Hexi Corridor over the past 30 Years.” Sustainability 10 (12): 4489. doi:10.3390/su10124489.
- Xiong, Y. J., S. H. Zhao, J. Yin, C. Li, and G. Y. Qiu. 2016. “Effects of Evapotranspiration on Regional Land Surface Temperature in an Arid Oasis Based on Thermal Remote Sensing.” Ieee Geoscience and Remote Sensing Letters 13 (12): 1885–1889. doi:10.1109/LGRS.2016.2616409.
- Xu, M. Q., and Z. L. Li. 2016. “Accumulated Temperature Changes in Desert Region and Surrounding Area during 1960–2013: A Case Study in the Alxa Plateau, Northwest China.” Environmental Earth Sciences 75 (18). doi:10.1007/s12665-016-6084-5.
- Xu, Z., Y. Ma, S. Liu, W. Shi, and J. Wang. 2017. “Assessment of the Energy Balance Closure under Advective Conditions and Its Impact Using Remote Sensing Data.” Journal of Applied Meteorology & Climatology 56 (1): 127–140. doi:10.1175/JAMC-D-16-0096.1.
- Yu, W. P., M. G. Ma, Z. L. Li, J. L. Tan, and A. A. Wu. 2017. “New Scheme for Validating Remote-Sensing Land Surface Temperature Products with Station Observations.” Remote Sensing 9 (12): 24. doi:10.3390/rs9121210.
- Yu, Y., Y. Y. Pi, X. Yu, Z. J. Ta, L. X. Sun, M. Disse, F. J. Zeng, Y. M. Li, X. Chen, and R. D. Yu. 2019. “Climate Change, Water Resources and Sustainable Development in the Arid and Semi-arid Lands of Central Asia in the past 30 Years.” Journal of Arid Land 11 (1): 1–14. doi:10.1007/s40333-018-0073-3.
- Zeng, T., Z. X. Zhang, X. L. Zhao, X. Wang, and L. J. Zuo. 2015. “Evaluation of the 2010 MODIS Collection 5.1 Land Cover Type Product over China.” Remote Sensing 7 (2): 1981–2006. doi:10.3390/rs70201981.
- Zhang, C. X., K. Hamilton, and Y. Q. Wang. 2017. “Monitoring and Projecting Snow on Hawaii Island.” Earths Future 5 (5): 436–448. doi:10.1002/eft2.2017.5.issue-5.
- Zhang, Z. C., and Z. B. Dong. 2015. “Grain Size Characteristics in the Hexi Corridor Desert.” Aeolian Research 18: 55–67. doi:10.1016/j.aeolia.2015.05.006.
- Zhou, W., Y. Qian, X. Li, W. Li, and L. Han. 2014. “Relationships between Land Cover and the Surface Urban Heat Island: Seasonal Variability and Effects of Spatial and Thematic Resolution of Land Cover Data on Predicting Land Surface Temperatures.” Landscape Ecology 29 (1): 153–167. doi:10.1007/s10980-013-9950-5.
- Zhu, W., A. Lű, S. Jia, J. Yan, and R. Mahmood. 2017. “Retrievals of All-weather Daytime Air Temperature from MODIS Products.” Remote Sensing of Environment 189: 152–163. doi:10.1016/j.rse.2016.11.011.