
 ?Mathematical formulae have been encoded as MathML and are displayed in this HTML version using MathJax in order to improve their display. Uncheck the box to turn MathJax off. This feature requires Javascript. Click on a formula to zoom.
ABSTRACT
There is debating over the question of whether the large-scale ‘Grain for Green’ program on the Loess Plateau of China threatens regional food security. Self-sufficiency index and cropland pressure index were used to assess food security on the Loess Plateau after the implementation of revegetation program. The results showed that the ‘Grain for Green’ program initially had a considerable impact on regional food security, where grain yield fell from 1999 to 2001, resulting in a lower grain self-sufficiency and increased farmland stress. Subsequently, grain yield in this region increased due to the elevated agricultural material input and increased construction of terraces and check dams. The grain self-sufficiency index would have increased to 96.55% if there were improvements to the agricultural conditions, such as fertilization and irrigation, which would have resulted in an increase in the crop yield per unit of 20%. However, the grain self-sufficiency increased to 105.25% via the construction of terraces and check dams. Thus, the government should further expand the ‘Grain for Green’ program in coordination with improvements to the agricultural production conditions and the construction of terraces and check dams on the Loess Plateau.
Introduction
Tackling hunger is one of the greatest global challenges of our time (Wheeler and von Braun Citation2013). Sustainably meeting the global food demand has attracted considerable attention over the past several years (Khoury et al. Citation2014; West et al. Citation2014). In 2009, the Food and Agriculture Organization of the United Nations (Citation2009) reported on the food security outlook for 2050, determining that global agricultural production must increase by 70% to feed the rapidly growing population. The projected 34% increase in the global population will predominantly occur in developing countries. China’s population is predicted to grow by more than 100 million, peaking at 1.46 billion near 2030 (The State Council of the People’s Republic of China Citation2016). At present, food production in China faces unprecedented challenges. Securing a supply of agricultural products for the growing population is the most important challenge that currently requires a solution (Li et al. Citation2016a; Kang et al. Citation2017).
For the past several decades, China has fed ~22% of the world’s population with only 7%–8% of global agricultural land (Gong Citation2011). This significant achievement, which has allowed China to be self-sufficient in terms of grain consumption, won worldwide praise for agriculture self-support. However, the food crisis in China cannot be ignored due to the conversion of already scarce cultivable land into areas for non-agricultural uses. Since China’s reform and opening in the 1980s, the country has experienced rapid urbanization, resulting in the extensive loss of cultivable land (He et al. Citation2017). However, the conflict between the population and land has become increasingly acute since the “Grain for Green” program debuted in 1999.
The “Grain for Green” program was launched by the Chinese government in 1999 to increase vegetative cover and decrease soil erosion on sloped croplands (Xu et al. Citation2018; Shi et al. Citation2019a). This large-scale revegetation program is the largest ecological restoration program attempted by any country, let alone China (Chen et al. Citation2015). To date, the program has converted more than 30,000 km2 of rain-fed cropland to forest or grassland on the Loess Plateau, resulting in a 25% increase in vegetative cover over the past decade (Feng et al. Citation2016). The program has helped restore the degraded ecosystem by improving soil conservation and carbon sequestration, as well as reducing floods and sediment transport (Wang et al. Citation2016; Li et al. Citation2019; Shi et al. Citation2019b). However, ensuring the food supply has continuously been the top priority in China. Government managers and scholars in China are currently debating over the question of whether the large-scale revegetation program threatens food security (Xu et al. Citation2006).
Recent studies by Chen et al. (Citation2015) and Lu et al. (Citation2013) simulated the impact that cropland set-asides have on the grain supply. However, analyzing the simple linear relationship between “Grain for Green” and grain yield does not take into account other important impact factors, such as terrace and check dam construction and improved agricultural production conditions (i.e., increases in fertilization, irrigated area, and agricultural machinery power), which has resulted in a large estimation error. Recently, a variety of ecological construction programs have been implemented on the Loess Plateau. By the end of 2011, there were more than 10,000 km2 of terraced land, 5,470 main check dams, and more than 50,000 lower-level check dams (Xu et al. Citation2018). What is the contribution of terraced lands and dam fields to the regional food supply? Could improved production conditions increase the comprehensive grain yield and compensate for the lost grain yield due to the sloped land revegetation? Surprisingly, to our knowledge, despite the importance of such questions, few studies have attempted or are currently attempting to quantify the integrated effects that the variety of ecological and production conditions have on regional food security levels. In this study, we identified the factors that influence grain yield on the Loess Plateau of China and assessed the balance between green lands and grain trade by synthesizing terrace and check dam construction and agricultural condition data. The results provide valuable insights that should be considered in the government’s further implementation of the “Grain for Green” program.
Materials and method
Study area
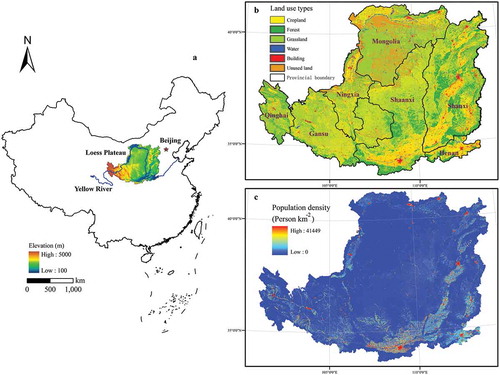
This study was conducted across the entire Loess Plateau in China, which covers an area of approximately 640,000 km2 in the upper and middle reaches of the Yellow River, including 284 counties in seven provinces (Shanxi, Shaanxi, Ningxia, Mongolia, Gansu, Qianghai, and Henan; ). The average annual precipitation on the Loess Plateau commonly less than 500 mm (Fu et al. Citation2017), the majority of which falls from June to September, where 60–70% of the annual total occurs in the form of high intensity rainstorms (Lü et al. Citation2012). The grain crops in the area are dominated by wheat, maize, rice, and sorghum. The area is mostly covered by a loess-paleosol layer with soils characterized by a clay-loam texture (Zhu et al. Citation1983). The Loess Plateau is an ecologically vulnerable region (Fu et al. Citation2017). This area is well known for its high soil erosion rates, with an average erosion modulus of 5,000–10,000 t km−2 (Gao Citation2001). Now, more than 60% of the area is characterized by hills and gullies, with an elevation range of 100–5000 m ()), owing to massive soil erosion over the past thousands of years (Zhao et al. Citation2013). Rocky, plain and desert areas on the Loess Plateau are 59,717, 64,217 and 106,658 km2 (with the proportions of 9%, 10% and 17%), respectively. Grassland, cropland, and forest are the main land-use types of the Loess Plateau, accounting for 39.58%, 29.96%, and 20.23%, respectively ()). The Loess Plateau accounts for 6.64% of the Chinese territory and supports 8.5% of the Chinese population. At the end of 2015, the population in the region had reached approximately 126.8 million, with an average population density of 196 people per km2 ()), which is four-fold higher than in the early 1950s. As a result, human pressure upon land resources and the food supply has significantly increased in this region.
Figure 1. Geographical data for the Loess Plateau: (a) Location and digital elevation, (b) Land use in 2015, (c) Population density in 2015
Data sources
Two datasets were used to estimate the effects that cropland set-asides have on the regional food security. The dataset containing total population, grain yield, and agricultural conditions (i.e., agricultural machine power, fertilization, agricultural population, pesticide use, disaster area and irrigated area) was derived from China Statistical Yearbooks covering the years from 1985 to 2015. The agricultural population in China refers to the people who live in rural areas and take agricultural income as their main source of livelihood. The dataset containing ecological construction programs, including “Grain for Green” (the forestry statistics include the areas of afforestation and natural restoration), field terracing and the construction of check dams, was obtained from forestry statistics (the data was provided by Yellow River Conservancy Commission of the Ministry of Water Resources). Spatial data on land use, digital elevations, and population density levels of the Loess Plateau were downloaded from the Data Center for Resources and Environmental Sciences at the Chinese Academy of Sciences (http://www.resdc.cn). Regional normalized difference vegetation index (NDVI) data were provided by the Cold and Arid Regions Science Data Center (http://westdc.westgis.ac.cn).
Methodology
Self-sufficiency index
Self-sufficiency in food production is an important index for assessing a region’s ability to generate enough food to support its population, which relates the grain yield rate to the grain consumption, as follows:
where represents the self-sufficiency index, G represents the annual grain yield, k represents the annual minimal grain consumption per capita (i.e., China recommends a 380 kg grain per capita), and P represents the total population. According to the white book on China’s grain problem (Information Office of the State Council of the People’s Republic of China Citation1996), the baseline grain self-sufficiency rate in China is 95%, such that food security risk is high when the index is less than 90%.
Cropland pressure index
The cropland pressure index was used to measure the cultivated land shortage and reflects regional food security (Ye et al. Citation2017), which can be expressed with the following equations:
and
where K represents the cropland pressure index, represents the minimum cropland area per capita,
represents the actual cropland area per capital,
represents the self-sufficiency index, Gr represents the grain demand per capital, y represents the grain yield per hectare (ha), q represents the ratio of grain crop sown area to the total sown area, and m represents the multiple crop index. A cropland pressure > 1 indicates that there is high pressure on sustainable cropland use and an increased possibility of a food crisis.
Ecosystem service analysis
Soil conservation service
where SCS is soil conservation service, Ap is the potential soil loss, and A is the actual soil loss (Feng et al. Citation2017).
and
where R is the rainfall erosivity factor. K is the soil erodibility factor, L and S are slope factors indicate slope length and slope steepness, respectively. C is vegetation cover factor. P is support practice factor.
Carbon sequestration
where C is carbon sequestration (Yang et al. Citation2018). Cabove and Cbelow represent above-ground and underground biomass, respectively. Csoil is soil carbon storage. Cdead is the litter.
Water production
where Q is water production (Jia et al. Citation2014). PPT is precipitation derived from weather stations. ET is evapo-transpiration.
where PET represents potential ET and LAI is leaf area index.
Data analysis
Spatial data on land use (a spatial resolution of 30 m), digital elevation (a spatial resolution of 1000 m) and NDVI (a spatial resolution of 30 m) were analyzed in ArcGIS. Population and grain yield per hectare predictions were calculated using the GM (1, 1) model. GM (1, 1) is a time series forecasting model, which has been successfully applied in numerous disciplines, i.e., population, consumption, and education (Chen and Huang, Citation2013; Hamzacebi and Es Citation2014). The equations of the equations of GM (1, 1) model were provided in the Supplementary Material.
Trends for the increasing population and grain production per capita were analyzed using the Mann-Kendall test. Pearson’s correlation and liner regression analyses were used to examine the relationship between the grain yield and agriculture production with SPSS 16.0.
Results
“Grain for green” and grain yield on the loess plateau
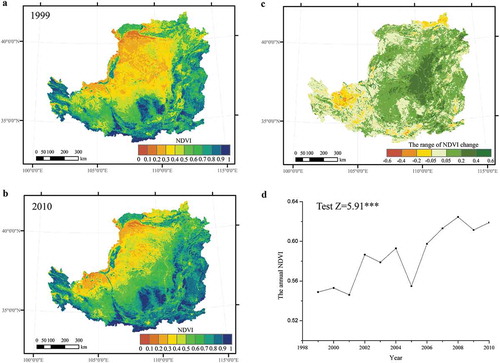
After the implementation of revegetation programs, there has been a steady increase in the revegetation area. Based on statistical data, the “Grain for Green” area increased from 43.36 × 10⁴ ha in 1999 to 373.72 × 10⁴ ha in 2010, corresponding to an increase in the revegetation area from 3.56 to 32.15% over 10 years (). The peak reclamation time associated with the “Grain for Green” program occurred in its initial years. From 1999 to 2003, the “Grain for Green” area increased seven-fold, from 43.36 × 10⁴ ha to 326.99 × 10⁴ ha. The growth in areas associated with the “Grain for Green” program then slowed. The NDVI has been widely used to quantify vegetative cover (Cao et al. Citation2018; Li et al. Citation2016b). Here, the NDVI showed distinct spatial and temporal changes in the 10 years after “Grain for Green” program implementation, indicating significant vegetative restoration on the Loess Plateau (, b)). The variability in the NDVI throughout regions containing hills and gullies (located in the middle of the Loess Plateau, i.e., the main areas reclaimed in the “Grain for Green” program) was greater than in other regions, with an increase of more than 20% ()). In contrast, changes in the NDVI in sand and desert regions (i.e., northern and western areas of the Loess Plateau) and irrigated regions (i.e., southern areas of the Loess Plateau) were minimal. The mean annual value of the NDVI exhibited a significant increasing trend in the 2000s (Z = 5.91, P < 0.001), with an annual increase of 1.16% ()).
Table 1. “Grain for Green” area and its effect on annual grain yield from 1999 to 2010 on the Loess Plateau of China
Figure 2. The normalized difference vegetation index (NDVI) on the Loess Plateau of China: (a) NDVI in 1999 (before the implementation of the “Grain for Green” program); (b) NDVI in 2010 (10 years after the “Grain for Green” program was implemented); (c) The range of the NDVI change (from 1999 to 2010); (d) The annual NDVI from 1999 to 2010
From 1985 to 2015, the annual grain yield of the Loess Plateau increased, on average, by 3.18%, from 25.14 to 49.16 million tons (i.e., the Mann-Kendall test showed a significant increasing trend; Z = 5.91 and p < 0.001; )). However, the increase in the total grain output was not linear and was characterized by three phases. First, the total grain output increased volatility in the initial 13 years (i.e., a net increase of 15.24 million tons from 1985 to 1998). Thereafter, the total grain yield of the Loess Plateau significantly decreased over the next several years (i.e., a net decrease of 10.49 million tons from 1999 to 2001). Then, the grain output recovered, characterized by an increasing growth trend since 2002 (i.e., an annual rate of increase at 3.94%, which represents a 16.66 million ton increase between 2002 and 2015).
Figure 3. Grain yield (a), sown area of grain crop and grain yield per hectare (b), the population (c), and grain yield per capita (d) of the Loess Plateau from 1985 to 2015. The Z value is the result of the Mann–Kendall test. A positive Z value indicates an increasing trend, and *** indicates that the trend was significant at the 0.001 level
The sown area of the grain crop and grain yield per unit are important factors that impact the grain yield. From 1985 to 1998, the grain crop sown area in the region remained stable at 1220.2 × 104 ha ()). Over the following 10 years, the change in grain crop sown area had a “V”-shaped trend. There was a rapid and dramatic decrease between 1999 and 2003 (with the lowest grain crop sown area at 1000.7 × 104 ha in 2003), followed by a steady increase of 153.5 × 10⁴ ha from 2004 to 2008. The grain crop sown area trend has steadily risen since 2009 (the average grain crop sown area was 1149.1 × 104 ha for the last seven years). Crop yield per hectare on the Loess Plateau steadily increased from 2108.1 kg ha−1 in 1985 to 3164.51 kg ha−1 in 1998 ()). The crop yield per hectare then remained stable at 2800 kg ha−1 from 1999 to 2001. From 2002, there was a rapid increase in the crop yield per hectare, which reached 4326.1 kg ha−1 in 2015.
Regional food security
Over the last several decades, there has been a rapid increase in the population of the Loess Plateau. From 1985 to 2015, the increasing trend in the regional population was near linear (R2 = 0.99), increasing from 90.67 to 126.55 million, i.e., an increase of 39.56% ()). The change in grain yield per capita was similar to that of the total grain output from 1985 to 2015 ()). The general trend in the grain yield per capita increased (i.e., the Mann-Kendall test showed a significant increasing trend; Z = 4.26 and p < 0.001) from 277.3 kg in 1985 to 387.5 kg in 2015. However, the per capita grain yield significantly decreased for several years, from 369.9 kg in 1998 to 265.1 kg in 2001 (the lowest level in 30 years).
The development of self-sufficiency on the Loess Plateau can be divided into three phases. The first phase (1985–1998) of self-sufficiency was characterized by an increasing trend but the index for this period was < 95% (). The second phase (1999–2001) showed a rapid decrease over these three years, reaching the lowest recorded value of 67.77% in 2001. In the third phase (2002–2015), the self-sufficiency index increased from 75.20% in 2002 to 101.99% in 2015, i.e., an average annual growth of 1.19%. The cropland pressure was relatively stable at 1.22 before 1998. Thereafter, the cropland pressure increased rapidly in 1999, reaching a peak of 1.49. Over the following several years, the pressure became steady again at an elevated value of 1.32.
Figure 4. Self-sufficiency and cropland pressure indices on the Loess Plateau of China from 1985 to 2015
Factors influencing grain yield
Agricultural production conditions, including fertilization, pesticide application, agricultural machinery power, and irrigated areas, all had significant positive correlations with the grain yield per unit and total grain yield (). Regression analysis showed similar results with Pearson’s correlation, where agricultural factors, including fertilization, pesticide application, agricultural machinery power, and irrigated area, had significant relationships with both the grain yield per unit and grain yield (P < 0.001; see ). From 1985 to 2015, farmers increased their input of agricultural materials, including chemical fertilizers, pesticides, and agricultural machinery power, to expand the grain yield (). The annual growth rates for the application of these agricultural materials increased after the implementation of the “Grain for Green” program. Before the “Grain for Green” program, the grain crop sown area had a positive correlation with the grain yield per unit and total grain yield, whereas the sown area had a negative correlation with grain yield per hectare after program implementation. Natural disasters, such as drought, flood, hail, and freezes cycles, were counted using the statistical yearbooks, which showed that the disaster area had a negative correlation with the grain yield per hectare and total grain yield (the regression was y = – 0.002x + 3.840, R2 = 0.067, P > 0.05, and y = – 2.022x + 4559.750, R2 = 0.115, P < 0.05; see ). In particular, the number of disasters was high at the end of the 1990s and beginning of the 2000s. Agricultural population density had a positive correlation with the grain yield per unit and production before 1999, such that the agricultural population increased by 23% from 1985 to 1998. The agricultural population density the decreased sharply by 30% in 10 years, yielding a negative correlation coefficient. The area effected by the “Grain for Green” program had a negative correlation with the total grain yield (regression of y = – 2.738x + 2976.996, R2 = 0.474, P < 0.01), whereas it had a positive correlation with the grain yield per unit (regression of y = 0.003x + 2.573, R2 = 0.774, P < 0.001). The grain loss as a result of land set-asides was 40.28 × 10⁴ t in 1999, which increased to 347.18 × 10⁴ t in 2010 (). The percentage of grain lost to the implementation of the “Grain for Green” program increased eight-fold from 1.19% in 1999 to 8.99% in 2005. The construction of terraces and check dams had a positive correlation with the grain yield per unit and production, with the correlations that were significant at 0.01 levels. The construction of terraces and check dams increased from 1999 to 2007 (). Annual terrace construction increased from 14.77 to 76.44 × 10⁴ ha, with an annual growth rate of 6.85%. Check dam fields constructed in 1999 covered 1.81 × 10⁴ ha, which increased to 6.9 × 10⁴ ha in 2007. The contribution of terraces and check dam fields increased from 34.42 × 10⁴ t in 1999 to 168.89 × 10⁴ t in 2007.
Table 2. Pearson’s correlations for both grain yield per unit and annual grain yield with agricultural production conditions before and after “Grain for Green.”
Table 3. Regression analysis for both grain yield per unit and grain yield with agricultural production
Table 4. The contribution of terraces and check dam fields to annual grain yield from 1999 to 2007 on the Loess Plateau of China
Figure 5. Agriculture production conditions for the Loess Plateau from 1985 to 2015. (a) agricultural machine power; (b) fertilization; (c) agricultural population; (d) pesticide use; (e) disaster area; (f) irrigated area
Regional food security prediction
Population predictions for the Loess Plateau indicate that, in 2030, the region’s total population will be 150.37 million, increasing by 16.86% over 16 years from 2015 to 2030 (the model’s precision is perfect: P > 0.95 and C < 0.35, level I; )). There is potential to increase the crop yield per unit area by improving agricultural resources, production conditions, and technical expertise. The GM (1, 1) model also predicted the grain yield per ha, where the crop yield per hectare increased by 2074 kg ha−1 from 2015 to 2030, an average annual growth of 3.0% ()). We designed several scenarios to analyze future ecological construction programs and grain yield per unit changes in regional food security (). First, if the “Grain for Green” program claims no more land and both the crop yield per hectare and total grain yield in 2030 will be identical to 2015, then the grain self-sufficiency will decrease to 81.73%. However, the grain self-sufficiency can reach the 2015 level if the per hectare crop yield increases to 5263.04 kg ha−1. Second, if we convert cropland on slopes of more than 25° to green vegetation by 2030, then there will be 53.53 × 10⁴ ha of grain-producing area conserved, resulting in a decrease in the grain yield of 231.51 × 10⁴ t compared with the grain yield in 2015. Grain self-sufficiency would decrease to a lower value of 77.88% if the crop yield per ha was identical to that in 2015. However, the grain self-sufficiency was 96.55% with improvements to the agricultural conditions, which increased the crop yield per unit area. Finally, continued terrace and check dam construction within the “Grain for Green” program will lead to 1180.46 × 104 ha of grain crop sown area in 2030, a 44.05 × 10⁴ ha increase over the area in 2015, and a grain self-sufficiency of 84.9%, with no improvements to the crop yield per hectare. However, the grain self-sufficiency will increase to 105.25% if the crop yield per hectare increases to 5363.04 kg ha–1, along with a total grain yield of 6330.87 × 104 t, increasing by 1414.7 × 104 t compared with 2015 levels.
Table 5. Food security prediction for 2030
Figure 6. The population prediction (a), and the grain yield per hectare prediction (b). Δ represents the mean absolute error, P represents the probability of error, C represents the post error ratio, and η represents the gray correlation degree. Accuracy was classified into four levels (perfect, well, acceptable and incapable) to determine the accuracy of the prediction models using P and C
Discussion
The effects of “green for grain” on food security
In recent years, there has been a debate over whether the “Grain for Green” program has threatened and/or is threatening Chinese food security. Several government managers and researchers have hypothesized that a main reason for the decrease in grain yield since 1999 was due to the large number of cultivated land set-asides (Ministry of Land and Resources Citation2004). They believe that the local food supply deficit was a result of a trade-off between too much grain for the establishment of green areas (Chen et al. Citation2015). Moreover, due to plans to expand the “Grain for Green” program, government officials predicted that the problem will become worse in the future. Others officials, however, argue that farmland vegetative restoration has had little, if any, effect on the local food supply (Feng et al. Citation2005). They implied that the direct effect on production is small. The set-aside lands had significantly lower yields than areas not characterized by land conversion. A survey found that wheat yields on “Grain for Green” plots were only 30% of those on non-program plots (Xu et al. Citation2006). Similarly, maize production on program plots had 50% yields compared with non-“Grain for Green” plots.
In this study, we observed that the grain crop sown area remained relatively static during the 1980s and 1990s. After 1999, the grain crop sown area continued to decline through 2002. By 2003, the grain crop sown area had reached its lowest recorded value, a 21.6% decrease compared with 1998. Also, the grain yield fell steeply from 1999 to 2001. Trends in the “Grain for Green” area paralleled those of the grain crop sown area and production. The grain crop sown area and grain yield began to fall in 1999, which was the same year that a large amount of sloped farmland was returned to green vegetation by the program. Given these trends, we can easily understand the general opinion of blaming the “Grain for Green” program for the decrease in grain crop sown area and grain yield. The results of our study show that “Grain for Green” had a considerable impact on regional food security in the initial years after its implementation. When the campaign was in full operation, a large amount of cultivated land was returned to green vegetation with an increase in the reduction of gain production from 1999 to 2003, resulting in a decreased grain self-sufficiency and increased levels of farmland stress. However, the grain yield level was characterized by an increasing trend from 2003 to 2015, resulting in increased self-sufficiency and decreased levels of farmland stress since 2004. Thus, we must consider multiple factors that influence the grain yield.
Integrated agricultural factors influencing grain yield
The significant positive correlation between grain yield and agricultural production conditions indicated that increasing the input of agricultural materials was important component in the enhancement of the region’s grain yield capabilities. Previous individual surveys and case studies suggested that “Grain for Green” officials encouraged the conversion of plots with lower yields (Xu et al. Citation2006). With the implementation of the program, much of the poor land was set aside, such that households increased the use of agricultural materials on the remaining fertile cropland. Fertilization, pesticide application, irrigated areas, and agricultural machinery power use were characterized by linear increases from the 1980s, with a further increase in the agricultural production input during the 2000s. The crop yield per hectare has rapidly increased since 2002, which may be related to the conversion of poor land and increases in agricultural material inputs to the remaining cropland. Natural disasters are important factors that influence the grain yield. Statistical data shows that meteorological disasters, such as drought and flood, occurred frequently from 1999 to 2001. Ignoring the disaster factor may exaggerate the effects that “Grain for Green” has on grain yield, especially in the initial program years.
Terraced fields and check dams increased by more than three-fold from 1999 to 2007 on the Loess Plateau, which explains a portion of the cropland shortage. Terracing and check dam fields are soil and water conservation strategies in mountainous regions worldwide (Chen, Wei, and Chen Citation2017; Gao et al. Citation2012). Terracing serves as a control on slope erosion and has significantly reshaped hill surface morphology, reducing on-site water runoff and soil loss (Wei et al. Citation2016). Terraced fields can improve soil nutrients and water retention, resulting in a higher grain output than sloped croplands (Amare et al. Citation2013). Check dams are widespread structures on the Loess Plateau that prevent sediment from flowing into the Yellow River (Zhao et al. Citation2017). Check dam construction in the gullies of the Loess Plateau can reduce sediment loss at a rate of ~3–5 million tons annually (Wang et al. Citation2011). When check dams are filled with sediment, the resulting silt lands can be used for cultivation. The dam fields are reclaimed as high-quality croplands due to soil-nutrient enrichment during the soil erosion–deposition process and enhanced water storage. Grain yield in man-made plain lands (about 1800 and 3500 kg ha−2 for terraces and check dam fields, respectively) is 4–8 times higher than that in the cropland on the slope (450 kg ha−2). Accordingly, the terraces and check dam fields account for ~7% of the total cropland in the Loess Plateau, whereas the grain yield is ~20% of the region’s total (Wang et al. Citation2011).
Agricultural management and suggestions
The “Grain for Green” program has had a certain effect on food security in the Loess Plateau. To increase the comprehensive grain yield capability, we must initiate reforms, optimize the farming system, stress scientific management practices, increase the use of agricultural resources, and continue the construction of terraces and check dams (He et al. Citation2017). Increasing grain yield efforts by concentrating on high yield and land-use efficiency is important. Therefore, increasing the grain yield requires a series of measures, such as increasing agricultural material inputs and improving both water conservation facilities and agricultural equipment standards. Moreover, we must establish an agricultural development strategy that involves the spread of the following important agricultural techniques: science-based fertilization, water-conserving irrigation, dry land farming, precise mechanical seeding, and integrated pest management. Soil conservation measures, such as terraces and check dams, can reduce soil erosion and increase the cropland area. Terraces have lower soil organic carbon and nitrogen contents than forests and grasslands, which is likely due to soil disturbances during construction and conventional tillage (Wang et al. Citation2010). To restore soil fertility to the terraced fields, we must consider certain necessary soil management practices, organic manure applications, and no-tillage areas. The use of manure on terraces resulted in a 3- to 4-fold greater maize yield compared with a control (Wickama, Okoba, and Sterk Citation2014). Compared with sloped lands, check dam fields have greater crop yields because of nutrient enrichment, which occurs when sediments are trapped behind check dams, and improved water availability (Wang et al. Citation2011). Large-scale terrace and check dam construction plays an important role in increasing grain yield and has facilitated the effective implementation of the vegetation restoration program on the Loess Plateau.
Trade-off between grain yield and other “green for grain” ecosystem services
The annual grain yield loss by the “Grain for Green” program increased from 40.28 × 10⁴ t in 1999 to 347.18 × 10⁴ t in 2010. However, ecosystem services improved after vegetation restoration. The Loess Plateau is the largest sediment source, contributing nearly 90% of the sediment load in the Yellow River (Xu et al. Citation2018). Large-scale vegetation restoration programs reduced soil erosion since the implementation of the “Green for Grain” program in 2000. Soil conservation services on the Loess Plateau increased from 9.32 × 10⁸ t in 1999 to 12.72 and 14.31 × 10⁸ t in 2005 and 2010, respectively (). The annual sediment load in the Yellow River decreased from 1.3 × 10⁹ t yr–1 from 1951–1979 to 0.32 × 10⁹ t yr–1 from 2000–2010 (Wang et al. Citation2016). The average vegetation coverage increased from 25% in 1978 to 46% in 2010 (Feng et al. Citation2016). Carbon sequestration has steadily increased since the initiation of the “Green for Grain” program (Shi et al. Citation2019c). The carbon stork has increased by 79.26 × 10⁴ t in the 10 years from 31,2288.54 × 104 t in 1999 to 31,2367.80 × 104 t in 2010. Water production in this region was 1.54, 1.69, and 1.78 × 10¹⁰ m3 in 1999, 2005, and 2010, respectively. After more than 10 years of ecological restoration, the Loess Plateau is now green. Improvements to ecosystem services in this region area are of great importance to the ecological sustainability of the Yellow River watershed.
Table 6. The ecosystem service changes from 1999 to 2010 on the Loess Plateau of China
Conclusions
The “Grain for Green” program implemented by the Chinese government has had a considerable impact on regional food security. The “Grain for Green” reclaimed area increased from 43.36 × 10⁴ ha to 326.99 × 10⁴ ha in the initial years of the program after its implementation. The loss in the grain yield from land set-asides increased from 40.28 × 10⁴ t in 1999 to 347.18 × 10⁴ t in 2010. Grain self-sufficiency decreased rapidly in the first several years of the program, reaching its lowest recorded value of 67.77% in 2001. Pressure on the cropland reached a peak of 1.49 in 1999, indicating a high food security risk due to the “Grain for Green” program. Thereafter, the grain yield increased, while grain self-sufficiency and cropland pressure showed increasing and decreasing trends, respectively.
Agricultural production conditions and other ecological construction programs, such as the construction of terraces and check dams, had significant effects on the regional grain supply. Agricultural production materials, including fertilizers, pesticides, agricultural machinery power, and irrigated areas, were characterized by linear increases after the initiation of the cropland set-aside program, which had positive correlations with the total grain yield and grain yield per unit. In many cases, even households that had a part of their land reclaimed actually increased their grain yield on the remaining sown land by increasing their agricultural material input to offset the loss of land. Terrace and check dam construction increased after sloped croplands experienced revegetation. The contribution of the terraces and check dam fields to the grain yield increased from 34.42 × 10⁴ t in 1999 to 168.89 × 10⁴ t in 2007.
The total population of the Loess Plateau is predicted to rise to 150.37 million by 2030, indicating a high level of pressure on the food supply. If government officials expand the “Grain for Green” program in the future, there will be 53.53 × 10⁴ ha of grain-producing area set aside, which will decrease the grain yield by 231.51 × 10⁴ t compared to with levels in 2015. Therefore, grain self-sufficiency would decrease to 77.88%. If we were to improve the agricultural conditions, resulting in an increased crop yield per unit area, then grain self-sufficiency should increase to 96.55%. In addition, grain self-sufficiency would increase to 105.25% by increasing terrace and check dam construction. Consequently, our results support the Chinese government’s plan to further expand the “Grain for Green” program. However, certain measures, such as increasing agricultural material input and upgrading agricultural science and technology, are necessary to increase the comprehensive grain yield capability. Moreover, terrace and check dam construction is required to relieve the Loess Plateau’s food crisis and maintain the efficiency of the revegetation program.
Highlights
Grain for Green had a considerable impact on food security on the Loess Plateau.
Agricultural production conditions had significant effects on the regional grain supply.
Terrace and check dam were required to relieve Loess Plateau’s food crisis.
Supplemental Material
Download MS Word (43.5 KB)Disclosure statement
No potential conflict of interest was reported by the authors.
Supplementary material
Supplemental data for this article can be accessed here.
Additional information
Funding
Related Research Data
References
- Amare, T., A. Terefe, Y. G. Selassie, B. Yitaferu, B. Wolfgramm, and H. Hurni. 2013. “Soil Properties and Crop Yields along the Terraces and Toposequece of Anjeni Watershed, Central Highlands of Ethiopia.” Journal of Agricultural Science 5: 134. doi:10.5539/jas.v5n2p134.
- Cao, Z., Y. Li, Y. Liu, Y. Chen, and Y. Wang. 2018. “When and Where Did the Loess Plateau Turn “Green”? Analysis of the Tendency and Breakpoints of the Normalized Difference Vegetation Index.” Land Degradation & Development 29: 1–13. doi:10.1002/ldr.2852.
- Chen, C., Huang. 2013. “The Necessary and Sufficient Condition for GM(1, 1) Grey Prediction Model.” Applied Mathematics and Computation 219: 6152–6162. doi:10.1016/j.amc.2012.12.015.
- Chen, D., W. Wei, and L. Chen. 2017. “Effects of Terracing Practices on Water Erosion Control in China: A Meta-analysis.” Earth-Science Reviews 173: 109–121. doi:10.1016/j.earscirev.2017.08.007.
- Chen, Y., K. Wang, Y. Lin, W. Shi, Y. Song, and X. He. 2015. “Balancing Green and Grain Trade.” Nature Geoscience 8: 739–741. doi:10.1038/ngeo2544.
- Feng, Q., W. Zhao, B. Fu, J. Ding, and S. Wang. 2017. “Ecosystem Service Trade-offs and Their Influencing Factors: A Case Study in the Loess Plateau of China.” Science of the Total Environment 607–608: 1250–1263. doi:10.1016/j.scitotenv.2017.07.079.
- Feng, X., B. Fu, S. Piao, S. Wang, P. Ciais, Z. Zeng, and B. Wu. 2016. “Revegetation in China’s Loess Plateau Is Approaching Sustainable Water Resource Limits.” Nature Climate Change 6: 1019–1022. doi:10.1038/nclimate3092.
- Feng, Z., Y. Yang, Y. Zhang, P. Zhang, and Y. Li. 2005. “Grain-for-green Policy and Its Impacts on Grain Supply in West China.” Land Use Policy 22: 301–312. doi:10.1016/j.landusepol.2004.05.004.
- Food and Agriculture Organization of the United Nations. 2009. “How to Feed the World in 2050.” http://www.fao.org
- Fu, B., S. Wang, Y. Liu, J. Liu, W. Liang, and C. Miao. 2017. “Hydrogeomorphic Ecosystem Responses to Natural and Anthropogenic Changes in the Loess Plateau of China.” Annual Review of Earth and Planetary Sciences 45: 223–243. doi:10.1146/annurev-earth-063016-020552.
- Gao, H., Z. Li, P. Li, L. Jia, and X. Zhang. 2012. “Quantitative Study on Influences of Terraced Field Construction and Check-dam Siltation on Soil Erosion.” Journal of Geographical Sciences 22: 946–960. doi:10.1007/s11442-012-0975-5.
- Gao, H., Z. Li, P. Li, Z. Ren, and L. Jia. 2016. Soil Erosion and Soil and Water Conservation on the Loess Plateau at Multi-scale. Beijing: Science Press.
- Gao, Q. 2001. “Soil Erosion and Management on the Loess Plateau.” Journal of Geographical Sciences 11: 53–70. doi:10.1007/BF02837376.
- Gong, P. 2011. “China Needs No Foreign Help to Feed Itself.” Nature 474: 7. doi:10.1038/474007a.
- Hamzacebi, C., and H. A. Es. 2014. “Forecasting the Annual Electricity Consumption of Turkey Using an Optimized Grey Model.” Energy 70: 165–171. doi:10.1016/j.energy.2014.03.105.
- He, C., Z. Liu, M. Xu, Q. Ma, and Y. Dou. 2017. “Urban Expansion Brought Stress to Food Security in China: Evidence from Decreased Cropland Net Primary Productivity.” Science of the Total Environment 576: 660–670. doi:10.1016/j.scitotenv.2016.10.107.
- Information Office of the State Council of the People’s Republic of China. 1996. “The Grain Issue in China.” http://www.people.com.cn
- Jia, X., B. Fu, X. Feng, G. Hou, Y. Liu, and X. Wang. 2014. “The Tradeoff and Synergy between Ecosystem Services in the Grain-for-Green Areas in Northern Shaanxi, China.” Ecological Indicators 43: 103–113. doi:10.1016/j.ecolind.2014.02.028.
- Kang, S., X. Hao, T. Du, L. Tong, X. Su, H. Lu, and R. Ding. 2017. “Improving Agricultural Water Productivity to Ensure Food Security in China under Changing Environment: From Research to Practice.” Agricultural Water Management 179: 5–17. doi:10.1016/j.agwat.2016.05.007.
- Khoury, C. K., A. D. Bjorkman, H. Dempewolf, J. Ramirez-Villegas, L. Guarino, A. Jarvis, and P. C. Struik. 2014. “Increasing Homogeneity in Global Food Supplies and the Implications for Food Security.” Proceedings of the National Academy of Sciences of the United States of America 111: 4001–4006. doi: 10.1073/pnas.1313490111.
- Li, H., J. He, Z. P. Bharucha, R. Lal, and J. Pretty. 2016a. “Improving China’s Food and Environmental Security with Conservation Agriculture.” International Journal of Agricultural Sustainability 14: 377–391. doi:10.1080/14735903.2016.1170330.
- Li, P., G. Xu, K. Lu, X. Zhang, P. Shi, L. Bai, Z. Ren, G. Pang, H. Gao, and M. Pan. 2019. “Runoff Change and Sediment Source during Rainstorms in an Ecologically Constructed Watershed on the Loess Plateau, China.” Science of the Total Environment 664: 968–974. doi:10.1016/j.scitotenv.2019.01.378.
- Li, S., W. Liang, B. Fu, Y. Lü, S. Fu, S. Wang, and H. Su. 2016b. “Vegetation Changes in Recent Large-scale Ecological Restoration Projects and Subsequent Impact on Water Resources in China’s Loess Plateau.” Science of the Total Environment 569: 1032–1039. doi:10.1016/j.scitotenv.2016.06.141.
- Lu, Q., B. Xu, F. Liang, Z. Gao, and J. Ning. 2013. “Influences of the Grain-for-Green Project on Grain Security in Southern China.” Ecological Indicators 34: 616–622. doi:10.1016/j.ecolind.2013.06.026.
- Lü, Y., B. Fu, X. Feng, Y. Zeng, Y. Liu, R. Chang, and B. Wu. 2012. “A Policy-driven Large Scale Ecological Restoration: Quantifying Ecosystem Services Changes in the Loess Plateau of China.” PLoS ONE 7: e31782. doi:10.1371/journal.pone.0031782.
- Ministry of Land and Resources. 2004. “China National Report on Land and Resources (2003).” Available online at http://www.mlr.gov.cn
- Shi, P., Y. Qin, T. Zhu, Z. Li, P. Li, Z. Ren, Y. Liu, and F. Wang. 2019c. “Soil Respiration and Response of Carbon Source Changes to Vegetation Restoration in the Loess Plateau, China.” Science of the Total Environment. doi:10.1016/j.scitotenv.2019.135507.
- Shi, P., Y. Zhang, Z. Ren, Y. Yu, P. Li, and J. Gong. 2019a. “Land-use Changes and Check Dams Reducing Runoff and Sediment Yield on the Loess Plateau of China.” Science of the Total Environment 664: 984–994. doi:10.1016/j.scitotenv.2019.01.430.
- Shi, P., Y. Zhang, Y. Zhang, Y. Yu, P. Li, Z. Li, L. Xiao, G. Xu, and T. Zhu. 2019b. “Land-use Types and Slope Topography Affect the Soil Labile Carbon Fractions in the Loess Hilly-gully Area of Shaanxi, China.” Archives of Agronomy and Soil Science 1–13. doi:10.1080/03650340.2019.1630824.
- The State Council of the People’s Republic of China. 2016. “Chinese Population Development Program from 2016 to 2030.” Available online at http://www.gov.cn
- Wang, S., B. Fu, S. Piao, Y. Lü, P. Ciais, X. Feng, and Y. Wang. 2016. “Reduced Sediment Transport in the Yellow River Due to Anthropogenic Changes.” Nature Geoscience 9: 38–41. doi:10.1038/ngeo2602.
- Wang, Y., B. Fu, L. Chen, Y. Lü, and Y. Gao. 2011. “Check Dam in the Loess Plateau of China: Engineering for Environmental Services and Food Security.” Environmental Science & Technology 45: 10298–10299. doi:10.1021/es2038992.
- Wang, Y., B. Fu, Y. Lü, C. Song, and Y. Luan. 2010. “Local-scale Spatial Variability of Soil Organic Carbon and Its Stock in the Hilly Area of the Loess Plateau, China.” Quaternary Research 73: 70–76. doi:10.1016/j.yqres.2008.11.006.
- Wei, W., D. Chen, L. Wang, S. Daryanto, L. Chen, Y. Yu, and T. Feng. 2016. “Global Synthesis of the Classifications, Distributions, Benefits and Issues of Terracing.” Earth-Science Reviews 159: 388–403. doi:10.1016/j.earscirev.2016.06.010.
- West, P. C., J. S. Gerber, P. M. Engstrom, N. D. Mueller, K. A. Brauman, K. M. Carlson, and S. Siebert. 2014. “Leverage Points for Improving Global Food Security and the Environment.” Science 345: 325–328. doi:10.1126/science.1246067.
- Wheeler, T., and J. von Braun. 2013. “Climate Change Impacts on Global Food Security.” Science 341: 508–513. doi:10.1126/science.1239402.
- Wickama, J., B. Okoba, and G. Sterk. 2014. “Effectiveness of Sustainable Land Management Measures in West Usambara Highlands, Tanzania.” Catena 118: 91–102. doi:10.1016/j.catena.2014.01.013.
- Xu, G., S. Cheng, P. Li, Z. Li, H. Gao, K. Yu, and B. Zhao. 2018. “Soil Total Nitrogen Sources on Dammed Farmland under the Condition of Ecological Construction in a Small Watershed on the Loess Plateau, China.” Ecological Engineering 121: 19–25. doi:10.1016/j.ecoleng.2017.09.005.
- Xu, Z., J. Xu, X. Deng, J. Huang, E. Uchida, and S. Rozelle. 2006. “Grain for Green versus Grain: Conflict between Food Security and Conservation Set-aside in China.” World Development 34: 130–148. doi:10.1016/j.worlddev.2005.08.002.
- Yang, S., W. Zhao, Y. Liu, S. Wang, J. Wang, and R. Zhai. 2018. “Influence of Land Use Change on the Ecosystem Service Trade-offs in the Ecological Restoration Area: Dynamics and Scenarios in the Yanhe Watershed, China.” Science of the Total Environment 644: 556–566. doi:10.1016/j.scitotenv.2018.06.348.
- Ye, Y., X. Wei, X. Fang, and Y. Li. 2017. “Social Vulnerability Assessment by Mapping Population Density and Pressure on Cropland in Shandong Province in China during the 17th–20th Century.” Sustainability 9: 1171. doi:10.3390/su9071171.
- Zhao, G., X. Mu, Z. Wen, F. Wang, and P. Gao. 2013. “Soil Erosion, Conservation, and Eco‐environment Changes in the Loess Plateau of China.” Land Degradation & Development 24: 499–510. doi:10.1002/ldr.2246.
- Zhao, T. Y., M. Y. Yang, D. E. Walling, F. B. Zhang, and J. Q. Zhang. 2017. “Using Check Dam Deposits to Investigate Recent Changes in Sediment Yield in the Loess Plateau, China.” Global & Planetary Change 152: 88–98. doi:10.1016/j.gloplacha.2017.03.003.
- Zhu, X. M., Y. S. Li, X. L. Peng, and S. G. Zhang. 1983. “Soils of the Loess Region in China.” Geoderma 29: 237–255. doi:10.1016/0016-7061(83)90090-3.