
 ?Mathematical formulae have been encoded as MathML and are displayed in this HTML version using MathJax in order to improve their display. Uncheck the box to turn MathJax off. This feature requires Javascript. Click on a formula to zoom.
ABSTRACT
The coastal area of China has faced major strategic planning and environmental pollution, including heavy metals pollution. This study aimed to provide a comprehensive evaluation of the effects of Cd pollution on the ecology in coastal areas of China. A soil Cd pollution database of 300 counties or districts in coastal areas was screened from academic dissertations and academic journal papers. Based on the database, the ecological risk was evaluated using entropy methods and probabilistic ecological risk assessment (PERA), and the advantages and disadvantages of these methods were analyzed. In China’s coastal areas, the soil Cd content in 10.33% of the counties was higher than the minimum of risk control value (1.5 mg/kg), and in 4.00% of the counties was higher than the maximum of risk control value (4.0 mg/kg). The ecological risks were highly compatible with national strategic planning areas. Guangxi Province, Zhejiang Province, and Guangdong Province ranked among the top three coastal areas for soil Cd contamination, and the ecological risks were 18.80%, 17.89%, and 15.77% at the maximum no-effect concentration/lowest effect concentration (NOEC/LOEC) level. This study can provide insights to policymakers regarding the protection of ecosystems threatened by heavy metals in the process of regional strategic planning.
Introduction
In the past few decades, combined with the rapid economic development in China, environmental quality has faced significant challenges. Heavy metals, which are a typical type of pollutant, have attracted widespread attention (Marrugo-Negrete, Pinedo-Hernandez, and Diez Citation2017; Yang et al. Citation2018). Heavy metal contamination and accumulation in soil are a serious problem worldwide owing to the toxicity, abundant sources, non-biodegradable properties, and accumulative behaviors of these metals (Hu et al. Citation2017). Heavy metals originate from natural sources and anthropogenic activities. The main anthropogenic activities include mineral resources exploration, metal smelting and processing, factory emissions, fertilizer and pesticide input, and sewage irrigation (Chen et al., Citation2014; Ma et al. Citation2016; Reboredo et al. Citation2019). Coastal areas, which are rapidly developing economic zones in China, have been intensively disturbed by human activities, thereby resulting in severe heavy metals pollution. The most widely studied metals include Pb, Cd, Cr, Hg, and As (Shi et al. Citation2018). However, the contamination levels of Cd and As are higher than those of the other metals (Wei and Yang Citation2010), and Cd pollution is the most serious soil pollution in farmland in China (Chen et al. Citation2016). Therefore, Cd pollution is of greatest concern to the government and the public in China, and a pilot project has been launched to remediate cropland contaminated by Cd in Hunan Province (PGHU Citation2014-2016; Xu et al. Citation2019). Heavy metals pollution in coastal areas is a global problem, and it affects countries such as Vietnam, Turkey, and America (Baltas et al. Citation2017; Costa-Boeddeker et al. Citation2017; Polidoro et al. Citation2017).
Many previous studies tended to reveal the heavy metals pollution conditions and evaluate their ecological risks in selected study areas, especially in coastal areas since they threaten the security of terrestrial and marine ecosystems (Harikrishnan et al. Citation2017). The heavy metals pollution in the Beijing-Tianjin-Hebei region, Yangtze River Delta region, and Pearl River Delta region, which are the three regions at the forefront of China’s economic development, has received extensive attention from researchers (Yang et al. Citation2018). Shi et al. (Citation2018) distinguished the spatial distribution of the ecological risks from multiple heavy metals within the region around the Bohai Sea and the Yellow Sea. Some studies have focused on the Yangtze River Delta region and the Pearl River Delta region in China (Li et al., Citation2015a; Gao and Wang Citation2018; Lu and Wang Citation2018), as well as agricultural areas in Guangxi Province (Liu et al. Citation2018). According to the national communique of soil pollution survey, the heavy metals concentration in sampling sites exceeded the standard (Grade II environmental quality standard for soils in China (GB15618-1995)) by an average of 16.1%, which showed that the soil in cultivated land has been heavily contaminated in some regions (MEP of China Citation2014). The overall macro-evaluation of soil heavy metals pollution at the national scale has been conducted in a previous study (Yang et al. Citation2018). However, the overall macro-evaluation focused on health risks, but ecological risks were omitted. With the development of national strategies in the Xiong’an New Area (XANA) and Guangdong-Hong Kong-Macao Greater Bay Area, the importance of coastal areas in China is increasing and many large regional plans are being drawn up or implemented (Xiao and Zhao Citation2017; Hui et al. Citation2018). An overall macro-evaluation of ecological risks in coastal areas is urgently needed, which will facilitate the systematic transformation of cities and regions to fulfill sustainable development goals (Lu, Cao, and Wang. Citation2019a; Lu et al. Citation2019b).
The ecological risk assessment (ERA) is an effective tool to evaluate the impact of chemical contaminants on ecosystems (Shi et al. Citation2018). The selection of an ERA method is the key to evaluation. According to the evolution of ERA methods, three methods, namely the hazard quotient (HQ), species sensitivity distribution (SSD), and probabilistic ecological risk assessment (PERA), are commonly used. The HQ method, which mainly consists of the single factor index, Hakanson potential ecological risk index, and Nemerow integrated pollution index, is the most widely used method for evaluating ecological risk (Ke et al. Citation2017; Wu et al. Citation2018). The use of the SSD method has increased in scientific and administrative activities since the 1990 s. Although the SSD method has been used in some studies, compared with the HQ method, the large and precise toxicity data demands in the SSD model hinder the more intensive promotion of the method (Del Signore et al. Citation2016; Zhang et al. Citation2017; Gao et al. Citation2019). The HQ and SSD methods belong to the group of entropy methods. PERA, which consists of the SSD model and joint probability curve (JPC), is more frequently used to quantitatively evaluate the ecological risk of pollutants (Xu et al. Citation2015; Shi et al. Citation2016; Zeng et al. Citation2016). The advantages and disadvantages of different methods have been briefly discussed in previous studies, but only qualitative, non-comprehensive descriptions have been provided (Yang et al. Citation2007; Xu et al. Citation2019). A quantitative comparative analysis of these methods is urgently needed. In particular, the identification of the most suitable method for evaluating ecological risk for policymaking in coastal areas of China was one of the main purposes of this study.
This study intended to assess the soil Cd pollution levels and ecological risks in coastal regions in China on a macro-regional scale. The study area included all the mainland coastal provinces and municipalities directly controlled by the central government. The concentration of Cd exposure in soil was screened from peer-reviewed papers and dissertations published from 2013 to 2018. The objectives of this study were as follows. First, it aimed to evaluate the pollution level and ecological risk of Cd in China’s coastal economic development zone; second, it attempted to comparatively analyze the advantages and disadvantages of different ERA methods using a qualitative approach; and finally, it aimed to identify the hot spots and geographical features of pollution and ecological risks in order to provide references from an environmental perspective for regional development planning in China.
Data sources and research methods
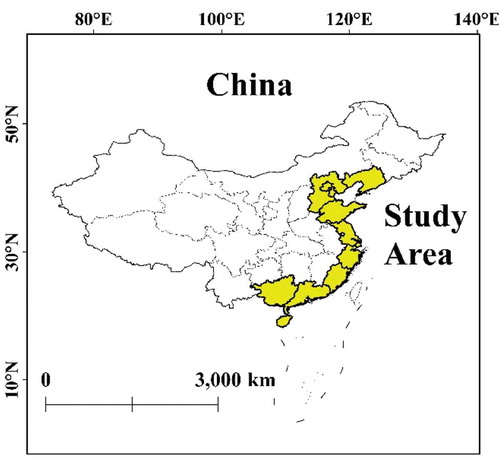
Study area
Coastal administrative areas of China consist of 11 provinces (or municipalities directly controlled by the central government). Because Beijing surrounded by Hebei Province is the capital city of China and the core of the Beijing-Tianjin-Hebei region, it was necessary to include Beijing in the study area. In this study, the coastal areas of China exceed the limits of the coastal administrative areas, including 11 coastal provinces (municipalities) and Beijing. As shown in , a total of 12 provincial-level regions were selected as research areas along the coast of China. The study area covered the Beijing-Tianjin-Hebei region, Yangtze River Delta region, Pearl River Delta region, and Guangdong-Hong Kong-Macao Greater Bay Area, which are fast-growing areas of the Chinese economy and have a high degree of urbanization. However, while their economy is developed, these regions also face significant environmental challenges, including heavy metals contamination in soil.
Figure 1. The location of the study area
Data collection
Cd was the priority heavy metal in this study. The time span of the dataset was from 2013 to 2018. The data were screened from academic dissertations and academic journals from the Web of Science (WOS) and China National Knowledge Infrastructure (CNKI) databases. From the WOS database, 229 literatures were screened using the keywords “heavy metal,” “soil” and “China.” In addition, 521 literatures were screened using the keywords “heavy metal” and “soil” from the CNKI database. Further, 77 literatures from the WOS database and 420 literatures from the CNKI database that focused on coastal provinces of China were manually screened. Finally, a total of 291 literatures using standard soil Cd concentration measurement procedures were screened. A total of 102,275 soil Cd samples from the different sites were documented in the 291 screened studies. After aggregation, the 1448 average heavy metal exposure values were calculated for 300 districts or counties distributed in the coastal economic development zone of China. The soil Cd concentration of each district or county was calculated as the mean value of the soil Cd concentration from different sample sites within the district or county. All the original literatures that were applied to extract environmental data for the coastal economic development zone of China are shown in Table S1.
Methodology for ecological risk assessment
Hazard quotient method
The single factor pollution index and potential ecological hazard index were calculated to represent the ecological risk of soil Cd pollution using the HQ method.
The single factor pollution index is widely used for evaluating the ecological risk of single pollutants. It is calculated as the following computational formula:
where is the environmental quality index of pollutant i in the soil,
is the concentration of pollutant i in the soil (mg/kg), and
is the evaluation standard of pollutant i (mg/kg). The classification standard of the environmental quality index is as follows:
≤ l: non-contamination; 1 <
≤ 2: slight contamination; 2 <
≤ 3: medium contamination;
> 3: heavy contamination.
The potential ecological hazard index, which was developed by Hakanson (Citation1980), is a method for evaluating the heavy metals contamination in soil or sediments from the perspective of sedimentology; it is based on the characteristics of heavy metals and their environmental behaviors (Hakanson Citation1980). The formula is as follows:
where is the potential ecological risk index of a single heavy metal,
is the toxicity response parameter for a single heavy metal,
is the pollution index of heavy metal i,
is the concentration of pollutant i in the soil (mg/kg), and
is the reference value of heavy metal i where the background value of the heavy metal in soil is generally used as the reference value (Table S2). The specific classification criteria of
for a single pollutant are shown in .
Table 1. Classification criteria of the potential ecological risk index
Regarding the setting of the toxicity response parameters, the toxicity response coefficient of heavy metals was set by referring to the calculation results of Hakanson (Citation1980), and the corresponding toxicity coefficient of Cd was 30.
Species sensitivity distribution method
In general, the SSD for a chemical can be derived by the following steps: (1) toxicity data collection, (2) data processing, (3) curve fitting, and (4) calculation of the 5% hazard concentration (HC5). The risk quotient can be identified according to the following steps: (1) exposure assessment, (2) calculation of the predicted no-effect concentration (PNEC), and (3) calculation of the risk quotient (Wang et al. Citation2017; Shi et al. Citation2018; Xu et al. Citation2019).
Toxicity data on the toxic responses of native species in China to Cd were screened from the USEPA ECO-TOX database, WOS database, and CNKI database. The data were screened for two levels of standards, including the first level for the half lethal effect concentration (LC50), half-maximal effective concentration (EC50), and median inhibitory concentration (IC50), and the second level for the maximum no-effect concentration (NOEC) and lowest effect concentration (LOEC). The rules for the processing of toxicity data were consistent with the methods described in previous studies (Shi et al. Citation2016, Citation2018; Xu et al. Citation2019). In total, 20 effective LC/EC/IC50 toxicity data and 16 NOEC/LOEC toxicity data on toxic effect for Cd were collected for native species in China. In this study, ETX 2.0 software was used to construct the SSD model and calculate the HC5, which means that all species affected by the toxic effects of Cd do not exceed the threshold of the acute/chronic concentration of Cd with 5% of the total number of species affected. In this study, HC5 at the NOEC/LOEC level was used as the PNEC value, which had high credibility (Wang et al. Citation2015).
The quotient method was deployed to calculate the ecological risk of Cd in the SSD method. The standard value was replaced by the PNEC in the single factor index formula to calculate the risk value of Cd (Hu et al. Citation2012), which could be expressed according to the following formula:
where QR is the ecological risk, Ci is the pollutant exposure concentration, and CPNE is the PNEC. Generally, HC5 at the NOEC/LOEC level was used as the PNEC value. In order to evaluate the ecological risk more scientifically, the ecological risk at the LC/EC/IC50 level was also evaluated. The HC5 at the LC/EC/IC50 level was used as the dividend instead of the CPNE in formula (4). When QR < 0.1, it means that Cd poses a low risk to the environment (low risk). When 0.1 < QR < 1.0, it means that Cd poses a certain risk to the environment (medium risk) and the associated risk sources need to be tracked. When QR > 1.0, it indicates that the chemicals pose a serious risk (high risk) to the environment and corresponding risk reduction measures need to be taken.
Probabilistic ecological risk assessment
PERA consists of the SSD and JPC. The SSD curve was consistent with that in Section 2.3.2 and the HC5 was also needed for evaluation. The main difference between this method and the abovementioned method is the method of risk characterization. PERA can represent the quantitative relationship between the concentration of Cd and the proportion of affected species, which has been applied frequently in previous studies (Shi et al. Citation2018; Xu et al. Citation2019). The risk probability is presented as the integral area of the region of the JPC curve and the horizontal and vertical axes, namely the expected total risk.
Data analysis
All the statistics were processed by Microsoft Office 2016, and parts of the figures were created using ArcGIS 10.0. ETX 2.0 software was used to simulate the results of the SSD and PERA (RIVM, 2001).
Results and discussion
Distribution characteristics of soil Cd in coastal areas of China
Spatial distribution of Cd
The distribution of Cd in the surface soil of coastal areas in China is illustrated in . The classification was based on the environmental quality standard for soils (GB15618-2018). The standard value depends on the soil pH level. The minimum and maximum of risk screening values are 0.3 and 0.8 mg/kg at different pH levels, while the minimum and maximum of risk control values are 1.5 and 4 mg/kg at different pH levels, respectively. The concentrations of Cd in the study area ranged from 0.01 mg/kg to 90.30 mg/kg (average concentration of 1.21 mg/kg), and the maximum value of 90.30 mg/kg was found in Zhuji County, Zhejiang Province. In China’s coastal areas, the soil Cd content in 61.33% of the counties was lower than the minimum of risk screening value (0.3 mg/kg), and in 10.33% of the counties was higher than the minimum of risk control value (1.5 mg/kg), that in 4.00% of the counties was higher than the maximum of risk control value (4.0 mg/kg). Compared with other provinces, the Cd content in the Yangtze River Delta area was relatively high, especially in the northern part of Zhejiang Province. In addition, the northwest region of Guangxi Province and the northern region of Guangdong Province and the Pearl River Delta area also had high Cd concentrations. Meanwhile, in Hainan Province, the concentration of Cd was evenly distributed, most of which was lower than the maximum of risk screening value (0.8 mg/kg).
Figure 2. Spatial distribution of the Cd concentration in the soil in China’s coastal areas
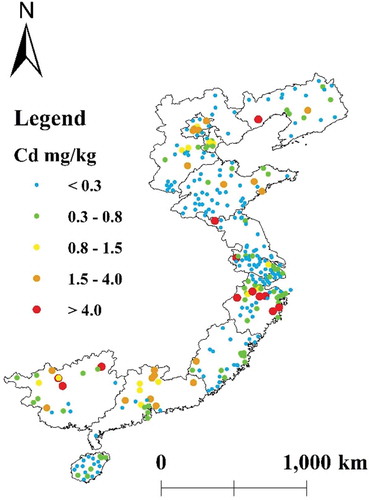
Statistical analysis of Cd concentrations in different provinces along coastal areas in China is shown in . The highest arithmetic mean concentration of soil Cd appeared in Zhejiang province and the lowest in Hainan province. The top three provinces with the highest levels of soil Cd contamination were Zhejiang > Guangxi > Guangdong. The variable coefficient of each province was between 0.64 and 4.79, which indicated that the soil Cd content in different counties and districts in each province was significantly different.
Table 2. Statistical analysis of Cd concentration in coastal economic development zone of China
Characteristics of Cd contamination distribution
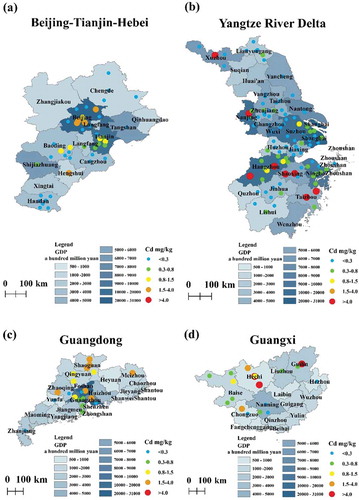
Fertilization, atmospheric deposition, industrial emissions, and soil parent materials are the major sources of heavy metals in soil (Luo et al. Citation2015; Ke et al. Citation2017). The geological background values of heavy metals in soil parent material determine the concentration of heavy metals in soil to some extent. However, it was demonstrated that anthropogenic activities had a significantly greater contribution than that of natural sources for heavy metals pollution in surface soil (Hu et al. Citation2018). A previous study showed that heavy metals pollution and its associated risks in southeast China were more severe than those in northwest China (Yang et al. Citation2018). In addition, most developed and populous areas have been subjected to heavy metals pollution (Duan et al. Citation2016). The results showed the soil Cd content in the Beijing-Tianjin-Hebei region, Yangtze River Delta region, Pearl River Delta region, and Guangxi province was much higher than other regions. Considering the heavy metals contamination caused by economic development, some studies revealed that developed cities and industrializing cities have higher contamination levels of heavy metals, such as the Beijing-Tianjin-Hebei region and Yangtze River Delta (Wei and Yang Citation2010), which is consistent with our analysis. However, the results of correlation analysis showed that the relationship between Cd concentration and the economic development at city level represented by GDP was not significant (p >0.05).
As illustrated in , the soil Cd content in the Beijing-Tianjin-Hebei region was 0.67 mg/kg, but distributed unevenly, and formed a triangular spatial distribution pattern. The Yangtze River Delta region is one of the three regions at the forefront of China’s economic development. The Yangtze River Delta region has Shanghai at its core and Nanjing and Hangzhou at its sides. The soil Cd arithmetic mean content was 1.75 mg/kg in the Yangtze River Delta region. It can be clearly seen from that the soil Cd concentration in Shanghai, Nanjing, and Hangzhou was relatively high. Similar findings have been reported in previous studies (Mao et al. Citation2017; Wang et al. Citation2018; Chen et al. Citation2019). In addition, the soil Cd concentrations in Shaoxing and Xuzhou, which have rich mineral resources and intensive mining industries, were also high. As a power-based city in East China, Xuzhou has abundant coal resources, which may be one of the reasons for the high Cd content in the soil (Fang, Dong, and An Citation2019). Similarly, Shaoxing also has a large number of metal mining areas, thereby resulting in the accumulation of Cd in the soil.
In addition, the Pearl River Delta is another region at the forefront of China’s economic development. In particular, the Guangdong-Hong Kong-Macao Greater Bay Area has become a new national strategic development area. Guangdong Province had a serious soil heavy metals pollution problem (1.11 mg/kg) (), which may have been caused by the development of the electronics industry and metal mines, such as the Meizhou Pb-Zn mine (Chen et al. Citation2016). The development strategy and construction planning of the Guangdong-Hong Kong-Macao Greater Bay Area should follow the principles of rational planning and prevention, realizing cleaner production, and high-standard industry development. Guangxi Province also showed high Cd contamination (1.59 mg/kg), shown in (d). Similarly, the heavy metals contamination in farmland soil in southeastern provinces in China was relatively high, especially in Guangxi Province (Chen et al. Citation2016). According to the data sources screened in this study, the high Cd pollution in Guangxi Province mainly occurred around mining areas, such as near Hechi and Guilin. The exploitation of mineral resources will inevitably lead to heavy metals contamination in soil.
Figure 3. Distribution of Cd in the soil of key areas
Ecological risk assessment of soil Cd in coastal areas of China
Ecological risk assessment of Cd using the hazard quotient method
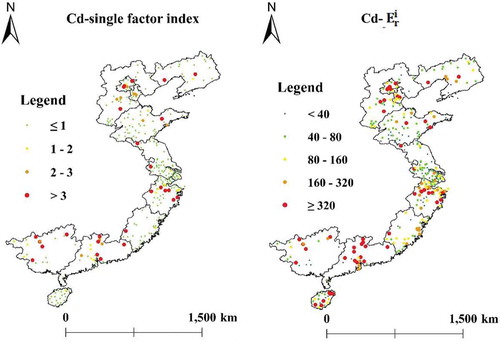
The ecological risk evaluation results of the single factor index and Hakanson potential ecological risk are shown in . Both ecological risk evaluation methods showed that the risks of Cd in the Beijing-Tianjin-Hebei economic circle, Yangtze River Delta, Guangxi Province, and Guangdong Province were relatively high. The maximum risk values of the single factor index and Hakanson potential ecological risk were 150.5 and 38 700.0, respectively, which were both located in Zhuji, Zhejiang Province.
Figure 4. The ecological risk of Cd pollution under the methods of the single factor index and potential ecological risk index ()
Ecological risk assessment of Cd using the species sensitivity distribution method
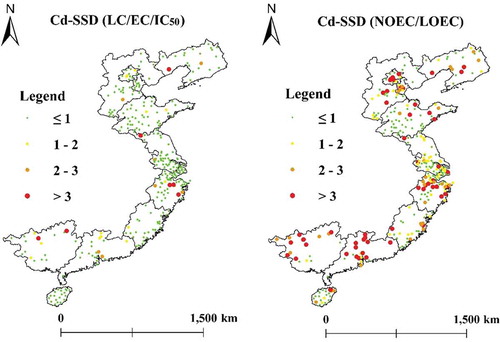
ETX 2.0 software was used to calculate the fitting results of the SSD model at two toxicity levels. Based on the fitting results, the PNEC value of the toxicity of Cd species in soil was evaluated. The results showed that the estimated median HC5 value was 1.15 mg/kg at the LC/EC/IC50 level, and the confidence interval was 0.24–3.33 mg/kg. The estimated PNEC median value was 0.21 mg/kg at the NOEC/LOEC level, and the confidence interval was 0.03–0.70 mg/kg. The ERA results of Cd at the levels of LC/EC/IC50 and NOEC/LOEC are shown in . In general, the ecological risk of Cd in coastal areas was relatively low at the LC/EC/IC50 level but was high at the NOEC/LOEC level.
Figure 5. Distribution of ecological risk under the species sensitivity distribution (SSD) method
The probabilistic ecological risk assessment results of soil Cd
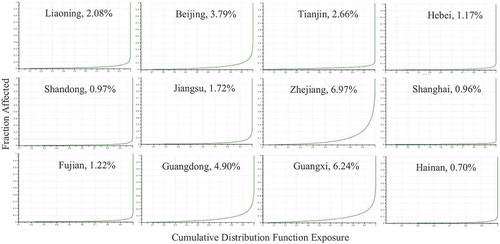
According to the fitting results of the SSD model and the exposure concentration of Cd in the soil of the study area, the results of PERA at the LC/EC/IC50 level were calculated, which are illustrated in . The risk probability values of Cd in China’s coastal provinces were ranked in the order of Zhejiang > Guangxi > Guangdong > Beijing > Tianjin > Liaoning > Jiangsu > Fujian > Hebei > Shandong > Shanghai > Hainan. Zhejiang Province and Guangxi Province had a higher risk of Cd with a probability of 6.97% and 6.24%, respectively, which meant that there was a probability of 6.97% and 6.24% for 5% of species to be affected by the toxic effect at the LC/EC/IC50 level, respectively.
Figure 6. Probabilistic ecological risk at the LC/EC/IC50 level
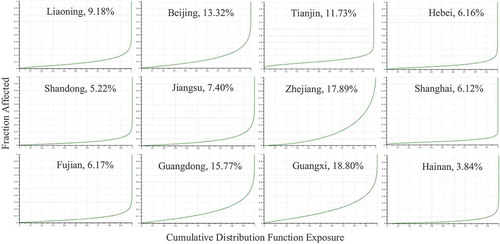
The results of PERA at the NOEC/LOEC level are shown in . The risk probability values of Cd in China’s coastal provinces were ranked in the order of Guangxi > Zhejiang > Guangdong > Beijing > Tianjin > Liaoning > Jiangsu > Fujian > Hebei > Shandong > Shanghai > Hainan. The ecological risk had different orders between the two evaluation levels. Guangxi Province and Zhejiang Province had higher risks of Cd with a probability of 18.80% and 17.89%, respectively, which meant that there was a probability of 18.80% and 17.89% that 5% of species would be affected by the toxic effect at the NOEC/LOEC level, respectively.
Figure 7. Probabilistic ecological risk at the NOEC/LOEC level
Meanwhile, and show that Beijing and Tianjin were in the top five in terms of ecological risk probability at the LC/EC/IC50 level and NOEC/LOEC level. Beijing has historically had heavy industry, such as the Capital Iron and Steel Company, and the development of heavy industry might have led to the accumulation of Cd in the soil. Some articles have shown that Cd pollution in the surface soil of Beijing is a very serious issue (Chen et al. Citation2010; Xia et al. Citation2011). The results also showed that Baoding in Hebei Province and Tianjin had a higher Cd ecological risk. Baoding and Tianjin are industry-oriented cities, which might have led to the enrichment of Cd in the soil and the persistent trend of intensification (Xue et al. Citation2012; Han et al. Citation2018). The Xiongan New Area (XANA) was in the center of the triangle. From the perspective of the integrated analysis in this study, it was revealed that the construction of the XANA faced higher ecological risk, which was verified by many studies (Zhang et al. Citation2018; Xue et al. Citation2019). It also showed that Zhejiang Province had very high ecological risk probabilities at both the LC/EC/IC50 and NOEC/LOEC levels, as it ranked within the top two, while the Pearl River Basin had higher Cd-induced ecological risk than other areas. Similar results at the Pearl River Basin were also found by previous studies (Li et al., Citation2015b; Zhang et al. Citation2015). As shown in and , Guangxi Province and Guangdong Province had high ecological risk probabilities at the LC/EC/IC50 and NOEC/LOEC levels, as they ranked within the top three.
Comparison analysis of ecological risk assessment results
Taking Hainan Province as an example, compared with the single factor index, the potential ecological risks of Anding County, Tunchang County, and Wuzhishan in central Hainan Province were lower, while those of Wenchang, Qionghai, and Qiongzhong were higher. The single factor pollution index was calculated by dividing the concentration by the evaluation standard of the pollutant, while the potential ecological risk index was calculated by dividing the concentration by the local background value and multiplying the toxicity response parameter. The evaluation results were different owing to the different dividends and different evaluation grades. Based on the single factor pollution index, the SSD evaluation result was obtained by replacing the evaluation standard of the pollutant with the HC5 or PNEC. Since the evaluation standard was 0.60 mg/kg, HC5 was 1.15 mg/kg, and PNEC was 0.21 mg/kg, it was clear that the result was stricter for the PNEC, followed by those of the single factor pollution index and HC5. According to the results of PERA, Hainan Province had a Cd risk probability of 3.84%, which meant that there was a probability of 3.84% that 5% of species would be affected by the toxic effect at the NOEC/LOEC level. Owing to the restriction of the screened data, the PERA results were only presented at the provincial level, but the results were quantitative. Taking other provinces into comparison, the conclusion was robust and the finding was consistent with the above comparison analysis.
By comparing various entropy methods and the probability method, it was found that each has advantages and disadvantages. The single factor pollution index and the potential ecological hazard index are both simple in calculation and have low demands for data and technology. The two methods are similar in that the ecological risk can be evaluated qualitatively, and the applied standard values partly determine the degree of risk. The toxicity response parameter for heavy metals is integrated into the potential ecological hazard index method, which can better reveal the toxicity of heavy metals and the harm of heavy metals pollution to the environment. However, the weighting of the toxicity coefficient was not consistent in the current study. Similarly, the SSD is also based on the entropy method. The biggest difference between the methods is that the soil Cd background value of each province is applied as the denominator in Hakanson potential ecological risk method, while the PNEC is used as the denominator in the SSD method. PNEC inferred from the dose-effect evaluation is introduced in the SSD model, which makes the results more precise and makes the risk assessment over a whole region possible. Meanwhile, for the SSD, the evaluation result is also qualitative because it is still a type of entropy method, and it fails to express the harm to specific species in the ecosystem chain. In contrast, PERA takes the form of probability as a quantitative approach, and the evaluation result is more objective. However, compared with other methods, it has high data demands and the methodology is complicated, which makes it difficult to popularize in practical applications. In conclusion, entropy methods were widely used for its handleability, but its incomplete quantization limited the accuracy of this method in ecological risk assessment. With the establishment of basic database and the development of computer technology, the probability method will play a greater role in the quantitative assessment of ecological risk in multi-evaluation area.
Conclusion
The heavy metal contamination problem in China’s coastal areas cannot be ignored, especially Cd contamination. Based on the environmental exposure and ERA results, the soil in coastal areas was seriously contaminated by Cd, and the contamination was more serious in economically developed or highly industrialized regions, such as the Beijing-Tianjin-Hebei region, Yangtze River Delta region, and Pearl River Delta. In China’s coastal areas, the soil Cd content in 10.33% of the counties was higher than the minimum of risk control value (1.5 mg/kg), and in 4.00% of the counties was higher than the maximum of risk control value (4.0 mg/kg). Zhuji which is a county under the jurisdiction of Zhejiang Province has the highest ecological risk. According to the probabilistic risk assessment results, Guangxi Province, Zhejiang Province, and Guangdong Province ranked among the top three coastal areas for soil Cd contamination, and the ecological risks were 18.80%, 17.89%, and 15.77% at the NOEC/LOEC level, respectively.
In this study, the ecological risk was assessed by applying four methods, namely the single factor pollution index, potential ecological hazard index, SSD method, and PERA. By comparing and analyzing the advantages and disadvantages of different methods, it was determined that PERA was the best way to represent the ecological risk using a quantitative approach, and the qualitative results of the other methods are subject to the selection of environmental criteria. In general, this study provided a quantitative contrasting analysis for the methods of ERA, while the identification of the ecological risks of Cd in the soil of coastal areas of China can help policymakers in regional strategic planning from the perspective of ecosystem protection.
Supplemental Material
Download MS Word (82.6 KB)Disclosure statement
The authors declare no conflicts of interest.
Supplementary material
The supplementary data for this article can be accessed here.
Additional information
Funding
Related Research Data
References
- Baltas, H., M. Sirin, G. Dalgic, E. Y. Bayrak, and A. Akdeniz. 2017. “Assessment of Metal Concentrations (Cu, Zn, and Pb) in Seawater, Sediment and Biota Samples in the Coastal Area of Eastern Black Sea, Turkey.” Marine Pollution Bulletin 122 (1–2): 475–12. doi:10.1016/j.marpolbul.2017.06.059.
- Chen, K., L. Huang, B. Yan, H. Li, H. Sun, and J. Bi. 2014. “Effect of Lead Pollution Control on Environmental and Childhood Blood Lead Level in Nantong, China: An Interventional Study.” Environmental Science & Technology 48 (21): 12930–12936. doi:10.1021/es502994j.
- Chen, X., M. Guo, J. Feng, S. Liang, D. Han, and J. Cheng. 2019. “Characterization and Risk Assessment of Heavy Metals in Road Dust from a Developing City with Good Air Quality and from Shanghai, China.” Environmental Science and Pollution Research 26 (11): 11387–11398. doi:10.1007/s11356-019-04550-2.
- Chen, X., X. Xia, Y. Zhao, and P. Zhang. 2010. “Heavy Metal Concentrations in Roadside Soils and Correlation with Urban Traffic in Beijing, China.” Journal of Hazardous Materials 181 (1–3): 640–646. doi:10.1016/j.jhazmat.2010.05.060.
- Chen, Y., M. Tang, S. Wang, Q. Wang, W. Zhan, and G. Huang. 2016. “Evaluation of Heavy Metal Pollution in Farmland Soil of China Based on Bibliometrics.” Chinese Journal of Soil Science 47 (1): 219–225. ( in Chinese). doi:10.19336/j.cnki.trtb.2016.01.034.
- Costa-Boeddeker, S., P. Hoelzmann, T. Le Xuan, H. Hoang Duc, N. Hoang Anh, O. Richter, and A. Schwalb. 2017. “Ecological Risk Assessment of a Coastal Zone in Southern Vietnam: Spatial Distribution and Content of Heavy Metals in Water and Surface Sediments of the Thi Vai Estuary and Can Gio Mangrove Forest.” Marine Pollution Bulletin 114 (2): 1141–1151. doi:10.1016/j.marpolbul.2016.10.046.
- Del Signore, A., A. J. Hendriks, H. J. R. Lenders, R. S. E. W. Leuven, and A. M. Breure. 2016. “Development and Application of the SSD Approach in Scientific Case Studies for Ecological Risk Assessment.” Environmental Toxicology and Chemistry 35 (9): 2149–2161. doi:10.1002/etc.3474.
- Duan, Q., J. Lee, Y. Liu, H. Chen, and H. Hu. 2016. “Distribution of Heavy Metal Pollution in Surface Soil Samples in China: A Graphical Review.” Bulletin of Environmental Contamination and Toxicology 97 (3): 303–309. doi:10.1007/s00128-016-1857-9.
- Fang, A., J. Dong, and Y. An. 2019. “Distribution Characteristics and Pollution Assessment of Soil Heavy Metals under Different Land-Use Types in Xuzhou City, China.” Sustainability 11 (7): 1832. doi:10.3390/su11071832.
- Gao, J., and L. Wang. 2018. “Ecological and Human Health Risk Assessments in the Context of Soil Heavy Metal Pollution in a Typical Industrial Area of Shanghai, China.” Environmental Science and Pollution Research 25 (27): 27090–27105. doi:10.1007/s11356-018-2705-8.
- Gao, X., J. Li, X. Wang, J. Zhou, B. Fan, W. Li, and Z. Liu. 2019. “Exposure and Ecological Risk of Phthalate Esters in the Taihu Lake Basin, China.” Ecotoxicology and Environmental Safety 171: 564–570. doi:10.1016/j.ecoenv.2019.01.001.
- Hakanson, L. 1980. “An Ecological Risk Index for Aquatic Pollution-Control-A Sedimentological Approach.” Water Research 14 (8): 975–1001. doi:10.1016/0043-1354(80)90143-8.
- Han, W., G. Gao, J. Geng, Y. Li, and Y. Wang. 2018. “Ecological and Health Risks Assessment and Spatial Distribution of Residual Heavy Metals in the Soil of an E-Waste Circular Economy Park in Tianjin, China.” Chemosphere 197: 325–335. doi:10.1016/j.chemosphere.2018.01.043.
- Harikrishnan, N., R. Ravisankar, A. Chandrasekaran, M. S. Gandhi, K. V. Kanagasabapathy, M. V. R. Prasad, and K. K. Satapathy. 2017. “Assessment of Heavy Metal Contamination in Marine Sediments of East Coast of Tamil Nadu Affected by Different Pollution Sources.” Marine Pollution Bulletin 121 (1–2): 418–424. doi:10.1016/j.marpolbul.2017.05.047.
- Hu, B., X. Jia, J. Hu, D. Xu, F. Xia, and Y. Li. 2017. “Assessment of Heavy Metal Pollution and Health Risks in the Soil-Plant-Human System in the Yangtze River Delta, China.” International Journal of Environmental Research and Public Health 14 (9): 1042. doi:10.3390/ijerph14091042.
- Hu, W., H. Wang, L. Dong, B. Huang, O. K. Borggaard, H. C. B. Hansen, Y. He, and P. E. Holm. 2018. “Source Identification of Heavy Metals in Peri-Urban Agricultural Soils of Southeast China: An Integrated Approach.” Environmental Pollution 237: 650–661. doi:10.1016/j.envpol.2018.02.070.
- Hu, X., J. Wang, Z. Xu, and X. Zhang. 2012. “Assessing Aquatic Ecological Risk of DEHP by Species Sensitivity Distributions.” Ecology and Environmental Sciences 21 (6): 1082–1087. ( in Chinese). doi:10.16258/j.cnki.1674-5906.2012.06.024.
- Hui, E. C. M., X. Li, T. Chen, and W. Lang. 2018. “Deciphering the Spatial Structure of China’s Megacity Region: A New Bay Area-the Guangdong-Hong Kong-Macao Greater Bay Area in the Making.” Cities. ( In press). doi:10.1016/j.cities.2018.10.011.
- Ke, X., S. Gui, H. Huang, H. Zhang, C. Wang, and W. Guo. 2017. “Ecological Risk Assessment and Source Identification for Heavy Metals in Surface Sediment from the Liaohe River Protected Area, China.” Chemosphere 175: 473–481. doi:10.1016/j.chemosphere.2017.02.029.
- Li, J., L. Pu, Q. Liao, M. Zhu, X. Dai, Y. Xu, L. Zhang, M. Hua, and Y. Jin. 2015a. “How Anthropogenic Activities Affect Soil Heavy Metal Concentration on a Broad Scale: A Geochemistry Survey in Yangtze River Delta, Eastern China.” Environmental Earth Sciences 73 (4): 1823–1835. doi:10.1007/s12665-014-3536-7.
- Li, R., R. Li, M. Chai, X. Shen, H. Xu, and G. Qiu. 2015b. “Heavy Metal Contamination and Ecological Risk in Futian Mangrove Forest Sediment in Shenzhen Bay, South China.” Marine Pollution Bulletin 101 (1): 448–456. doi:10.1016/j.marpolbul.2015.09.048.
- Liu, K., L. Fan, Y. Li, Z. Zhou, C. Chen, B. Chen, and F. Yu. 2018. “Concentrations and Health Risks of Heavy Metals in Soils and Crops around the Pingle Manganese (Mn) Mine Area in Guangxi Province, China.” Environmental Science and Pollution Research 25 (30): 30180–30190. doi:10.1007/s11356-018-2997-8.
- Lu, J., and Y. Wang. 2018. “Multi-Scale Analysis of Heavy Metals Sources in Soils of Jiangsu Coast, Eastern China.” Chemosphere 212: 964–973. doi:10.1016/j.chemosphere.2018.08.155.
- Lu, Y., X. Cao, and C. Wang. 2019a. “Systematic Transformation Towards Urban Sustainable Development.” Acta Ecologica Sinica 39 (4): 1125–1134. ( in Chinese). doi:10.5846/stxb201812052661.
- Lu, Y. L., Y. Q. Zhang, X. H. Cao, C. C. Wang, Y. C. Wang, M. Zhang, R. C. Ferrier, et al. 2019b. “Forty Years of Reform and Opening Up: China’s Progress toward a Sustainable Path.” Science Advances 5 (8): eaau9413. doi:10.1126/sciadv.aau9413.
- Luo, X. S., Y. Xue, Y. Wang, L. Cang, B. Xu, J. Ding. 2015. “Source Identification and Apportionment of Heavy Metals in Urban Soil Profiles.” Chemosphere 127:152–157. doi:10.1016/j.chemosphere.2015.01.048.
- Ma, L., Z. Yang, L. Li, and L. Wang. 2016. “Source Identification and Risk Assessment of Heavy Metal Contaminations in Urban Soils of Changsha, a Mine-Impacted City in Southern China.” Environmental Science and Pollution Research 23 (17): 17058–17066. doi:10.1007/s11356-016-6890-z.
- Mao, L., H. Ye, F. Li, H. Tao, L. Shi, L. Chen, W. Shi, G. Yan, and H. Chen. 2017. “Source-Oriented Variation in Trace Metal Distribution and Fractionation in Sediments from Developing Aquaculture Area-A Case Study in South Hangzhou Bay, China.” Marine Pollution Bulletin 125 (1–2): 389–398. doi:10.1016/j.marpolbul.2017.09.046.
- Marrugo-Negrete, J., J. Pinedo-Hernandez, and S. Diez. 2017. “Assessment of Heavy Metal Pollution, Spatial Distribution and Origin in Agricultural Soils along the Sinu River Basin, Colombia.” Environmental Research 154: 380–388. doi:10.1016/j.envres.2017.01.021.
- MEP of China. 2014. “National Soil Pollution Survey Bulletin.” Available at http://www.zhb.gov.cn/gkml/hbb/qt/201404/t20140417_270670.htm
- PGHU. 2014–2016. “Heavy Metal Contaminated Farmland Restoration and Plantation Structure Adjustment Pilot Program in Hunan Province, China”. People’s Government of Hunan Province. ( in Chinese).
- Polidoro, B. A., M. T. Comeros-Raynal, T. Cahill, and C. Clement. 2017. “Land-Based Sources of Marine Pollution: Pesticides, PAHs and Phthalates in Coastal Stream Water, and Heavy Metals in Coastal Stream Sediments in American Samoa.” Marine Pollution Bulletin 116 (1–2): 501–507. doi:10.1016/j.marpolbul.2016.12.058.
- Reboredo, F., M. Simoes, C. Jorge, M. Mancuso, J. Martinez, M. Guerra, J. C. Ramalho, M. F. Pessoa, and F. Lidon. 2019. “Metal Content in Edible Crops and Agricultural Soils Due to Intensive Use of Fertilizers and Pesticides in Terras Da Costa De Caparica (Portugal).” Environmental Science and Pollution Research 26 (3): 2512–2522. doi:10.1007/s11356-018-3625-3.
- Shi, Y., R. Wang, Y. Lu, S. Song, A. C. Johnson, A. Sweetman, and K. Jones. 2016. “Regional Multi-Compartment Ecological Risk Assessment: Establishing Cadmium Pollution Risk in the Northern Bohai Rim, China.” Environment International 94: 283–291. doi:10.1016/j.envint.2016.05.024.
- Shi, Y., X. Xu, Q. Li, M. Zhang, J. Li, Y. Lu, R. Liang, X. Zheng, and X. Shao. 2018. “Integrated Regional Ecological Risk Assessment of Multiple Metals in the Soils: A Case in the Region around the Bohai Sea and the Yellow Sea.” Environmental Pollution 242: 288–297. doi:10.1016/j.envpol.2018.06.058.
- Wang, H., Q. Wu, W. Hu, B. Huang, L. Dong, and G. Liu. 2018. “Using Multi-Medium Factors Analysis to Assess Heavy Metal Health Risks along the Yangtze River in Nanjing, Southeast China.” Environmental Pollution 243: 1047–1056. doi:10.1016/j.envpol.2018.09.036.
- Wang, T., F. Sun, S. Zeng, and M. He. 2015. “Probabilistic Ecological Risk Assessment of Estradiol in the Effluents of Wastewater Treatment Plants in Beijing.” Asian Journal of Ecotoxicology 10 (1): 271–280. ( in Chinese). doi:10.7524/AJE.1673-5897.20140423003.
- Wang, Z., X. Yang, D. Fan, M. Guo, J. Liu, and L. Shi. 2017. “Ecological Risk Assessment of Triclocarban in Fresh Water of China by Species Sensitivity Distribution.” Journal of Ecology and Rural Environment 33 (10): 921–927. doi:10.11934/j..1673-4831.2017.10.008.
- Wei, B., and L. Yang. 2010. “A Review of Heavy Metal Contaminations in Urban Soils, Urban Road Dusts and Agricultural Soils from China.” Microchemical Journal 94 (2): 99–107. doi:10.1016/j.microc.2009.09.014.
- Wu, J., J. Lu, L. Li, X. Min, and Y. Luo. 2018. “Pollution, Ecological-Health Risks, and Sources of Heavy Metals in Soil of the Northeastern Qinghai-Tibet Plateau.” Chemosphere 201: 234–242. doi:10.1016/j.chemosphere.2018.02.122.
- Xia, X., X. Chen, R. Liu, and H. Liu. 2011. “Heavy Metals in Urban Soils with Various Types of Land Use in Beijing, China.” Journal of Hazardous Materials 186 (2–3): 2043–2050. doi:10.1016/j.jhazmat.2010.12.104.
- Xiao, L., and R. Zhao. 2017. “China’s New Aera of Ecological Civilization.” Science 358 (6366): 1008–1009. doi:10.1126/science.aar3760.
- Xu, F. L., Y. L. Li, Y. Wang, W. He, X. Z. Kong, N. Qin, W. X. Liu, W. J. Wu, and S. E. Jorgensen. 2015. “Key Issues for the Development and Application of the Species Sensitivity Distribution (SSD) Model for Ecological Risk Assessment.” Ecological Indicators 54: 227–237. doi:10.1016/j.ecolind.2015.02.001.
- Xu, X., T. Wang, M. Sun, Y. Bai, C. Fu, L. Zhang, X. Hu, and S. Hagist. 2019. “Management Principles for Heavy Metal Contaminated Farmland Based on Ecological Risk-A Case Study in the Pilot Area of Hunan Province, China.” Science of the Total Environment 684: 537–547. doi:10.1016/j.scitotenv.2019.05.015.
- Xue, P., Q. Zhao, H. Sun, L. Geng, Z. Yang, and W. Liu. 2019. “Characteristics of Heavy Metals in Soils and Grains of Wheat and Maize from Farmland Irrigated with Sewage.” Environmental Science and Pollution Research 26 (6): 5554–5563. doi:10.1007/s11356-018-3997-4.
- Xue, Z. J., S. Q. Liu, Y. L. Liu, and Y. L. Yan. 2012. “Health Risk Assessment of Heavy Metals for Edible Parts of Vegetables Grown in Sewage-Irrigated Soils in Suburbs of Baoding City, China.” Environmental Monitoring and Assessment 184 (6): 3503–3513. doi:10.1007/s10661-011-2204-6.
- Yang, Q., Z. Li, X. Lu, Q. Duan, L. Huang, and J. Bi. 2018. “A Review of Soil Heavy Metal Pollution from Industrial and Agricultural Regions in China: Pollution and Risk Assessment.” Science of the Total Environment 642: 690–700. doi:10.1016/j.scitotenv.2018.06.068.
- Yang, W., R. Wang, J. Huang, F. Li, and Z. Chen. 2007. “Ecological Risk Assessment and It’s Research Progress.” Chinese Journal of Applied Ecology 08: 1869–1876. ( in Chinese). doi:10.13287/j.1001-9332.2007.0292.
- Zeng, S., Y. Huang, F. Sun, D. Li, and M. He. 2016. “Probabilistic Ecological Risk Assessment of Effluent Toxicity of a Wastewater Reclamation Plant Based on Process Modeling.” Water Research 100: 367–376. doi:10.1016/j.watres.2016.05.039.
- Zhang, C., B. Shan, Y. Zhao, Z. Song, and W. Tang. 2018. “Spatial Distribution, Fractionation, Toxicity and Risk Assessment of Surface Sediments from the Baiyangdian Lake in Northern China.” Ecological Indicators 90: 633–642. doi:10.1016/j.ecolind.2018.03.078.
- Zhang, L., Z. Shi, J. Zhang, Z. Jiang, F. Wang, and X. Huang. 2015. “Spatial and Seasonal Characteristics of Dissolved Heavy Metals in the East and West Guangdong Coastal Waters, South China.” Marine Pollution Bulletin 95 (1): 419–426. doi:10.1016/j.marpolbul.2015.03.035.
- Zhang, L., C. Wei, H. Zhang, and M. Song. 2017. “Criteria for Assessing the Ecological Risk of Nonylphenol for Aquatic Life in Chinese Surface Fresh Water.” Chemosphere 184: 569–574. doi:10.1016/j.chemosphere.2017.06.035.