
 ?Mathematical formulae have been encoded as MathML and are displayed in this HTML version using MathJax in order to improve their display. Uncheck the box to turn MathJax off. This feature requires Javascript. Click on a formula to zoom.
ABSTRACT
Ventilation corridors in cities can decrease air pollution and alleviate heat island problems but there remains a need to fully assess their effectiveness. Few urban managers have been able to take city-scale approaches to the construction of urban ventilation corridors. This study aimed to introduced the Ventilation Corridor Planning (VCP) model, which is a multi-criteria evaluation method combined with a geographical information system (GIS) to determine where the ventilated environment is most appropriate. Specifically, the VCP model took Bozhou, China as the research object and contained two scales, including mesoscale and local scale. In mesoscale scale, we got three outputs to build urban ventilation corridors, including 1) background wind environment, 2) ventilation potential, 3) heat island intensity. In local scale, we used traditional computational fluid dynamics (CFD) model to verify the impact of VCP criteria. The results revealed that compared with the traditional CFD model, the proposed VCP model has advantages in establishing a comprehensive evaluation standard. In addition, the application of VCP model in macro and micro also enhances the efficiency of ventilation corridor construction. Overall, this study introduced a effective modeling method to urban ventilation corridors planning, and provide a way to study the urban climate.
Introduction
Due to the rapid urbanization experienced in recent decades, China is confronted with a series of environmental issues, such as air pollution, heat island problems, and traffic congestion (Chang et al. Citation2017; Yuan et al. Citation2018). One of the most serious problems is air pollution, which affects 54% of the national population, with this figure expected to increase up to 66% by 2050 (United Nations Citation2014). To improve the air quality in urban areas, strategies for improving urban ventilation need to be evaluated and implemented (Peng et al. Citation2017). Urban ventilation is defined as the ability of an urban area to dilute pollutants and heat by exchanging air between the areas within and above the urban canopy (Antoniou et al. Citation2017; Neophytou and Britter Citation2005), while earlier research has shown that it can play a significant role in improving urban air quality (Panagiotou et al. Citation2013; Nazarian and Kleissl Citation2016). Urban ventilation depends on the combination of a wide variety of urban geometry parameters, such as frontal area density and plan area density as well as the aspect ratio of the urban morphology (Buccolieri, Sandberg, and Di Sabatino Citation2010; Hang and Li Citation2010; Kubilay et al. Citation2017). For example, it has been shown that building height variations can be beneficial in terms of breathability levels (Chen et al. Citation2017; Wen, Juan, and Yang Citation2017), while larger aspect ratios of urban canyons can lead to higher pollutant concentrations inside the street (He, Ding, and Prasad Citation2019; Kruger, Minella, and Rasia Citation2011; Liu, Leung, and Barth Citation2005). The impact of meteorological parameters, such as wind speed, wind direction, temperature, and humidity are also extremely important for urban ventilation (Lau and Ngan Citation2018; Pacifici, Rama, and de Castro Citation2019; Ren et al. Citation2018). Furthermore, the actual pollutant concentration at street level has been found to be strongly linked to meteorological parameters (Kubilay et al. Citation2017; Yuan et al. Citation2019). Currently, computer numerical simulation approaches, such as computational fluid dynamics (CFD), are used to analyze urban ventilation environments (Ding, Lam, and Feng Citation2017; Lyu, Buccolieri, and Gao Citation2015). Specifically, the wind pressure and velocity in both summer and winter are analyzed according to the urban planning and design scheme to provide feedback on the wind environment (Bajsanski, Stojakovic, and Jovanovic Citation2016; Guo, Liu, and Yuan Citation2015; Hsieh and Huang Citation2016; Ramponi et al. Citation2015). However, this widely used method has several drawbacks. These simulations focus strongly on the physical environment of certain districts and buildings that cover small ranges, and they are rarely powerful enough to investigate a large area (Badas et al. Citation2017; Luo, H, and N Citation2017). Even if this method was to work for an entire city, the amount of information and data required would be very large, making both the modeling and the simulation time-consuming and labor–intensive (Hang et al. Citation2012; Liu, Pan, and Cao Citation2019; Qiao et al. Citation2017; Vernay, Raphael, and Smith,lan Citation2015). A CFD model rarely focuses on the weather-related parameters, are important to relieve air pollution and heat island problems. Therefore, it is urgent to combine the CFD model with meteorological parameters (Hang et al. Citation2015; Yang et al. Citation2019). From the existing research and practice, urban climatology has two main ways to influence urban construction: one is to guide urban planning with the application of climate maps; the other is to guide urban design with the study of the climatic properties of regional urban spaces (Xiao and Yin Citation2017). Besides, urban climatology can use large-scale observation and test methods to evaluate the ventilation environment of the city on the basis of traditional CFD simulations, using relevant meteorological parameters of the city.
In order to better apply urban climatology to the construction of urban ventilation corridors, this study introduced a spatial planning approach called Ventilation Corridor Planning (VCP) model, which combines an urban climatology based multi-criteria evaluation of three criteria (e.g., the wind environment, ventilation potential, and heat island intensity) (Cariolet et al. Citation2018; Meerow and Newell Citation2017). The purpose of this study is to establish a VCP model based on urban climatology, and then make an effective evaluation of urban ventilation corridors. To be specific, the VCP model first use the wind environment in the urban boundary layer (UBL) to determine the direction of ventilation corridors. And then according to the urban ventilation potential, we identified the areas that need planning wind corridors. It’s important to note that we choose the regions with greater ventilation potential to ensure the ventilation efficiency. However, the ventilation volume in different areas is still uncertain. The ventilation volume of the city is mainly determined by the width of the air corridor, and can influence the temperature drop range in different areas to some extent. Based on this, we inverted the surface temperature, in order to plan wider wind corridors for the warmer regions (Marzena, Andreas, and Katarzyna Citation2017). Finally on the urban canopy layer (UCL) scale, we used the CFD simulation to compare the values before and after, aiming to analysis the impact of different VCP criteria.
Research methods and study area
Scale of the urban climatology
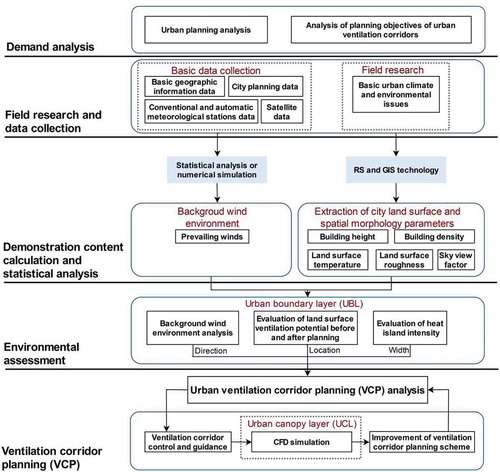
From the perspective of urban climatology, the application of the VCP model contains two scales in this study, the UBL at the mesoscale and the UCL at local scale (Hang et al. Citation2015) (). The UBL has a height range from the roof of a city building to the middle of a cumulus cloud. Since most pollutants are generated in the UBL, the UBL structure not only controls the transportation, accumulation and diffusion of primary pollutants (Zheng et al. Citation2019), but affects the overall spatial layout of the city (Wang et al. Citation2019). We thus choose it to conduct a comprehensive evaluation on wind environment, ventilation potential, and heat island intensity of cities at the UBL scale, which can delimit urban wind corridors. The UCL is the layer approximately up to the mean roof height where flow channeling occurs along the streets. Different techniques exist to describe the wind flow inside (in the UCL) (Ricci et al. Citation2017). As mentioned above, the CFD simulation technology was used in the UCL to analysis the difference between the current and planned VCP criteria that affect the ventilation corridors. The above two scales correspond to different factors, including building height, building density, building shape, street direction and width, the greening scale, and spatial distribution (Javanroodi, Mahdavinejad, and Nik Citation2018). We link these factors to the VCP model to improve the overall spatial layout of the city.
Figure 1. Hierarchical diagrams of the different scales of urban climatology
Methods: the VCP model
Based on the perspective of urban climatology, the study utilizes the VCP model to establish urban climate and ventilation corridors and corresponding technical framework () to explain three criteria to construct ventilation corridors, using the VCP model (Tong, Li, and Westerdahl Citation2019). Specifically, the VCP model is divided into three steps. In the UBL scale, we integrate the wind environment, ventilation potential, and heat island intensity into three criteria. (1) According to the background wind environment, the dominant wind direction and wind speed of the city are determined to ensure that the direction of the urban ventilation corridor is coordinated with the natural terrain in the spatial layout without deviation (Luo, H, and N Citation2017). (2) Then, we determined the location of the ventilation corridor according to the ventilation potential. Ventilation potential is one of the important bases for constructing urban ventilation corridors, which always affected by the ground coverage of buildings, the roughness of natural vegetation, and the openness of the surrounding area (Marzena, Andreas, and Katarzyna Citation2017). Based on the above, ventilation potential is determined by sky view factor (SVF) and roughness length. The specific analysis process is in Section 2.2.2. We divide ventilation potential into five levels. For example, if an area has high sky view factor but low roughness, the ventilation potential level of this area is relatively high, which is suitable for the layout of ventilation corridors. The right location will facilitate our next step in spatial planning. (3) We carried out analysis of the thermal environment of VCP to reduce urban temperature and optimize ventilation corridors planning (Hong and Lin Citation2015). The ventilation volume of a city can determine the extent of temperature reduction, and the width of the corridor can influence the ventilation volume to some extent, so the width of the corridor is included in our assessment. Based on the analysis of the wind environment, the study was integrated with the surface urban heat island (SUHI) to determine the width of the stroke gallery in the spatial layout (Hsieh and Huang Citation2016). In addition, we use CFD simulation to analysis the impact of VCP criteria in the UCL scale.
Background wind environment
In terms of the background wind environment, wind speed, wind direction, and the occurrence of light wind were used as the indicators. Hourly observations of meteorological data in Bozhou City since 2001 were collected (Razak et al. Citation2013). The results showed that an east wind prevailed in Bozhou City as a whole, with the city located in an area of low wind speeds. The average wind speed over the last 20 years displayed a gradually weakening trend, with a decrease of 0.08 m/s every 10 years.
Figure 2. Technical route used for urban ventilation corridors planning (VCP)
Ventilation potential
Urban ventilation potential specifically refers to the city’s potential to rely on ventilation to ensure acceptable air quality and thermal comfort (Guo et al. Citation2017). Compared with the natural ventilation (NV) of the city, it can better reflect potential impact on spatial layout of the city (Luo, H, and N Citation2017). Due to the non-uniformity of the height of the city’s underlying surface, especially the existence of a large number of buildings with different heights, it is difficult to evaluate the ventilation on the UBL scale. Therefore, surface roughness, a quantitative indicator, is introduced as a key evaluation factor to characterize the influence of building height and coverage on the urban ventilation. Meanwhile, surface roughness is combined with another important factor–sky view factor to define the surface roughness potential of a city. We used remote sensing data, urban planning data and basic geographic data to analyze the surface ventilation potential of central Bozhou City. The sky view factor and surface roughness were calculated from these data, and the surface ventilation potential was evaluated based on the calculated results (Wang et al. Citation2018b). By classifying different levels of ventilation potential, we estimated the current and future surface ventilation in the central urban area.
Sky view factor (SVF)
To use specific values to represent the openness of surrounding areas, the SVF, which is a morphological parameter, needs to be determined (Kruger, Minella, and Rasia Citation2011). To obtain the SVF of Bozhou central city, basic geographic information was used to obtain a three-dimensional raster image of building heights in downtown Bozhou at 5 m by 5 m spatial resolution. Based on the geographical information system (GIS) and Envi 5.3 software, the raster image could be used for vector estimation, and then three-dimensional building data could be used to geometrically arrange the sky openness to obtain the results for the city. The SVF was calculated using the following expression:
where Ω is the visible solid angle of the sky; γi is the terrain elevation angle for the ith azimuth; R is the terrain influence radius; n is the calculated azimuth number; SVF is the normalized sky visible stereo corner, i.e., sky view factor.
Surface roughness
There are many factors that affect the surface roughness, but the key parameters are the coverage and heights of buildings (Yuan, Ren, and Ng Citation2014). In this study, we used a morphological model to estimate the urban roughness length (RL), with (Z0) and (Zd) calculated based on the geometry and distribution density of the roughness element. The RL value was calculated using the following expressions:
where Zd is the zero plane displacement height (m); Z0 is the roughness length (m); Zh is the roughness element height (m); Zd/Zh is the normalized zero plane displacement height; Z0/Zh is the normalized roughness length; Uh is wind speed; u* is friction velocity (or shear speed); and λF is the building cross-sectional area index. The peak normalized roughness length Z0/Zh corresponding to the building coverage λP was concentrated around 0.35. We therefore used an urban building coverage of 0.35 as the peak value to reverse the relationship between the building cross-sectional area index λF and the urban building density λP. After finishing these operations, the results obtained when λF = 0.8λP was adopted and considered to be stable.
The calculated surface roughness length and SVF were used to calculate the surface ventilation potential, and the calculated results were graded according to the principles in .
Table 1. Classification of ventilation potential grades
Heat island effect
The heat island intensity was statistically analyzed to determine the influence of the urban thermal environment on central Bozhou City (Allegrini and Carmeliet Citation2018). We used temperature at 2:48 PM on 3 May 2018 to calculate surface urban heat island (SUHI), because there is no rainfall prior or after this day, eliminating the precipitation effects on SUHI. For the calculation of heat island intensity, we used the atmospheric correction method. Landsat8 Operational Land Imager/Thermal Infrared Sensor (OLI/TIRS) data were processed using Envi 5.3 software to invert the surface temperature. This removed the effects of atmospheric radiation on the surface based on real-time atmospheric sounding data to obtain a true ground heat radiation intensity. The algorithm considers that the thermal infrared radiation brightness value (Lλ) comprises of the atmospheric upward radiance (Lu), the atmospheric downward radiance (Ld) and the true radiation received by satellite sensor from the ground.
where ε is the surface specific emissivity; LT is the radiant brightness of a black body with temperature (T (K)) in the thermal infrared band; τ is the atmospheric transmittance, which can be obtained using online values of Lu and Ld (https://atmcorr. Gsfc.nasa.gov/). Based on the LT obtained from the formula (6), the surface temperature (Ts) was obtained using formula (7). The relevant parameters for each satellite are given in .
Table 2. Parameters used in the radiative transfer equation-based method
The heat island intensity was then calculated using the UHI intensity index (UHII) algorithm, and the UHI scale index formula is shown in the formula (8).
where UHIIi is the heat island intensity corresponding to the ith pixel on the image; Ti is the surface temperature; n is the number of effective pixels in the suburban farmland; and Tcrop is the surface temperature in the suburban farmland, which means the average surface temperature of all surrounding agricultural and forest land. We then used the reclassification tools in the ArcGIS system software to statistically determine different levels of heat island intensity (Yin et al. Citation2018). The specific results are presented in Section 3.3.
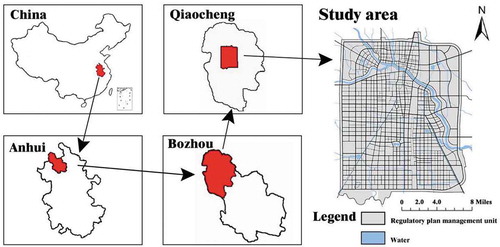
The study area
Bozhou City is located in the north of Anhui Province, China (). Southeast is the annually dominant wind direction, with an average wind speed of about 2.19 m/s, with the area therefore being a region dominated by light winds. Southerly winds prevail in summer, northerly winds prevail in winter. The annual average precipitation is 811.2 mm, and the extreme maximum and minimum temperatures are 42.1 and – 20.6°C, respectively. Bozhou has a total population of 5.21 million. Bozhou consists of one district and three counties (e.g., the Qiaocheng district, the Guoyang county, the Mengcheng county, and the Lixin county), covering an area of 8,394 km2. The central area of the city, which was the focus of this study, is about 22.37 km2 and has a total population of about 240,000.
Figure 3. Location and scope of the study
Results and analysis
Background wind environment characteristics
Wind speed
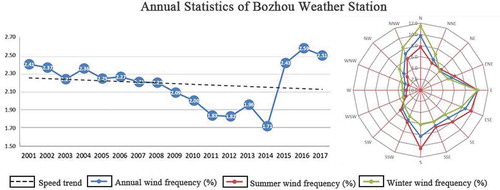
Based on the hourly wind speed data of Bozhou Weather Station since 2001, we estimated that the average annual wind speed of the station was equivalent to 2.19 m/s (equivalent to wind force 2, light wind). The maximum wind speed (10-min maximum wind speed) was 14.8 m/s (equivalent to wind force 7, high wind), which occurred at 22:00 on 3 June 2009. In terms of the average wind speed over many years, the region as a whole is a low-wind zone.
In the past 20 years, the average wind speed has been gradually decreasing, with the average annual wind speed declining at a rate of – 0.08 m/s every 10 years. However, there has been a relatively large increase since 2015. Whether this is the result of natural climate change, or an anomaly caused by station migration or changes in the surrounding built environment remains unclear and needs further investigation and analysis.
Wind direction
The wind frequency in each direction was calculated based on the hourly wind direction and wind speed observation data recorded at Bozhou weather station since 2001. The prevailing wind direction was easterly (E, 10.1%), followed by northerly (N, 9.7%) and east–southeast wind (ESE, 8.0%), with the southerly wind (S) accounting for 8.3% ().
The characteristics of wind frequency distribution in winter and summer were studied to analyze the seasonal differences of wind environment characteristics in the Bozhou region. In summer, the prevailing wind direction was southerly (S, 10.4%) followed by easterly (E, 10.2%), and the frequency of the east–southeast wind was also high (ESE, 8.0%). In winter, northerly was the dominant wind direction (N, 11.5%), followed by easterly (E, 10.1%), and north–northwest wind (NNW, 8.3%). The difference in the prevailing wind direction between winter and summer in this region is probably a reflection of the overall climatic characteristics (winter wind and summer wind), with the region’s prevailing winds varying throughout the year (Razak et al. Citation2013; Hou et al. Citation2018).
Figure 4. Bozhou annual average wind speed diagram and wind-rose diagram
Spatial distribution of the ventilation potential
Ventilation potential refers to the air circulation capacity determined by building coverage, vegetation, and the SVF, which are controlled by the ground coverage of buildings, surface roughness of natural vegetation and openness of the surrounding space, respectively. Based on remote sensing data, urban planning data and basic geographic data, the SVF and surface roughness were calculated. On this basis, an evaluation of the current future surface ventilation potential was conducted (Yang, Qian, and Lau Citation2013).
Ground coverage of buildings
In the urban area, 1:500 scale basic geographic information for Bozhou urban area was used to obtain building information, which was further used to estimate the percentage building cover and building height (Chen et al. Citation2017). The results showed that the areas with a percentage building cover of more than 50% in the Bozhou downtown area were mainly distributed in Guobei new district and the east and north of Guo River, and therefore had a patchy distribution. The areas with a low percentage of building cover were mainly the old town, and parts of Qiaocheng Economic Development Zone and Bozhou Economic Development Zone. The buildings were highest in the newly built urban area and in a small part of the old town.
Surface roughness
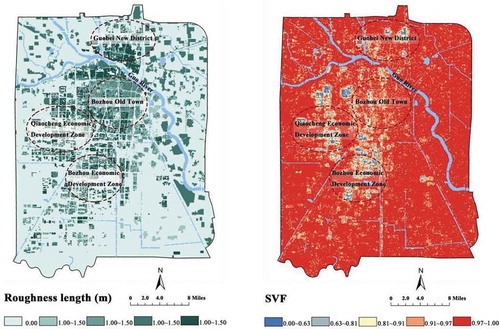
The key parameters to extract for estimating the roughness length in urban areas are mainly building coverage and building height. Because urban surface roughness is mainly caused by buildings, the spatial distribution of surface roughness length was obtained using the building density and height data within the urban area of Bozhou (). It was found that the surface roughness of Guobei new district and a few parts of the old town south of the Guo River were relatively high and distributed in clusters (). The surface roughness length of these areas was greater than 2–3.0 m. There was a patchy distribution of rough areas in parts of Qiaocheng Economic Development Zone and Bozhou Economic Development Zone. The roughness length of the urban edge and most farmland was relatively low and generally in the range of 0.5–1.0 m.
The SVF
The SVF distribution in downtown Bozhou was calculated using the 5 m resolution building height raster image obtained from the basic geographic information for the downtown area of Bozhou. The denser and taller the buildings, the less open the sky is (Lyu, Buccolieri, and Gao Citation2015). In the concentrated urban areas the SVF was less than 0.63, while the SVF was generally larger in the urban edges, alongside rivers and roads, and in the suburbs, with values greater than 0.97 ().
Figure 5. Spatial distribution of building height (left) and density (right) in central Bozhou
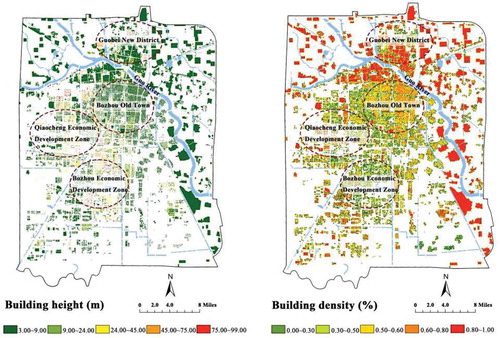
Figure 6. Spatial distribution of the roughness length (left) and sky view factor (SVF) (right) in central Bozhou
Distribution of ventilation potential levels
Areas with a high ventilation potential grade of 5 accounted for 73.5% of the city, while areas with a relatively high ventilation potential grade of 4 accounted for 0.2% of the city. These areas were considered suitable for the construction of ventilation corridors. Areas with poor ventilation potential (grade 1) were mainly distributed in the new town of Guobei and the old town area south of the Guo River, accounting for 22% of the city. In addition, the large ventilation potential area, including farmland, green land, rivers, wide streets, and areas with low-rise buildings, can be used as urban ventilation corridors in urban planning ().
Spatial distribution of heat island intensity
The spatial distribution of heat island intensity, determined using Landsat 8 remote sensing images for Bozhou on 3 May 2018 is shown in . By combining the benchmark values of the heat island strength calculation and the natural breakpoint method, we categorized the UHIIi into seven levels to evaluate the spatial strength of the heat island. Downtown Bozhou had a high proportion of strong and sub-strong heat islands, which were mainly distributed in the new town area north of Guo River, the old town area south of Guo River, and the economic development zones, but displayed a continuous spreading distribution. Parts of the northwest also had a patchy distribution of heat islands. No heat islands were identified northwest of the city center and around the Guo River in the east. Zonal distribution of weak and strong cold islands were distributed around the Guo River. According to the statistical results from ArcGIS, the area with a strong heat island was 51.4737 km2, accounting for 23.59% of the total area. The area of sub-strong heat island accounted for 33.13% of the total area and was significantly higher than that of the strong heat island. The areas of weak heat island and weak cold island were 55.94 and 1.23 km2, accounting for 25.64% and 0.56% of the total area, respectively.
Figure 7. Spatial distribution of the ventilation potential (left) and heat island intensity (right) in central Bozhou
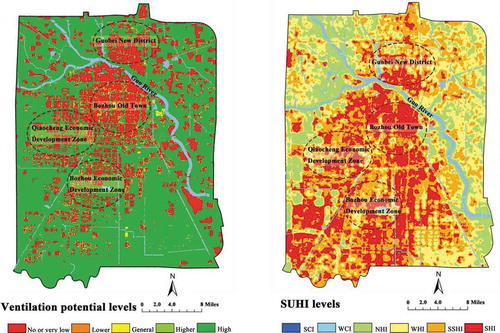
(Surface urban heat island (SUHI) levels abbreviations: SCI = strong cold island: WCI = weak cold island; NHI = no heat island; WHI = weak heat island, SSHI = sub strong heat island, SHI = strong heat island)
Discussion
A more strategic and integrated process could help to ensure that multiple ventilation corridors are provided to the areas of the city that need them most (Ren et al. Citation2018; Yuan and Ng Citation2014). The VCP model is a flexible tool to facilitate this process by providing a potential approach to evaluate ventilation that “seeks to steer spatial planning about an integrated background wind environment, ventilation potential, and heat island intensity” (Meerow and Newell Citation2017). It is consistent with the related work of studying the ventilation corridors from a macro perspective, since they have conducted comprehensive research and judgment according to relevant criteria. However, there are differences in the selection of criteria. In order to make the process of constructing ventilation corridors more reasonable, this study needs to have a deeper discussion on the criteria. Relevant studies have shown that the construction of ventilation corridors is a relatively complex process with interaction criteria (Hsieh and Huang Citation2016). Therefore, in order to deeply study the relationship between various criteria and the rationality of VCP model construction, we chose the measures to reduce the building density of the planning at the UCL scale. Since building density is a part of ventilation potential, the results will determine whether the second criteria (ventilation potential) in the VCP model can influence the construction of ventilation corridors. Similarly, other criteria in the VCP model may also be applicable.
Based on this, we selected a urban built-up area along the Beijing-Kowloon Railway in Bozhou. The complex heterogeneous urban area under study covers 0.432 km2 and is composed of low-rise and medium-rise buildings. The average and maximum building height (Zd) is about 3.5 m and 54.0 m, and the area density (λP) is 0.45, corresponding to Local Scale (compact low-rise buildings) based on the classification made by Steward and Oke (Stewart and Oke Citation2012). The aspect ratio of the street canyons (width to height) ranges from 0.5 to 1. Besides, the using of concrete and asphalt as the main building materials, the lack of green areas all lead to relatively high air temperatures inside the street canyons during the summer period (Hang et al. Citation2015; Lau and Ngan Citation2018). In this study, we adopted measures to reduce building density through the simulation of PHOENICS software. Specifically, based on the size of the settlement model, we defined a suitable three-dimensional calculation area divided into cells of horizontal surface area of 57 × 57 m2. Besides, the study used the standard k – ε model to simulate the northerly wind on 1 May 2019. According to the background wind environment, we set the average wind speed to 2.19 m/s. In addition, considering that the actual ground conditions were mostly rough, we used a power law index value of 0.22, and a simulation analysis of the wind speed at a pedestrian height of 1.5 m. The velocity-inlet was used to calculate the basin inflow, and the case was defined as outflow when the outbound boundary speed was unknown () (Hou et al. Citation2018). The details of the simulation parameters are shown in .
Figure 8. 3-D map of building geometry with streamwise vertically bounded cases A and B
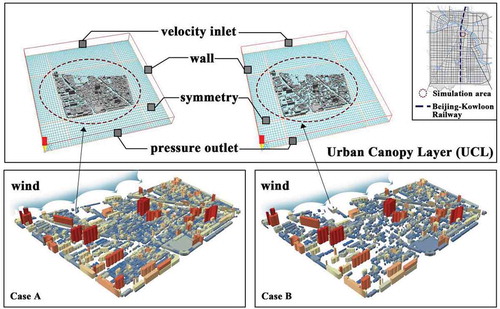
Table 3. Parameters used in the simulation of the Bozhou central city wind environment
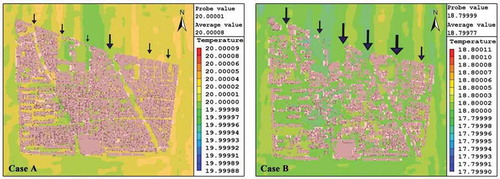
According to the simulation results, the change of ventilation potential index will affect the heat island intensity index and the background wind environment index. In case A, the overall average wind speed did not exceed 4.01 m/s, while in case B, the wind speed fell and remained at about 4.18 m/s, as shown in . From the simulated cloud map, it was clear that the demolition of some buildings would reduce the building density, which would have the effect of increasing wind speed. This is consistent with the previous research that the ventilation potential index has an impact on the background wind environment index, since the number of air vents and ventilation corridors will increase with the rising of the ventilation potential values (Javanroodi, Mahdavinejad, and Nik Citation2018). In addition, the ventilation potential index can also affect the heat island intensity index. As shown in , the average temperature dropped from 20.00 to 18.79°C in the urban area, which is most likely because ventilation potential index such as building density also affect surface temperature (Pacifici, Rama, and de Castro Citation2019; Yin et al. Citation2018). In general, when the ventilation potential index is high, the wind speed will increase and the heat island intensity index will decrease. Therefore, in the construction of VCP model, the selection of criteria still needs more detailed discussion and analysis.
Figure 9. Contrast in the wind velocity distribution before (Case A) and after optimization (Case B)
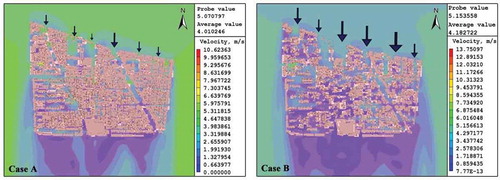
Figure 10. Contrast in the temperature distribution before (Case A) and after optimization (Case A)
Conclusions
The effective construction of urban ventilation corridors plays an important role in improving urban climate. The study, based on the main urban area of Bozhou as the research object, showed that the ventilation corridor planning (VCP) model, integrating three commonly cited benefits of ventilation corridors (background wind environment, ventilation potential and heat island intensity), can be used as a generalizable approach to spatial planning. This approach can help the designer and local communities to make detailed value judgments and timely feedback adjustments, and finally propose a relatively comprehensive plan that incorporates a wide range of economic and environmental benefits (Wang et al. Citation2018a).
We used the VCP model to examine the planning and construction of ventilation corridors in the main urban area of Bozhou. The results revealed that the VCP model can apply the spatial planning of urban-scale ventilation corridors. It is worth noting that different criteria have an impact on the construction of the VCP model. For example, the ventilation potential index will affect the location selection of ventilation corridor, while the heat island intensity index will affect the volume of the ventilation corridor. Therefore, how to balance the criteria to achieve the optimal effect is the next work of this study.
In addition, different criteria in VCP model will affect each other. When the ventilation potential index value is increased, it will have a positive impact on the other two criteria (background wind environment and the heat island intensity) and improve the climatic environment of the region to some extent. Our findings indicate that it is necessary for urban planners to adjust the reasonable urban structure to obtain excellent ventilation potential, which is also the original intention of establishing the VCP model. The study proved that ventilation potential criteria have a certain impact, but there are still some limitations, such as the exploration of other criteria. In general, the VCP model has great practicability, it was initially developed using three criteria for Bozhou City, but the modeling approach can be adopted for the spatial planning of other ventilation corridors in a wide range of cities.
Disclosure statement
No potential conflict of interest was reported by the authors.
Additional information
Funding
References
- Allegrini, J., and J. Carmeliet. 2018. “Simulations of Local Heat Islands in Zürich with Coupled CFD and Building Energy Models.” Urban Climate 24: 340–13. doi:10.1016/j.uclim.2017.02.003.
- Antoniou, N., H. Montazeri, H. Wigo, M. Neophytou, B. J. E. Blocken, and M. Sandberg. 2017. “CFD and Wind-tunnel Analysis of Outdoor Ventilation in a Real Compact Heterogeneous Urban Area: Evaluation Using “Air Delay.” Building and Environment 126: 355–372. doi:10.1016/j.buildenv.2017.10.013.
- Badas, M. G., S. Ferrari, M. Garau, and G. Querzoli. 2017. “On the Effect of Gable Roof on Natural Ventilation in Two-dimensional Urban Canyons.” Journal of Wind Engineering and Industrial Aerodynamics 162: 24–34. doi:10.1016/j.jweia.2017.01.006.
- Bajsanski, I., V. Stojakovic, and M. Jovanovic. 2016. “Effect of Tree Location on Mitigating Parking Lot Insolation.” Computers, Environment and Urban Systems 56: 59–67. doi:10.1016/j.compenvurbsys.2015.11.006.
- Buccolieri, R., M. Sandberg, and S. Di Sabatino. 2010. “City Breathability and Its Link to Pollutant Concentration Distribution within Urban-like Geometries.” Atmospheric Environment 44 (15): 1894–1903. doi:10.1016/j.atmosenv.2010.02.022.
- Cariolet, J. M., M. Colombert, M. Vuillet, and Y. Diab. 2018. “Assessing the Resilience of Urban Areas to Traffic-related Air Pollution: Application in Greater Paris.” Science of the Total Environment 615: 588–596. doi:10.1016/j.scitotenv.2017.09.334.
- Chang, I. S., Q. Yilihamu, J. Wu, H. Wu, and B. Nan. 2017. “Health Impact Assessment in Environmental Impact Assessment in China: Status, Practice and Problems.” Environmental Impact Assessment Review 66: 127–137. doi:10.1016/j.eiar.2017.05.007.
- Chen, L., J. Hang, M. Sandberg, L. Claesson, S. Di Sabatino, and H. Wigo. 2017. “The Impacts of Building Height Variations and Building Packing Densities on Flow Adjustment and City Breathability in Idealized Urban Models.” Building and Environment 118: 344–361. doi:10.1016/j.buildenv.2017.03.042.
- Ding, C., K. P. Lam, and W. Feng. 2017. “An Evaluation Index for Cross Ventilation Based on CFD Simulations and Ventilation Prediction Model Using Machine Learning Algorithms.” Procedia Engineering 205: 2948–2955. doi:10.1016/j.proeng.2017.10.112.
- Guo, F., P. S. Zhu, S. Y. Wang, D. W. Duan, and Y. Jin. 2017. “Improving Natural Ventilation Performance in A High-Density Urban District: A Building Morphology Method.” Procedia Engineering 205: 952–958. doi:10.1016/j.proeng.2017.10.149.
- Guo, W., X. Liu, and X. Yuan. 2015. “A Case Study on Optimization of Building Design Based on CFD Simulation Technology of Wind Environment.” Procedia Engineering 121: 225–231. doi:10.1016/j.proeng.2015.08.1060.
- Hang, J., Q. Wang, X. Y. Chen, M. Sandberg, W. Zhu, R. Buccolieri, and S. D. Sabatino 2015. “City Breathability in Medium Density Urban-like Geometries Evaluated through the Pollutant Transport Rate and the Net Escape Velocity”. Building and Environment 94: 166–182. 10.1016/j.buildenv.2015.08.002.
- Hang, J., and Y. Li. 2010. “Ventilation Strategy and Air Change Rates in Idealized High-rise Compact Urban Areas.” Building and Environment 45 (12): 2754–2767. doi:10.1016/j.buildenv.2010.06.004.
- Hang, J., Y. Li, M. Sandberg, R. Buccolieri, and S. Di Sabatino. 2012. “The Influence of Building Height Variability on Pollutant Dispersion and Pedestrian Ventilation in Idealized High-rise Urban Areas.” Building and Environment 56: 346–360. doi:10.1016/j.buildenv.2012.03.023.
- He, B. J., L. Ding, and D. Prasad. 2019. “Enhancing Urban Ventilation Performance through the Development of Precinct Ventilation Zones: A Case Study Based on the Greater Sydney, Australia.” Sustainable Cities and Society 47: 101472.
- Hong, B., and B. R. Lin. 2015. “Numerical Studies of the Outdoor Wind Environment and Thermal Comfort at Pedestrian Level in Housing Blocks with Different Building Layout Patterns and Trees Arrangement.” Renewable Energy 73: 18–27. doi:10.1016/j.renene.2014.05.060.
- Hou, C. P., J. W. Hou, Q. Kang, X. Meng, D. Wei, Z. Liu, and L. L. Zhang. 2018. “Research on Urban Park Design Combined with the Urban Ventilation System”. Energy Procedia 152: 1133–1138. 10.1016/j.egypro.2018.09.139.
- Hsieh, C., and H. Huang. 2016. “Mitigating Urban Heat Islands: A Method to Identify Potential Wind Corridor for Cooling and Ventilation.” Computers, Environment and Urban Systems 57: 130–143. doi:10.1016/j.compenvurbsys.2016.02.005.
- Javanroodi, K., M. Mahdavinejad, and M. V. Nik. 2018. “Impacts of Urban Morphology on Reducing Cooling Load and Increasing Ventilation Potential in Hot-arid Climate.” Applied Energy 231: 714–746. doi:10.1016/j.apenergy.2018.09.116.
- Kruger, E. L., F. O. Minella, and F. Rasia. 2011. “Impact of Urban Geometry on Outdoor Thermal Comfort and Air Quality from Field Measurements in Curitiba, Brazil.” Building and Environment 46 (3): 621–634. doi:10.1016/j.buildenv.2010.09.006.
- Kubilay, A., M. K. A. Neophytou, S. Matsentides, M. Loizou, and J. Carmeliet. 2017. “The Pollutant Removal Capacity of Urban Street Canyons as Quantified by the Pollutant Exchange Velocity.” Urban Climate 21: 136–153. doi:10.1016/j.uclim.2017.06.003.
- Lau, G. E., and K. Ngan. 2018. “Analysing Urban Ventilation in Building Arrays with the Age Spectrum and Mean Age of Pollutants.” Building and Environment 131: 288–305. doi:10.1016/j.buildenv.2018.01.010.
- Liu, C., D. Y. C. Leung, and M. C. Barth. 2005. “On the Prediction of Air and Pollutant Exchange Rates in Street Canyons of Different Aspect Ratios Using Large-eddy Simulation.” Atmospheric Environment 39 (9): 1567–1574.
- Liu, S. M., W. X. Pan, and Q. Cao. 2019. “CFD Simulations of Natural Cross Ventilation through an Apartment with Modified Hourly Wind Information from a Meteorological Station.” Energy and Buildings 195: 16–25. doi:10.1016/j.enbuild.2019.04.043.
- Luo, Y., J. H, and Y. N. 2017. “Analysis of Urban Ventilation Potential Using Rule-based Modeling.” Computers, Environment and Urban Systems 66: 13–22. doi:10.1016/j.compenvurbsys.2017.07.005.
- Lyu, T., R. Buccolieri, and Z. Gao. 2015. “A Numerical Study on the Correlation between Sky View Factor and Summer Microclimate of Local Climate Zones.” Atmosphere 10: 8.
- Marzena, W., W. Andreas, and O. S. Katarzyna. 2017. “Detection of Ventilation Corridors Using a Spatio-temporal Approach Aided by Remote Sensing Data.” European Journal of Remote Sensing 50 (01): 254–267. doi:10.1080/22797254.2017.1318672.
- Meerow, S., and J. P. Newell. 2017. “Spatial Planning for Multifunctional Green Infrastructure: Growing Resilience in Detroit.” Landscape and Urban Planning 159: 62–75. doi:10.1016/j.landurbplan.2016.10.005.
- Nazarian, N., and J. Kleissl. 2016. “Realistic Solar Heating in Urban Areas: Air Exchange and Street-canyon Ventilation.” Building and Environment 95: 75–93. doi:10.1016/j.buildenv.2015.08.021.
- Neophytou, M. K., and R. E. Britter. 2005. Modelling of Atmospheric Dispersion in Complex Urban Topographies: A Computational Fluid Dynamics Study of the Central London Area. 5th GRACM International Congress on Computational Mechanics. 2 967–974
- Pacifici, M., F. Rama, and M. K. R. de Castro. 2019. “Analysis of Temperature Variability within Outdoor Urban Spaces at Multiple Scales.” Urban Climate 27: 90–104. doi:10.1016/j.uclim.2018.11.003.
- Panagiotou, I., M. K. A. Neophytou, D. Hamlyn, and R. E. Britter. 2013. “City Breathability as Quantified by the Exchange Velocity and Its Spatial Variation in Real Inhomogeneous Urban Geometries: An Example from Central London Urban Area.” Science of the Total Environment 442: 466–477. doi:10.1016/j.scitotenv.2012.09.001.
- Peng, Y., X. Y. Ma, F. Y. Zhao, C. W. Liu, and S. J. Mei. 2017. “Wind Driven Natural Ventilation and Pollutant Dispersion in the Dense Street Canyons: Wind Opening Percentage and Its Effects.” Procedia Engineering 205: 415–422. doi:10.1016/j.proeng.2017.10.392.
- Qiao, Z., X. L. Xu, F. Wu, W. Luo, F. Wang, L. Luo, and Z. Y. Sun. 2017. “Urban Ventilation Network Model: A Case Study of the Core Zone of Capital Function in Beijing Metropolitan Area”. Journal of Cleaner Production 168: 526–535. 10.1016/j.jclepro.2017.09.006.
- Ramponi, R., B. Blocken, L. B. de Coo, and W. D. Janssen. 2015. “CFD Simulation of Outdoor Ventilation of Generic Urban Configurations with Different Urban Densities and Equal and Unequal Street Widths.” Building and Environment 92: 152–166. doi:10.1016/j.buildenv.2015.04.018.
- Razak, A. A., A. Hagishima, N. Ikegaya, and J. Tanimoto. 2013. “Analysis of Airflow over Building Arrays for Assessment of Urban Wind Environment.” Building and Environment 59: 56–65. doi:10.1016/j.buildenv.2012.08.007.
- Ren, C., R. Z. Yang, C. Cheng, P. Xing, X. Y. Fang, S. Zhang, H. F. Wang, Y. Shi, X. Y. Zhang, Y. T. Kwok, and E. Ng. 2018. “Creating Breathing Cities by Adopting Urban Ventilation Assessment and Wind Corridor Plan – The Implementation in Chinese Cities”. Journal of Wind Engineering and Industrial Aerodynamics 182: 170–188. doi:10.1016/j.jweia.2018.09.023.
- Ricci, A., M. Burlando, A. Freda, and M. P. Repetto. 2017. “Wind Tunnel Measurements of the Urban Boundary Layer Development over a Historical District in Italy.” Building and Environment 111: 192–206. doi:10.1016/j.buildenv.2016.10.016.
- Stewart, I. D., and T. R. Oke. 2012. “Local Climate Zones for Urban Temperature Studies.” Bulletin of the American Meteorological Society 93 (12): 1879–1900. doi:10.1175/BAMS-D-11-00019.1.
- Tong, Z. M., Y. Li, and D. Westerdahl. 2019. “Exploring the Effects of Ventilation Practices in Mitigating In-vehicle Exposure to Traffic-related Air Pollutants in China.” Environment International 127: 773–784. doi:10.1016/j.envint.2019.03.023.
- United Nations. 2014. World Urbanization Prospects: The 2014 Revision (Highlight). Department of Economic and Social Affairs.
- Vernay, D. G., B. Raphael, and F. C. Smith,lan. 2015. “Improving Simulation Predictions of Wind around Buildings Using Measurements through System Identification Techniques.” Building and Environment 94: 620–631. doi:10.1016/j.buildenv.2015.10.018.
- Wang, L. L., H. Wang, J. K. Liu, Z. Q. Gao, Y. J. Yang, X. Y. Zhang, Y. B. Li, and M. Huang. 2019. “Impacts of the Near-surface Urban Boundary Layer Structure on PM2.5 Concentrations in Beijing during Winter.” Science of the Total Environment 669: 493–504. doi:10.1016/j.scitotenv.2019.03.097.
- Wang, W. W., Y. Xu, E. Ng, and S. Raasch. 2018a. “Evaluation of Satellite-derived Building Height Extraction by CFD Simulations: A Case Study of Neighborhood-scale Ventilation in Hong Kong.” Landscape and Urban Planning 170: 90–102. doi:10.1016/j.landurbplan.2017.11.008.
- Wang, Z. X., C. Chen, Y. H. Yang, X. Y. Fang, and W. P. Du. 2018b. “Research on Urban Ventilation Channel Planning Strategy Which Based on Multivariate Date Analysis: Take Beijing Sub Center as an Example.” Urban Development Studies 25 (01): 87–96.
- Wen, C. Y., Y. H. Juan, and A. S. Yang. 2017. “Enhancement of City Breathability with Half Open Spaces in Ideal Urban Street Canyons.” Building and Environment 112: 322–336. doi:10.1016/j.buildenv.2016.11.048.
- Xiao, Y. Q., and S. Yin. 2017. “A Guidance of the Research on Regional Urban Design Based on Urban Climatology.” Urbanism and Architecture 01: 24–28.
- Yang, F., F. Qian, and S. S. Y. Lau. 2013. “Urban Form and Density as Indicators for Summertime Outdoor Ventilation Potential: A Case Study on High-rise Housing in Shanghai.” Building and Environment 70: 122–137. doi:10.1016/j.scs.2019.101487.
- Yang, J., S. H. Jin, X. M. Xiao, C. Jin, J. H. Xia, X. M. Li, and S. J. Wang. 2019. “Local Climate Zone Ventilation and Urban Land Surface Temperatures: Towards a Performance-based and Wind-sensitive Planning Proposal in Megacities.” Sustainable Cities and Society 47. 101487.
- Yin, C. H., M. Yuan, Y. P. Lu, and Y. F. Liu. 2018. “Effects of Urban Form on the Urban Heat Island Effect Based on Spatial Regression Model.” Science of the Total Environment 634: 696–704. doi:10.1016/j.scitotenv.2018.03.350.
- Yuan, C., C. Ren, and E. Ng. 2014. “GIS-based Surface Roughness Evaluation in the Urban Planning System to Improve the Wind Environment – A Study in Wuhan, China.” Urban Climate 10: 585–593. doi:10.1016/j.uclim.2014.06.005.
- Yuan, C., and E. Ng. 2014. “Practical Application of CFD on Environmentally Sensitive Architectural Design at High Density Cities: A Case Study in Hong Kong.” Urban Climate 8: 57–77. doi:10.1016/j.uclim.2013.12.001.
- Yuan, M., Y. Song, Y. Huang, H. Shen, and T. Li. 2019. “Exploring the Association between the Built Environment and Remotely Sensed PM2.5 Concentrations in Urban Areas.” Journal of Cleaner Production 220: 1014–1023. doi:10.1016/j.jclepro.2019.02.236.
- Yuan, Y., Z. Luo, J. Liu, Y. Wang, and Y. Lin. 2018. “Health and Economic Benefits of Building Ventilation Interventions for Reducing Indoor PM2.5 Exposure from Both Indoor and Outdoor Origins in Urban Beijing, China.” Science of the Total Environment 626: 546–554. doi:10.1016/j.scitotenv.2018.01.119.
- Zheng, Z. F., Y. X. Li, H. Wang, H. Y. Ding, Y. B. Li, Z. Q. Gao, and Y. J. Yang. 2019. “Re-evaluating the Variation in Trend of Haze Days in the Urban Areas of Beijing during a Recent 36-year Period.” Atmospheric Science Letters 20 (1), UNSP: e878. doi: 10.1002/asl.878.