
 ?Mathematical formulae have been encoded as MathML and are displayed in this HTML version using MathJax in order to improve their display. Uncheck the box to turn MathJax off. This feature requires Javascript. Click on a formula to zoom.
ABSTRACT
Ecological restoration measures implemented in China have profoundly impacted vegetation NPP. This study aimed to estimate the effects of the land conversion and management measures on the grassland ecosystem in semi-arid regions. Land use data were employed from 2000 to 2015 to compare land conversion and coverage changes in Xilingol grassland. Then, the contributions of land conversion and management policies were quantified by assessing the difference between actual NPP and climate-induced NPP changes. The results indicated that the grassland area had a net loss of 534.42 km2, and the net area of increased vegetation coverage was 74,683.05 km2. Furthermore, the total NPP increased by 8,010.73 Gg C·yr−1 (1 Gg = 109 g), of which the human activities, including grazing management measures (+6,809.40 Gg C·yr−1) and land conversion (45.72 Gg C·yr−1) contributed to 85.58% of the increase in NPP. Transformation from desert and farmland dominated grassland expansion and NPP increase, while urbanization and desertification caused large grassland reduction and NPP loss. The grazing management increased vegetation NPP in most regions except for some regions in the desert steppe and the farming-pastoral zone. Related policies should be further adjusted to strengthen the management of the desert steppe and farming-pastoral regions.
Introduction
Grasslands are one of the most widely distributed biomes in the world, making an important contribution to global food security and carbon balance (O’Mara Citation2012). However, due to rapid economic development and adverse climate change, approximately 16% of global pastures have been degraded (Gibbs and Salmon Citation2015; FAO Citation2010), while 90% of the available natural grasslands in china showed varying degrees of degradation; and grasslands considered severely and moderately degraded account for 50% of the total degraded area (Hu et al. Citation2017). Grassland degradation eventually made a decline in grassland ecosystem services, seriously threatening the production of livestock products and the country’s environmental security (Wang and Wesche Citation2016). Therefore, to reduce grassland degradation, the state has implemented diverse management measures since the early 2000 s, including the “Grain to Green Program” (GGP) (Dai Citation2010), the “Beijing and Tianjin Sandstorm Source Treatment Project” (BTSST) (Zhang et al. Citation2012) and the “Grazing Withdraw Program” (Lu et al. Citation2018a). The GGP aims to restore the degraded cultivated land by converting farmland on steep slopes or with low yields into forests or grasslands. The BTSST is intended to prevent soil erosion and stabilize moving sand dunes through planting shrubs and herbaceous plants. The GWP aims to protect grassland resources by implementing different degrees of grassland bans. Based on field measurements or remote sensing monitoring, numerous studies have reported that diverse management measures improved vegetation height, coverage, aboveground fresh biomass (Zhou et al. Citation2010; Deng et al. Citation2017; Yang et al. Citation2015), and strengthened ecosystem services (Tang et al. Citation2019; Lu et al. Citation2018b). However, these studies failed to separate the effects of climate change on grassland ecosystem from human activities effectively. Separating the impacts of human activities on grassland from climate change is very important for correctly assessing the effects of ecological restoration projects and improving subsequent management of grasslands.
Net primary productivity (NPP) is the net solar energy accumulated by vegetation per unit area and unit time. It is an important proxy of ecosystem function and carbon sequestration capacity (Jackson and Prince Citation2016). Actual NPP is the net solar energy accumulated by vegetation under the double influences of climatic conditions and anthropogenic activities, while potential NPP is the net energy fixed by vegetation, which is solely driven by climatic factors (Haberl et al. Citation2007). Various models have been widely developed to estimate NPP at multiple scales, which mainly including climate-based models (e.g., Miami model (Lieth Citation1975), Thornthwaite Memoria model (Lieth and Box Citation1972) and Zhou Guangsheng model (Zhou and Zhang Citation1996)), process-based models (e.g., TEM (McGuire et al. Citation1995), BIOME-BGC (Turner et al. Citation2016)) as well as light use efficiency models (e.g., CASA (Potter et al. Citation1993)). Due to the different mechanisms of the models, their applicability and accuracy differ on different scales. The climate-based models estimate the NPP by correlating climatic factors and dry matter production, which were generally used to estimate potential productivity on global or national scale (Adams, White, and Lenton Citation2004). The process-based models offer superior NPP accuracy in local scales by simulating ecosystem physiological and ecological process. However, these models have poor applicability, as numerous and complex input parameters are required and the data is sometimes difficult to obtain. The light use efficiency CASA model is driven by the photosynthetically active radiation absorbed by plants and the light energy utilization rate. It is widely used to estimate the NPP in broader scales due to fewer input parameters and the parameters’ accessibility via remote sensing (Dubovyk Citation2017).
In addition to being calculated easily through remote sensing, NPP is also sensitive to climate change and human activities. Therefore, NPP has been widely used to distinguish the relative contributions of climate change and human activities to NPP changes (Haberl et al. Citation2007; Zhou et al. Citation2017; Mu et al. Citation2013b). Usually, there are three approaches to solve this task. The first approach is to establish the linear relationship between a vegetation index representing vegetation productivity and precipitation to distinguish the effects of climate change from other factors (Evans and Geerken Citation2004; Wessels et al. Citation2007). However, the indicator was empirical and dramatic variation in precipitation reduced the reliability of the results. Another method is to quantify the effects of human activities on vegetation NPP through the difference between potential and actual NPP (Zhou et al. Citation2017; O’Neill, Tyedmers, and Beazley Citation2006). In this method, potential NPP was mainly calculated through climate-based models, which were applicable to large-scale regions. In addition, the two methods distinguished the impacts of climate change on NPP under the assumption that land use types remain unchanged. Actually, land use and cover have changed significantly over time, which have greatly affected the earth’s land surface and vegetation NPP (Lu et al. Citation2010; Milesi et al. Citation2003; Li et al. Citation2018). Therefore, the impacts of land use and cover change on NPP could not be ignored. The third approach is the scenario simulation method, which estimated the effect of climate change or human activities through the difference between actual NPP and the NPP under a simulated constant climate or human activity (Wu et al. Citation2014; Yang, Mu, and Li Citation2014). This method is suitable for research on multiple scales based on the same model. It can also reflect the impact of land use and cover change on NPP due to different parameter settings. However, most research focused on the economic-developed regions, fewer studies have been carried out in semi-arid grassland, where land use and cover change under ecological restoration policies strongly affect regional NPP. Therefore, it is essential to understand how climate change, land use change, and management measures affect NPP in semi-arid grassland. The resulting data could be used to optimize regional grassland ecosystem management.
As the globally typical semi-arid temperate grassland, Xilingol grassland is an important area for livestock production and also one of China’s large coal-electricity bases, providing strong support for regional economic development (Fu et al. Citation2016). In addition, it is an important ecological buffer region that protects the northern regions of China from sandstorms (Hao et al. Citation2017). Xilingol grassland inevitably experienced severe grassland degradation due to the irrational utilization of land and overgrazing. According to reports, the degradation, desertification, and salinization of Xilingol grassland had reached up to 72% of the total grassland area (Yan Citation2014). In view of the special geographical location and fragile ecological conditions, the Xilingol grassland was listed as a priority area for the implementation of ecological restoration programs and it also belongs to a major control region of the BTSST Project (Liu et al. Citation2017). Taking Xilingol grassland as study region, this study aims to: (1) understand the spatial and temporal changes of land use and cover and NPP in semi-arid grassland; (2) on a small scale, distinguish the impact of climate change and human activities (including land conversion and management measures) on regional NPP in semi-arid grassland. The results of this study will help the land managers to understand the current situation of grassland, and to adjust and optimize future management policies in the semi-arid grassland of China.
Materials and methods
Study area
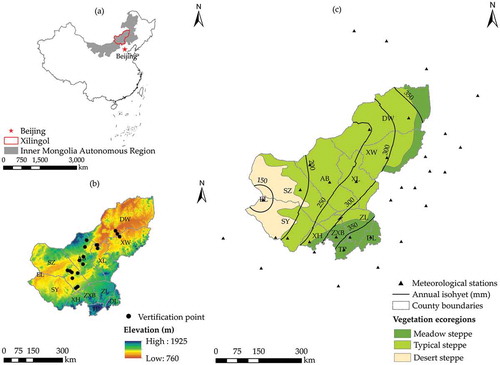
Xilingol is located between 42°32′-46°41′N and 111°59′-120°00′E, in the center of the Inner Mongolia Autonomous Region in China ()). The grassland covers 197,000 km2, accounting for 97% of the total area (Chi et al. Citation2018). The elevation ranges from 760 to 1925 m, and the terrain is dominated by high plains, with a variety of landforms ()). Xilingol is characterized by a semi-arid continental climate, with an annual average temperature of 2.2°C (varying between 0 and 3°C), and an annual total precipitation of 278 mm (ranging between 150 and 400 mm). The annual total precipitation gradually decreases from east to west, decreasing from more than 350 mm to less than 200 mm ()). Due to the uneven distribution of precipitation, the vegetation gradually changes from meadow steppe in the east, to typical steppe in the middle, and desert steppe in the west ()). The other obvious gradient is the transition of agro-pastoral in the south to animal husbandry areas in the north (Batunacun et al. Citation2018).
To reduce grazing pressure, different degrees of implementation of grassland bans have been launched in Xilingol grassland since 2001: full grazing bans on severely degraded grassland, initiating delaying grazing and grazing rotation on degraded and slightly degraded grassland, and rearing livestock in sheds (Batunacun et al. Citation2018). Furthermore, Xilingol has implemented the Grassland Ecological Compensation Policy (GECP), which divided the grassland into either a grazing ban zone or a forage–livestock balance zone according to its grassland condition and used subsidies to motivate herders to comply with these measures (Hu, Huang, and Hou Citation2019).
Figure 1. Location of the Xilingol grassland (a). Elevation of the Xilingol grassland and distributions of the field verification sites (b); Distribution of meteorological stations, annual precipitation, and its vegetation types (c). DW, Dongwuzhumuqin Banner; XW, Xiwuzhumuqin Banner; XL, Xilinhot; AB, Abaga Banner; SZ, Sunitezuo Banner; SY, Suniteyou Banner; EL, Erlianhot; XH, Xianghuang Banner; ZXB, Zhengxiangbai Banner; ZL, Zhenglan Banner; DL, Duolun
Data source and processing
Land cover data
The land use data from 2000, 2005, 2010, and 2015 originated from the Data Center for Resources and Environmental Sciences, Chinese Academy of Sciences. These land-use datasets exhibit a spatial resolution of 100 m and were established by the human-computer interactive interpretation method using the remotely sensed land-use/cover information with an overall accuracy of 94.3% (Liu et al. Citation2014). The land was reclassified into woodland, grassland, waterbodies, developed land, desert, wetland, bare land, and cropland. Due to limited data, we assumed that the land use remained relatively consistent and unchanged for 5 years increments. The NPP estimations of 2000–2002, 2003–2007, 2008–2012, and 2013–2015 were based on the land cover data of 2000, 2005, 2010, and 2015, respectively.
NDVI data
The normalized difference vegetation index (NDVI) is an important input parameter for the calculation of NPP using the Carnegie-Ames-Stanford Approach (CASA) model. The NDVI data was obtained from the National Aeronautics and Space Administration’s (NASA) MOD13Q1 dataset, which consists of MODIS-derived vegetation indices with a 16-day temporal resolution and 250 m spatial resolution (https://lpdaac.usgs.gov/data_access/data_pool). The monthly NDVI data was generated from the 16-day NDVI data, using the maximum-value composite method.
Meteorological data
The daily meteorological data (temperature, precipitation, atmospheric pressure, wind speed, humidity, and sunshine hours) were derived from 34 national meteorological stations. The missing values of precipitation data were set directly to 0, while the missing values in other meteorological data were replaced by the mean value of nearly 2 days before and after the missing data. Then, these processed data were calculated as monthly data and were interpolated by the ordinary kriging method to derive monthly raster data.
Statistical data
All the statistical data, including road construction, proportion of urban population (%), coal production (tons), livestock number (heads), structure, livestock sheds and corrals (m2), and fenced grassland (km2) was derived from the Xilingol Statistical Yearbook (2000–2015). The dynamic changes in livestock numbers, livestock sheds, and corrals were determined in each county by ordinary least squares regression and spatialized in units of administrative regions.
Methods
Vegetation coverage change
Fractional vegetation coverage (FVC) is the vertical-projected area of vegetation on the ground per unit area, which is a key proxy of grassland status. FVC was calculated as
where NDVImin is the minimum NDVI corresponding to 0% vegetation cover or bare soil, and NDVImax is the maximum NDVI corresponding to 100% vegetation cover.
Estimation of actual NPP
The CASA model, a light use efficiency model driven by data from remote sensing, meteorology, and vegetation type was used to estimate the actual NPP. The actual NPP was calculated as (Potter et al. Citation1993).
where x is the spatial position, t is the time, and APAR (x, t) is the photosynthetically active radiation absorbed by pixel x at month t; ε(x, t) represents the actual light-use efficiency of pixel x in month t. APAR(x, t) and ε(x, t) were calculated as follows:
where SOL(x, t) is the total solar radiation of pixel x in month t; FPAR(x, t) is the fraction of photosynthetically active radiation; and 0.5 is the proportion of total solar radiation available for vegetation. A more detailed description of these parameters is reported in Zhu et al., 2006 (Zhu et al. Citation2006).
Tε1(x, t) and Tε2(x, t) are temperature stress coefficients that reflect the restriction from the very low and very high temperature on the light-use efficiency, respectively; Wε(x, t) is the moisture stress coefficient. A more detailed description of Tε1(x, t), Tε2(x, t), and Wε(x, t) is available in Chi et al., 2018 and Yu et al., 2011 (Chi et al. Citation2018; Yu et al. Citation2011); εmax is the vegetation’s maximum light-use efficiency under ideal conditions and, in this study, was set at 0.542 for grassland (Zhu et al. Citation2006).
Validation of actual NPP
To verify the estimation accuracy of the CASA model, we used NPP values for grassland vegetation under study in July 2014. Eighteen field samples were randomly arranged on the Xilingol grassland, after which five random, 1 m × 1 m samples from each plot were collected. The five samples’ mean aboveground biomass was calculated for each site. The belowground biomass was calculated through the ratio of belowground to aboveground biomass (Mokany, Raison, and Prokushkin Citation2006). Next, we converted the observed biomass of each plot to NPP by multiplying carbon conversion coefficient (0.475). The correlation analysis between the observed NPP data and the estimated NPP value was strong and significant (R2 = 0.78, p < 0.001) ().
Figure 2. Correlation between estimated NPP and observed NPP in Xilingol grassland in July 2014
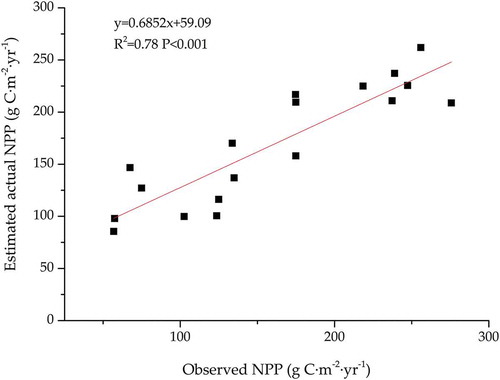
The calculated NPP was in accordance with that of Chi et al. (Chi et al. Citation2018), who estimated the NPP based on the same data and model for Xilingol grassland and found that the mean NPP varied between 134 and 269 g C·m−2·yr−1 from 2001 to 2014. Results of Zhang et al. (Zhang et al. Citation2017) and Zhao (Zhao Citation2015) suggested the annual mean NPP was 240 g C·m−2·yr−1 and 161.23 g C·m−2·yr−1, respectively. The NPP in different grassland types was also comparable to similar previous studies of Pan et al. (Pan et al. Citation2018), who suggested that NPP of meadows, typical and desert grasslands in Inner Mongolia was 358.97 g C·m−2·yr−1, 237.17 g C·m−2·yr−1 and 127.77 g C·m−2·yr−1, respectively. In our study, the mean NPP in the entire grassland varied between 156.20 and 273.67 g C·m−2·yr−1 from 2000 to 2015, with annual average of 204.55 g C·m−2·yr−1. The NPP of the three grassland types was 334.55 g C·m−2·yr−1, 205.15 g C·m−2·yr−1 and 99.89 g C·m−2·yr−1, respectively. Therefore, we concluded that our NPP estimation was in a reasonable range under the current data source and error control conditions, which can support research on NPP changes in the Xilingol grassland.
Contribution of land conversion, and management policies to NPP changes
Changes in grassland NPP were mainly driven by climate variability and anthropogenic activities. We used the scenario simulation method to separate the impact of climate change on NPP from human activities. In this method, NPP values were again estimated by the CASA model under the assumption of changing climate and constant vegetation. However, in most studies, vegetation index was assumed to be constant during study periods, which were failed to reflect the inter-annual fluctuations and spatial differences in vegetation index (Wu et al. Citation2014; Zhang et al. Citation2014). In our study, we removed the trend changes in the monthly NDVI data to remain its inter-annual fluctuations. The simulated NPP changes in this scenario refer to climate-induced NPP. The formula is expressed as follows:
where is the NDVI in month i of the j-th year after removing the trend;
is the actual NDVI in month i of j-th year; and k is the slope of actual NDVI of the i-th month by the least square method. All calculations were performed at the pixel scale.
The impacts of anthropogenic activities on NPP can be determined by calculating the difference between the total changes of actual NPP and climate-induced NPP. Land use conversion and management measures are the two main forms of anthropogenic activities. We distinguished the impacts of land use change and management measures on NPP by categorizing the grassland change from 2000 to 2015 as newly expanded grassland, disappeared grassland, and unchanged grassland.
Newly added grassland: areas that were not grassland in 2000 but were classified as grassland in 2015.
Disappeared grassland: areas that were grassland in 2000 and were converted into other land types by 2015.
Unchanged grassland: areas that remained grassland from 2000 to 2015.
This method for distinguishing the impacts of human activities and climate variation is more thoroughly described in Mu et al., 2013 and Gang et al., 2018 (Mu et al. Citation2013a; Gang et al. Citation2018). The detailed processing flow was shown in .
In our study, the year 2000 was chosen as the baseline. According to the subdivision of grassland conversion, the total NPP of grassland in 2000 (NPP2000) can be divided into two parts: NPP of unchanged grassland in 2000 (NPPunch_00) and the NPP of the disappeared grassland (NPPloss).
Similarly, the total NPP of grassland in 2015 (NPP2015) also included two parts: NPP of unchanged grassland in 2015 (NPPunch_15) and NPP of newly expanded grassland (NPPgain).
Human activities induced NPP change mainly include NPP changes caused by land use conversion (NPPlc) and grazing management measures (NPPma). NPPlc is the NPP changes in newly expanded grassland resulting from land conversion. It was calculated by subtracting NPP losses of the disappeared grassland (NPPloss) from NPP gains of newly expanded grassland (NPPgain), and removing NPP changes caused by climate change on newly added grassland (NPPclimate1).
In addition, NPPma is the NPP generated by human management measures in the unchanged grassland. It was calculated by subtracting NPP of the unchanged grassland ( and climate-induced changes (NPPclimate2) in the unchanged grassland, both in 2000, from the 2015 value (
.
Figure 3. Processing flows for distinguishing the contribution of land conversion, grazing management, and climate variation to changes in NPP
Inter-annual dynamic analysis
The time-series changing trend of climate factors was determined using ordinary least square regression (Mund et al. Citation2010). The slope is expressed as follows:
where n is the number of study years; and i is the year from 1 to n. Ai represents the annual total precipitation value in time of i year. This formula is also used to calculate the dynamic changes of the average temperature, annual livestock, livestock sheds, and corrals in each county.
Results
Spatial pattern and coverage change of the grassland
Land use has significantly changed in Xilingol over the past 16 years (). Developed land, desert land, and bare land increased, which increased by 599.14 km2, 467.48 km2 and 160.08 km2, respectively. Woodland slightly increased by 29.26 km2. In contrast, waterbodies and wetland decreased significantly during this period, shrinking by 352.92 km2 (19.82%) and 198.52 km2 (3.48%), respectively. Cropland had a slight reduction of 170.10 km2.
Table 1. Area of land use change in Xilingol from 2000 to 2015. (unit: km2)
Grassland, the main land use type body in Xilingol, depicted a slight net reduction of 534.42 km2 from 2000 to 2015, with a gain of 1,658.91 km2 and a loss of 2,193.33 km2 (). The newly expanded grassland was dominated by conversion of desert land to grassland, which contributed 48.89% of the total gain. These regions were mainly concentrated in sandy areas such as Abaga, Zhenglan, Duolun, Suniteyou, and Sunitezuo Banner ()). The conversion of cropland and bare land to grassland accounted for 22.04% and 11.11% of the total expanded area, respectively. However, the grassland loss mostly occurred in Zhengxiangbai, Sunitezuo, Suniteyou, and Abaga Banner, which was dominated by the conversion of grassland to the desert land, and accounted for 42.59% of the lost grassland’s total area ()). Developed land and bare land accounted for 23.93% and 15.87% of the lost grassland’s total, respectively. Urbanization mainly expanded around the center of the cities. Bare land was distributed in Xilinhot, Dongwuzhumuqin Banner, and Abaga Banner ()).
Figure 4. Spatial distribution of gains and losses in the Xilingol grassland between 2000 and 2015
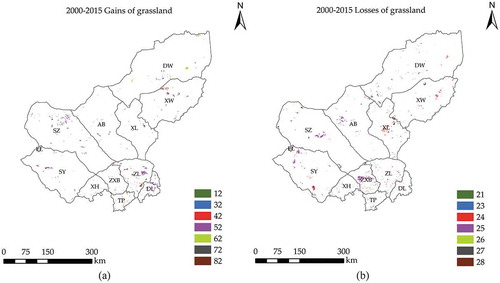
Table 2. Gains and losses in the Xilingol grassland from 2000 to 2015
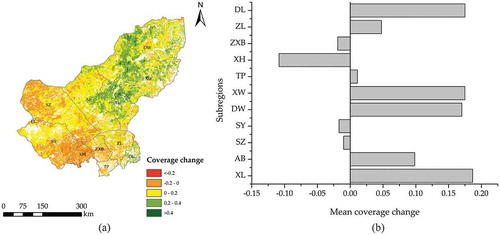
Although grassland area was lost, vegetation coverage in unchanged grassland regions increased and the average vegetation coverage increased from 31.8% in 2000 to 40.0% in 2015 (Figure 5(a)). However, there was spatial difference in vegetation coverage change of unchanged grassland. Specifically, the regions with evident coverage increase were concentrated in the center and north of Xilingol grassland, with a total area of 121,084.71 km2. The regions with an area of 46,401.66 km2 exhibited reduced vegetation coverage, which was primarily located in the southwest of the Xilingol grassland (). The coverage of Sunitezuo, Suniteyou, Zhengxiangbai, and Xianghuang Banner decreased, while the coverage increased in other sub-regions (). The largest decrease and increase values in coverage change were −10.85% in Xianghuang Banner and 18.66% in Xilinhot, respectively.
Figure 5. (a) Spatial distribution of coverage change in unchanged grassland from 2000 to 2015 and (b) coverage change in eleven administrative sub-regions
Grassland NPP changes from 2000 to 2015
From 2000 to 2015, the actual NPP depicted an overall increasing trend with an annual increase of 2.94 g C·m−2·yr−1. The climate-induced NPP also showed an increasing trend with a small annual increase of 0.095 g C·m−2·yr−1 (). With respect to spatial distribution, the actual NPP increased in most areas of the Xilingol grassland, except in some parts of the southwest and south (). The total NPP of the Xilingol grassland in 2015 and 2000 was 38,139.99 Gg C·yr−1 (1 Gg = 109 g) and 30,129.33 Gg C·yr−1, respectively. Thus, the total NPP increased by 26.58% (). The mean NPP of unchanged grassland increased by 47.44 g C·m−2·yr−1 from 2000 to 2015, resulting in an increased total NPP of 7,945.55 Gg C·yr−1. In addition, the net increase of grassland NPP from land use conversion accounted for 0.81% of the total NPP increment (). The newly expanded grassland with mean NPP of 244.33 g C·m−2·yr−1, contributed 405.32 Gg C·yr−1 to the total increased NPP, most of which was attributed to the conversion of desert land and cropland to grassland. However, the disappeared grassland with mean NPP of 155.10 g C·m−2·yr−1, caused a total NPP loss of 340.20 Gg C·yr−1 over the same time period. The transformation from grassland to desert and developed land dominated the grassland’s total NPP loss.
Figure 6. (a) Inter-annual variations in annual average actual NPP and climate-induced NPP in the Xilingol grassland from 2000 to 2015; (b) Actual NPP change of Xilingol grassland between 2000 and 2015
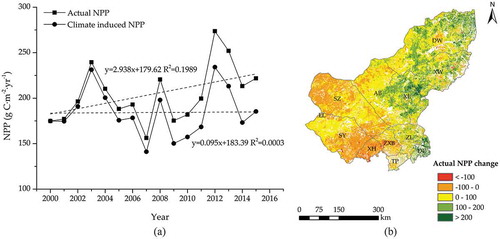
Table 3. NPP changes caused by different forms of grassland conversion between 2000 and 2015
The contribution of climate change, land conversion, and management policies to NPP changes
When evaluating the entire Xilingol grassland (XLG), human activities played a more important role in NPP change than climate variation. The human activities including grazing management measures (+6,809.40 Gg C·yr−1) and land conversion (45.72 Gg C·yr−1) contributed to 85.58% of the increase in NPP. Climate change contributed to the NPP increase by 20.50 and 1135.11 Gg C·yr−1 in the newly added and unchanged grassland, respectively. Management measures in unchanged grassland promoted NPP increase in all sub-regions, varying from 18.85 to 1112.42 Gg C·yr−1 (). Grassland conversion promoted NPP increase in other sub-regions except for Xilinhot, Zhengxiangbai, Suniteyou, Abaga, and Xianghuang Banner. Specifically, the highest NPP loss induced by grassland converted-out occurred in Zhengxiangbai Banner (−65.21 Gg C·yr−1), the lowest NPP loss was in Duolun (−6.31 Gg C·yr−1), while the highest NPP gains induced by newly added grassland after eliminating climate change were in Zhenglan Banner (92.15 Gg C·yr−1), the lowest was in Xianghuang Banner (5.39 Gg C·yr−1) (). In addition, climate change in newly added grassland and unchanged grassland promoted NPP increase in most sub-regions except for Sunitezuo, Suniteyou, Xianghuang, and Zhengxiangbai Banner.
Figure 7. The contribution of land conversion to total NPP changes in the sub-regions between 2000 and 2015
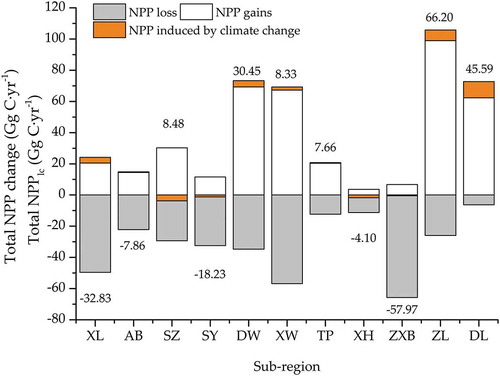
Table 4. Quantitative analysis of the contributions of climate variation and human activities to NPP changes in the Xilingol grassland between 2000 and 2015
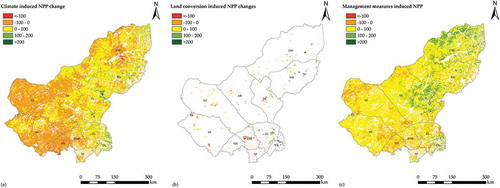
Spatially, climate variation helped increase NPP in eastern regions, but facilitated an NPP decrease in most southwestern and southern regions (). Due to expanded grassland, the NPP increase was mainly distributed in the farming-pastoral zone in the southeast and some regions of the Dongwuzhumuqin Banner; while NPP loss, due to occupied grassland, was spread across Xilinhot, Suniteyou, and Zhengxiangbai Banner (). Areas showing increased NPP due to grazing management measures were concentrated in the central and north areas of Xilingol, and were limited in some regions the southwest and south region ().
Figure 8. (a) Spatial distribution of NPP changes induced by climate variation, (b) land conversion and (c) management measures in the Xilingol grassland between 2000 and 2015 (Unit: g C·m−2·yr−1)
Discussion
Impact of climate change on NPP
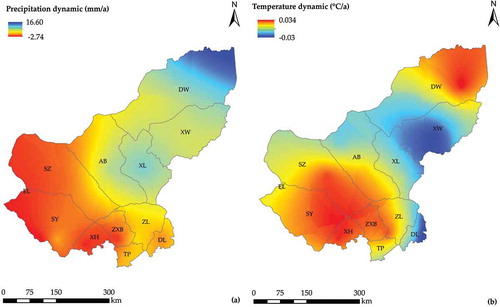
The entire Xilingol grassland experienced a wetter and hotter climate during the study periods, with annual increase of 4.81 mm and 0.0087°C in the annual precipitation and average temperature, respectively. However, this trend varied based on regions. The annual total precipitation increased in most regions except for the southwestern and southern regions ()). The average temperature increased in the northeastern and southern regions, while decreased in the center and southeast ()). In arid and semi-arid regions, precipitation is the dominant climatic factor that affects the vegetation and NPP (Zhang et al. Citation2017; Sun et al. Citation2015). The increasing precipitation and decreasing temperature reduce the plants’ evaporation potential, and thereby maintain high soil moisture leading to increased NPP. Our study found that the climate change induced an increase NPP of 1155.61 Gg C·yr−1 (). To verify our results, we also used the climate data in 2000 to simulate the NPP of Xilingol in 2015 assuming that the meteorological conditions in 2000 remain unchanged into 2015. The simulation result showed the total NPP of Xilingol was 35539.05 Gg C·yr−1, which was 2600.93 Gg C·yr−1 lower than the actual value in 2015. These results indicated that climate change was beneficial to the NPP increase in the entire Xilingol grassland from 2000 to 2015. However, it is worth noting that the adverse climate change in the southwest and south has led to NPP decline.
Figure 9. Spatial changes in precipitation and temperature in Xilingol grassland from 2000 to 2015
Impact of land conversion on NPP
Land use change that a primary form of human activity significantly affects the grassland NPP. In order to address grassland degradation, Xilingol implemented several ecological restoration projects, including the GGP and the BTSST, which resulted in significant land use and land cover changes (Uchida, Xu, and Rozelle Citation2005). According to the reports from the BTSST, by the end of 2015, measures such as artificial afforestation, aerial sowing afforestation, sand-fixing, and returning farmland to grassland reduced the flow and semi-fixed sand by 705,300 hm2. Many studies have shown that these policies have effectively promoted the expansion of grassland and woodland with high ecological value, enhancing biomass C stocks (Mu et al. Citation2013a; Yin et al. Citation2018). In Xilingol, the newly added grasslands were dominated by the transformation of desert and farmland in the Hunshandake Sandy and the farming-pastoral regions in the south, increasing grassland NPP by 283.49 Gg C·yr−1. These improvements were possibly the result of efforts by projects, such as GGP and BBTS.
Although ecological measures promoted grassland expansion and NPP increase, Xilingol grassland experienced severe grassland reduction and NPP loss. The conversion of grassland to desert and bare land was the main cause of NPP loss, reducing grassland area of 1282.19 km2 and NPP loss of 196.43 Gg C·yr−1. These adverse transformations were mainly distributed in the desert steppe and the farming-pastoral regions, which could be caused by the relatively drier climate condition and the extensive animal husbandry production pattern. Affected by the brand Sunite sheep in the desert steppe and the high-intensity land use of agriculture-nomad in the farming-pastoral zone, respectively, combined with the harsh natural conditions, the grassland with low and sparse vegetation in these regions gradually degraded into desert land and bare land, which in turn led to vegetation NPP loss. In addition, grassland encroachment by the built-up land was another factor causing NPP loss, which concentrated in the junction of towns and grassland. Xilingol has experienced rapid urbanization development during the study periods. Rapid urbanization will be concomitant with an enormous infrastructure boom in road construction, energy, and transport, and buildings (Seto, Gueneralp, and Hutyra Citation2012). The proportion of the urban population increased rapidly as well as the road construction in Xilingol grassland ()). The mining industry grew into an important industry and development priority (Fu et al. Citation2016) and coal production showed exponential growth from 2000 to 2015 ()). Rapid urbanization can significantly reduce vegetation NPP due to the transformation of land from productive natural vegetation to low-productivity built-up land (Wu et al. Citation2014; Seto, Gueneralp, and Hutyra Citation2012). The results of Milesi et al. (Milesi et al. Citation2003) showed that land cover changes due to urban development reduced the annual NPP in the southeastern United States by 0.4% between 1992 and 2000. Therefore, grassland expansion induced by the ecological restoration projects did improve vegetation NPP, while the grassland desertification and encroachment remain the main ecological issues in Xilingol grassland, causing severe grassland reduction and NPP loss.
Figure 10. Changes of urbanization, road construction (a) and coal production (b) in Xilingol from 2000 to 2015
Impact of management policies on NPP
Overgrazing is considered to be the main cause of grassland degradation and decline in vegetation NPP (Schoenbach et al. Citation2011). Diverse management measures aimed at reducing grazing pressures were implemented in Xilingol grassland. According to the data from the Xilingol Statistical Yearbook (2000–2015), the number of livestock decreased obviously in most regions () and the area occupied by livestock sheds and corrals increased in all regions (). Such figures imply that grazing pressures reduced and the grassland use pattern was shifting from freely grazing to indoor feeding. Livestock structures were optimized by increasing large livestock (such as cows, horses, and donkeys) and decreasing small livestock (e.g., goats) (). Meanwhile, the area of cumulated fenced grassland rapidly increased from 2000 to 2015 (). Seasonal rest grazing has been widely implemented in Xilingol grassland since 2001, 88% of the total grassland area was fenced off to allow the grass to grow in the spring (Mu et al. Citation2013a). These diverse grazing managements released grazing pressures and extended the time for the grass to recover to improve vegetation community structure and vegetation productivity. Numerous studies proved that these grazing management measures were effective in restoring vegetation and increasing vegetation NPP (Mu et al. Citation2013a; Deng, Zhang, and Shangguan Citation2014; Wang et al. Citation2016). The results reported by Liu et al. (Liu et al. Citation2017) suggested that grazing exclusion in Xilingol grassland increased the biomass, vegetation height, and vegetation coverage by 77.31 g/m2,14.83 cm and 17.5%, respectively, compared to free grazing lands. Li et al. (Li et al. Citation2013) reported that spring grazing can effectively restore and renew grassland vegetation, biomass and organic carbon storages of plant communities increased with increased rest grazing durations. Our study found the total vegetation NPP increase by 6,809.40 Gg C·yr−1 in unchanged grassland after eliminating the effects of climatic factor. It indicated that grazing management was the dominant driving force for vegetation NPP increase in Xilingol grassland.
Figure 11. (a) Spatial pattern of the livestock number trends in the Xilingol grassland from 2000 to 2015, (b) Spatial pattern of livestock sheds and corrals; Inter-annual variation in livestock structure (c) and fenced grassland area (d)
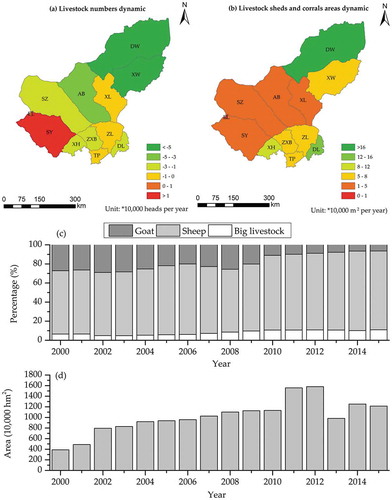
However, grazing management measures had negative effects in some regions of the desert steppe in the southwest and the farming-pastoral zone in the south (). The desert steppe and the farming-pastoral zone are severely degraded and difficult to control. Although the amount of livestock declined, most regions still have overload problems. The result of Surina et al. suggested that the desert steppe in Inner Mongolia was overgrazed in 2011–2013 with an overload rate of 75.92%, 57.53%, and 57.38%, respectively (Surina et al. Citation2017). As grazing exclusion in the severely degraded regions, the grazing pressures were shifted to other regions, causing new-degraded grassland with reduced vegetation coverage and decline in NPP. Therefore, optimal grassland management should be customized based on the conditions of each region. In the desert steppe and the farming-pastoral zone, management grazing pressure should be further released and grazing bans should be implemented to allow grass to recover naturally.
Admittedly, some weakness existed in our research. We simplified the responses of grassland to climate and human activities as a linear relationship and ignored the impacts of other factors, such as soil organic matter, grassland fire, aphids and rodents, species invasion, and the accuracy of the remote sensing data used in the NPP estimate models. These omissions result in some uncertainty in the results. Nonetheless, this study provides new insight into understanding the impacts of human activities on semi-arid grassland.
Conclusions
Land conversion and management policies have a profound impact on the spatial pattern of grassland distribution and NPP in semi-arid grassland. In our study, we assessed land conversion, vegetation coverage, and NPP changes in Xilingol grassland from 2000 to 2015 and then quantified the contributions of climate change and anthropogenic activities (including land conversion and management policies) to NPP changes. The results showed that:
The grassland area had a net loss of 534.42 km2, with a gain of 1,658.91 km2 and a loss of 2,193.33 km2 from 2000 to 2015. Transformation from desert and cropland contributed major portions to grassland expansion, while urbanization and desertification caused large areas of grassland losses.
Although grassland area was lost, vegetation coverage in unchanged grassland improved with an increase by 8.2% between 2000 and 2015. The net area of improved vegetation coverage was 74,683.05 km2, with an area of increased and decreased vegetation coverage of 121,084.7 km2 and 46,401.66 km2, respectively.
The total NPP increased by 8,010.73 Gg C·yr−1 between 2000 and 2015. Human activities, including grazing management measures (6,809.40 Gg C·yr−1) and land conversion (45.72 Gg C·yr−1) contributed to 85.58% of the increase in NPP. Grassland expansion induced total NPP increase of 384.82 Gg C·yr−1, which induced by the transformation of desert and farmland. Grassland reduction caused total NPP loss of 340.20 Gg C·yr−1, which dominated by conversion from grassland to desert land and built-up land. The grassland management increased the vegetation NPP in most regions except for some regions in the desert steppe and the farming-pastoral zone.
In general, human activities under the ecological restoration measures have indeed played a positive role in grassland expansion and NPP increases in semi-arid grassland. However, grassland encroachment and desertification remain the main ecological issues and the management measures had negative effects on some regions in the desert steppe and the farming-pastoral regions. Related policies should be further adjusted to focus on the desert steppe and farming-pastoral zone in semi-arid grassland. To support this, future research needs to explore in greater detail the driving factors of the observed processes and patterns in vulnerable areas of desert steppe and farming-pastoral ecotone, enabling us to better understand these regions, thereby improving the integrated management in semi-arid grassland.
Author contributions
Conceptualization, G.W. and F.C.; Methodology, F.C.; Data curation and formal analysis, F.C. and X.F.; Resources, X.F.; Writing—original draft preparation, F.C.; Writing—review and editing, G.W., J.L. and X.F.; visualization, F.C.; funding acquisition, G.W.
Disclosure statement
The authors declare no conflict of interest.
Additional information
Funding
References
- Adams, B., A. White, and T. M. Lenton. 2004. “An Analysis of Some Diverse Approaches to Modelling Terrestrial Net Primary Productivity.” Ecological Modelling 177 (3–4): 353–16. doi:10.1016/j.ecolmodel.2004.03.014.
- Batunacun, C. Nendel, Y. Hu, and T. Lakes. 2018. “Land-use Change and Land Degradation on the Mongolian Plateau from 1975 to 2015-A Case Study from Xilingol, China.” Land Degradation & Development 29 (6): 1595–1606. doi:10.1002/ldr.2948.
- Chi, D., H. Wang, X. Li, H. Liu, and X. Li. 2018. “Assessing the Effects of Grazing on Variations of Vegetation NPP in the Xilingol Grassland, China, Using a Grazing Pressure Index.” Ecological Indicators 88: 372–383. doi:10.1016/j.ecolind.2018.01.051.
- Dai, Z. 2010. “Intensive Agropastoralism: Dryland Degradation, the Grain-to-Green Program and Islands of Sustainability in the Mu Us Sandy Land of China.” Agriculture Ecosystems & Environment 138 (3–4): 249–256. doi:10.1016/j.agee.2010.05.006.
- Deng, L., Z.-P. Shangguan, G.-L. Wu, and X.-F. Chang. 2017. “Effects of Grazing Exclusion on Carbon Sequestration in China’s Grassland.” Earth-Science Reviews 173: 84–95. doi:10.1016/j.earscirev.2017.08.008.
- Deng, L., Z. Zhang, and Z. Shangguan. 2014. “Long-term Fencing Effects on Plant Diversity and Soil Properties in China.” Soil & Tillage Research 137: 7–15. doi:10.1016/j.still.2013.11.002.
- Dubovyk, O. 2017. “The Role of Remote Sensing in Land Degradation Assessments: Opportunities and Challenges.” European Journal of Remote Sensing 50 (1): 601–613. doi:10.1080/22797254.2017.1378926.
- Evans, J., and R. Geerken. 2004. “Discrimination between Climate and Human-induced Dryland Degradation.” Journal of Arid Environments 57 (4): 535–554. doi:10.1016/s0140-1963(03)00121-6.
- FAO. Challenges and opportunities for carbon sequestration in grassland systems. A technical report on grassland management and climate change mitigation. Rome Food and Agricultural Organization 2010.
- Fu, X., M. Ma, P. Jiang, and Y. Quan. 2016. “Spatiotemporal Vegetation Dynamics and Their Influence Factors at a Large Coal-fired Power Plant in Xilinhot, Inner Mongolia.” International Journal of Sustainable Development & World Ecology 24 (5): 433–438. doi:10.1080/13504509.2016.1273265.
- Gang, C., W. Zhao, T. Zhao, Y. Zhang, X. Gao, and Z. Wen. 2018. “The Impacts of Land Conversion and Management Measures on the Grassland Net Primary Productivity over the Loess Plateau, Northern China.” Science of the Total Environment 645: 827–836. doi:10.1016/j.scitotenv.2018.07.161.
- Gibbs, H. K., and J. M. Salmon. 2015. “Mapping the World’s Degraded Lands.” Applied Geography 57: 12–21. doi:10.1016/j.apgeog.2014.11.024.
- Haberl, H., K. H. Erb, F. Krausmann, V. Gaube, A. Bondeau, C. Plutzar, S. Gingrich, W. Lucht, and M. Fischer-Kowalski. 2007. “Quantifying and Mapping the Human Appropriation of Net Primary Production in Earth’s Terrestrial Ecosystems.” Proceedings of the National Academy of Sciences of the United States of America 104 (31): 12942–12947. doi:10.1073/pnas.0704243104.
- Hao, R., D. Yu, Y. Liu, Y. Liu, J. Qiao, X. Wang, and J. Du. 2017. “Impacts of Changes in Climate and Landscape Pattern on Ecosystem Services.” Science of the Total Environment 579: 718–728. doi:10.1016/j.scitotenv.2016.11.036.
- Hu, Y., Y. Han, Y. Zhang, and Y. Zhuang. 2017. “Extraction and Dynamic Spatial-Temporal Changes of Grassland Deterioration Research Hot Regions in China.” Journal of Resources and Ecology 8 (4): 352–358. doi:10.5814/j..1674-764x.2017.04.006.
- Hu, Y., J. Huang, and L. Hou. 2019. “Impacts of the Grassland Ecological Compensation Policy on Household Livestock Production in China: An Empirical Study in Inner Mongolia.” Ecological Economics 161: 248–256. doi:10.1016/j.ecolecon.2019.03.014.
- Jackson, H., and S. D. Prince. 2016. “Degradation of Net Primary Production in a Semiarid Rangeland.” Biogeosciences 13 (16): 4721–4734. doi:10.5194/bg-13-4721-2016.
- Li, J., Z. L. Wang, C. G. Lai, X. Q. Wu, Z. Y. Zeng, X. H. Chen, and Y. Q. Lian. 2018. “Response of Net Primary Production to Land Use and Land Cover Change in Mainland China since the Late 1980s.” Science of the Total Environment 639: 237–247. doi:10.1016/j.scitotenv.2018.05.155.
- Li, Y., X. Song, W. Xiu, G. Zhang, H. Liu, J. Zhao, and D. Yang. 2013. “Effects of Spring Rest Grazing on Organic Carbon Storage in Leymus Chinensis Steppe in Inner Mongolia, China.” Journal of Agro-Environment Science 32: 2221–2230.
- Lieth, H. 1975. “Modeling the Primary Production of the World.” In Primary Productivity of the Biosphere, edited by H. Lieth and R. H. Whittaker, 237–263. Vol. 14. Berlin, Germany: Springer.
- Lieth, H., and E. Box. 1972. “Evapotranspiration and Primary Productivity.” Publications in Climatology 25: 37–46.
- Liu, J., W. Kuang, Z. Zhang, X. Xu, Y. Qin, J. Ning, W. Zhou, et al. 2014. “Spatiotemporal Characteristics, Patterns, and Causes of Land-use Changes in China since the Late 1980s.” Journal of Geographical Sciences 24 (2): 195–210. doi:10.1007/s11442-014-1082-6.
- Liu, J., J. Wu, H. Su, Z. Gao, and Z. Wu. 2017. “Effects of Grazing Exclusion in Xilin Gol Grassland Differ between Regions.” Ecological Engineering 99: 271–281. doi:10.1016/j.ecoleng.2016.11.041.
- Lu, D., X. Xu, H. Tian, E. Moran, M. Zhao, and S. Running. 2010. “The Effects of Urbanization on Net Primary Productivity in Southeastern China.” Environmental Management 46 (3): 404–410. doi:10.1007/s00267-010-9542-y.
- Lu, F., H. Hu, W. Sun, J. Zhu, G. Liu, W. Zhou, Q. Zhang, et al. 2018a. “Effects of National Ecological Restoration Projects on Carbon Sequestration in China from 2001 to 2010.” Proceedings of the National Academy of Sciences of the United States of America 115 (16): 4039–4044. doi:10.1073/pnas.1700294115.
- Lu, F., H. F. Hu, W. J. Sun, J. J. Zhu, G. B. Liu, W. M. Zhou, Q. F. Zhang, et al. 2018b. “Effects of National Ecological Restoration Projects on Carbon Sequestration in China from 2001 to 2010.” Proceedings of the National Academy of Sciences of the United States of America 115 (16): 4039–4044. doi:10.1073/pnas.1700294115.
- McGuire, A. D., J. M. Melillo, D. W. Kicklighter, and L. A. Joyce. 1995. “Equilibrium Responses of Soil Carbon to Climate Change: Empirical and Process-based Estimates.” Journal of Biogeography 22 (4/5): 785–796. doi:10.2307/2845980.
- Milesi, C., C. D. Elvidge, R. R. Nemani, and S. W. Running. 2003. “Assessing the Impact of Urban Land Development on Net Primary Productivity in the Southeastern United States.” Remote Sensing of Environment 86 (3): 401–410. doi:10.1016/s0034-4257(03)00081-6.
- Mokany, K., R. J. Raison, and A. S. Prokushkin. 2006. “Critical Analysis of Root: Shoot Ratios in Terrestrial Biomes.” Global Change Biology 12 (1): 84–96. doi:10.1111/j.1365-2486.2005.001043.x.
- Mu, S., S. Zhou, Y. Chen, J. Li, W. Ju, and I. O. A. Odeh. 2013a. “Assessing the Impact of Restoration-induced Land Conversion and Management Alternatives on Net Primary Productivity in Inner Mongolian Grassland, China.” Global and Planetary Change 108: 29–41. doi:10.1016/j.gloplacha.2013.06.007.
- Mu, S. J., Y. Z. Chen, J. L. Li, W. M. Ju, I. O. A. Odeh, and X. L. Zou. 2013b. “Grassland Dynamics in Response to Climate Change and Human Activities in Inner Mongolia, China between 1985 and 2009.” The Rangeland Journal 35 (3): 315–329. doi:10.1071/rj12042.
- Mund, M., W. L. Kutsch, C. Wirth, T. Kahl, A. Knohl, M. V. Skomarkova, and E. D. Schulze. 2010. “The Influence of Climate and Fructification on the Inter-annual Variability of Stem Growth and Net Primary Productivity in an Old-growth, Mixed Beech Forest.” Tree Physiology 30 (6): 689–704. doi:10.1093/treephys/tpq027.
- O’Mara, F. P. 2012. “The Role of Grasslands in Food Security and Climate Change.” Annals of Botany 110 (6): 1263–1270. doi:10.1093/aob/mcs209.
- O’Neill, D. W., P. H. Tyedmers, and K. F. Beazley. 2006. “Human Appropriation of Net Primary Production (HANPP) in Nova Scotia, Canada.” Regional Environmental Change 7 (1): 1–14. doi:10.1007/s10113-006-0021-1.
- Pan, M., J. Liang, J. Li, Q. Jiang, and N. C. Temporal. 2018. “Spatial Pattern of Temperate Steppe NPP in Inner Mongolia.” Journal of Northwest Forestry University 33: 233–240.
- Potter, C. S., J. T. Randerson, C. B. Field, P. A. Matson, P. M. Vitousek, H. A. Mooney, and S. A. Klooster. 1993. “Terrestrial Ecosystem Production_ a Process Model Based on Global Satellite and Surface Data.” Global Biogeochemical Cycle 7 (4): 811–841. doi:10.1029/93GB02725.
- Schoenbach, P., H. Wan, M. Gierus, Y. Bai, K. Mueller, L. Lin, A. Susenbeth, and F. Taube. 2011. “Grassland Responses to Grazing: Effects of Grazing Intensity and Management System in an Inner Mongolian Steppe Ecosystem.” Plant and Soil 340 (1–2): 103–115. doi:10.1007/s11104-010-0366-6.
- Seto, K. C., B. Gueneralp, and L. R. Hutyra. 2012. “Global Forecasts of Urban Expansion to 2030 and Direct Impacts on Biodiversity and Carbon Pools.” Proceedings of the National Academy of Sciences of the United States of America 109 (40): 16083–16088. doi:10.1073/pnas.1211658109.
- Sun, W., X. Song, X. Mu, P. Gao, F. Wang, and G. Zhao. 2015. “Spatiotemporal Vegetation Cover Variations Associated with Climate Change and Ecological Restoration in the Loess Plateau.” Agricultural and Forest Meteorology 209: 87–99. doi:10.1016/j.agrformet.2015.05.002.
- Surina, Z., H. Jin, W. Z. Chaolumengqiqige, N. Chamuha, and J. LI. 2017. “Changes in Grassland Productivity and Livestock Carrying Capacity in Inner Mongolia.” Ecology and Environmental Sciences 26: 605–612.
- Tang, Y., Q. Shao, J. Liu, H. Zhang, F. Yang, W. Cao, D. Wu, and G. Gong. 2019. “Did Ecological Restoration Hit Its Mark? Monitoring and Assessing Ecological Changes in the Grain for Green Program Region Using Multi-source Satellite Images.” Remote Sensing 11 (3): 358. doi:10.3390/rs11030358.
- Turner, D. P., W. D. Ritts, R. E. Kennedy, A. N. Gray, and Z. Yang. 2016. “Regional Carbon Cycle Responses to 25 years of Variation in Climate and Disturbance in the US Pacific Northwest.” Regional Environmental Change 16 (8): 2345–2355. doi:10.1007/s10113-016-0956-9.
- Uchida, E., J. T. Xu, and S. Rozelle. 2005. “Grain for Green: Cost-effectiveness and Sustainability of China’s Conservation Set-aside Program.” Land Economics 81 (2): 247–264. doi:10.3368/le.81.2.247.
- Wang, K., L. Deng, Z. Ren, J. Li, and Z. Shangguan. 2016. “Grazing Exclusion Significantly Improves Grassland Ecosystem C and N Pools in a Desert Steppe of Northwest China.” Catena 137: 441–448. doi:10.1016/j.catena.2015.10.018.
- Wang, Y., and K. Wesche. 2016. “Vegetation and Soil Responses to Livestock Grazing in Central Asian Grasslands: A Review of Chinese Literature.” Biodiversity and Conservation 25 (12): 2401–2420. doi:10.1007/s10531-015-1034-1.
- Wessels, K. J., S. D. Prince, J. Malherbe, J. Small, P. E. Frost, and D. VanZyl. 2007. “Can Human-induced Land Degradation Be Distinguished from the Effects of Rainfall Variability? A Case Study in South Africa.” Journal of Arid Environments 68 (2): 271–297. doi:10.1016/j.jaridenv.2006.05.015.
- Wu, S., S. Zhou, D. Chen, Z. Wei, L. Dai, and X. Li. 2014. “Determining the Contributions of Urbanisation and Climate Change to NPP Variations over the Last Decade in the Yangtze River Delta, China.” Science of the Total Environment 472: 397–406. doi:10.1016/j.scitotenv.2013.10.128.
- Yan, Z. 2014. “The Problem and Control Strategy on the Degeneration, Desertification of Xilingol Grassland, Inner Mongolia.” Grassland And Prataculture 26: 8–11.
- Yang, H., S. Mu, and J. Li. 2014. “Effects of Ecological Restoration Projects on Land Use and Land Cover Change and Its Influences on Territorial NPP in Xinjiang, China.” Catena 115: 85–95. doi:10.1016/j.catena.2013.11.020.
- Yang, X., B. Xu, Y. Jin, Z. Qin, H. Ma, J. Li, F. Zhao, S. Chen, and X. Zhu. 2015. “Remote Sensing Monitoring of Grassland Vegetation Growth in the Beijing-Tianjin Sandstorm Source Project Area from 2000 to 2010.” Ecological Indicators 51: 244–251. doi:10.1016/j.ecolind.2014.04.044.
- Yin, H., D. Pflugmacher, A. Li, Z. Li, and P. Hostert. 2018. “Land Use and Land Cover Change in Inner Mongolia - Understanding the Effects of China’s Re-vegetation Programs.” Remote Sensing of Environment 204: 918–930. doi:10.1016/j.rse.2017.08.030.
- Yu, D. Y., P. J. Shi, G. Y. Han, W. Q. Zhu, S. Q. Du, and B. Xun. 2011. “Forest Ecosystem Restoration Due to a National Conservation Plan in China.” Ecological Engineering 37 (9): 1387–1397. doi:10.1016/j.ecoleng.2011.03.011.
- Zhang, G. L., J. W. Dong, X. M. Xiao, Z. M. Hu, and S. Sheldon. 2012. “Effectiveness of Ecological Restoration Projects in Horqin Sandy Land, China Based on SPOT-VGT NDVI Data.” Ecological Engineering 38 (1): 20–29. doi:10.1016/j.ecoleng.2011.09.005.
- Zhang, S., R. Zhang, T. Liu, X. Song, and M. A. Adams. 2017. “Empirical and Model-based Estimates of Spatial and Temporal Variations in Net Primary Productivity in Semi-arid Grasslands of Northern China.” PloS One 12. doi:10.1371/journal.pone.0187678.
- Zhang, Y., C. Song, K. Zhang, X. Cheng, L. E. Band, and Q. Zhang. 2014. “Effects of Land Use/land Cover and Climate Changes on Terrestrial Net Primary Productivity in the Yangtze River Basin, China, from 2001 to 2010.” Journal of Geophysical Research-Biogeosciences 119 (6): 1092–1109. doi:10.1002/2014jg002616.
- Zhao, F. “Remote Sensing Estimation and Validation of Net Primary Production in the Xilingol Grassland Based on CASA Model”. Master Dissertation. Chinese academy of agricultural sciences, China 2015 (In chinese).
- Zhou, G., and X. Zhang. 1996. “Study on NPP of Natural Vegetation in China under Global Climate Change.” Acta Phytoecologica Sinica 20: 11–19.
- Zhou, W., H. Yang, L. Huang, C. Chen, X. Lin, Z. Hu, and J. Li. 2017. “Grassland Degradation Remote Sensing Monitoring and Driving Factors Quantitative Assessment in China from 1982 to 2010.” Ecological Indicators 83: 303–313. doi:10.1016/j.ecolind.2017.08.019.
- Zhou, Z., F. Li, S. Chen, H. Zhang, and G. Li. 2010. “Dynamics of Vegetation and Soil Carbon and Nitrogen Accumulation over 26 Years under Controlled Grazing in a Desert Shrubland.” Plant and Soil 341 (1–2): 257–268. doi:10.1007/s11104-010-0641-6.
- Zhu, W., Y. Pan, H. He, D. Yu, and H. Hu. 2006. “Simulation of Maximum Light Use Efficiency for Some Typical Vegetation Types in China.” Chinese Science Bulletin 51 (4): 457–463. doi:10.1007/s11434-006-0457-1.