
ABSTRACT
Introduction: Daily maximum (Tmax) and minimum (Tmin) temperatures and Diurnal temperature range (DTR) profoundly affect the ecological environment and socioeconomic systems. In this study, we project future changes in Tmax, Tmin and DTR for RCP4.5 and RCP8.5 using fine-resolution downscaled data from the 18global coupled models over the main regions of the Belt and Road Initiative (BRI).
Outcomes: The Multi-Model Ensemble (MME) mean projections show that future warming is stronger in Tmax than in Tmin, leading to the increased DTR over central and southern Europe, many areas surrounding the Black Sea and the Caspian Sea, and southeastern China. By contrast, the DTR is projected to decline over the regions north of 55°N and other some areas due to the more rapid increase in Tmin than in Tmax. As a whole, the diurnal asymmetry of projected future temperature changes is found to mainly occur from November to March.
Conclusions: Our findings contribute to the knowledgebase on climate change over the main BRI regions. Regarding uneven spatiotemporal changes in Tmax, Tmin and DTR, appropriate climate change adaptation strategies, and options should be adopted to reduce or avoid disadvantaged consequences to the natural system and human society over specific regions.
Introduction
Surface air temperature changes affect natural ecosystem and biodiversity, agriculture and water resource, the economy, and human health and well-being (Coumou and Rahmstorf Citation2012; WMO Citation2013, Citation2019; Peng et al. Citation2013; Yang et al. Citation2013; IPCC Citation2014, Citation2018; King, Karoly, and Henley Citation2017; Watts et al. Citation2018; Zhang et al. Citation2018, Citation2019a). Compared to the daily mean surface air temperature, much less attention has been paid to the diurnal temperature range (DTR), which reflects the difference between daily maximum (Tmax) and minimum (Tmin) temperatures (DTR = Tmax – Tmin) (Karl et al. Citation1991; Easterling et al. Citation1997). Tmax is largely determined by the solar radiation reaching the land surface, whereas Tmin is closely associated with nighttime longwave radiation (Dai, Genio, and Fung Citation1997; Zhang and Wang Citation2008).
Over the past several decades, the nighttime Tmin is found to have warmed up more rapidly than the daytime Tmax, leading to a decrease in the DTR (Weber, Talkner, and Stefanicki Citation1994; IPCC, Citation2014; Davy et al. Citation2017; Sun et al. Citation2019). Multi-model simulations can generally capture the observed strong increases in Tmax and Tmin (Lobell, Bonfils, and Duffy Citation2007; Zhou et al. Citation2009). Additionally, they also showed asymmetrical warming in the diurnal temperature cycle, yet largely underestimated the magnitude of the observed decreasing trend in the DTR (Stone and Weaver Citation2002; Braganza, Karoly, and Arblaster Citation2004; Zhou et al. Citation2009). Changes in Tmax, Tmin, and DTR can be influenced by land surface conditions, cloud cover, precipitation, aerosols, greenhouse gas emissions, and other natural and anthropogenic factors (Dai, Trenberth, and Karl Citation1999; Roy, Robert, and Balling Citation2005; Zhang and Wang Citation2008; Zhang, Wang, and Wu Citation2009; Wu, Zhang, and Dong Citation2011; Tang and Leng Citation2012; Hua and Chen Citation2013; Wang et al. Citation2013).
Future changes in Tmax, Tmin and DTR urgently need to be better understood as they provide vital scientific information for adapting to temperature changes and effectively managing the related disaster risks. In this study, we use the statistically downscaled data for 18 global coupled models at a fine resolution of 0.25° to investigate the projected changes in Tmax, Tmin and DTR over the main regions of the Belt and Road Initiative (BRI) in the next 20 years (2020–2039) and the late 21st century (2080–2099) for the Representative Concentration Pathway (RCP) 4.5 and RCP8.5 relative to the historical period 1986–2005. These downscaled model data were taken for the NEX-GDDP dataset of the National Aeronautics and Space Administration (NASA), and the Multi-Model Ensemble (MME) approach was adopted to reduce the uncertainties in the projected temperature changes. We firstly evaluate how well the MME mean results can simulate the observed Tmax, Tmin and DTR for the historical period 1986–2005. Then, the temperature changes in two future periods for RCP4.5 and RCP8.5 are estimated according to MME mean projections. Finally, we summarize the main conclusions.
Data and methods
The monthly observed temperature data were obtained from the Climatic Research Unit (CRU) high-resolution gridded dataset Version 4.03 (CRU TS4.03) (Harris et al. Citation2014). The CRU TS4.03 data were generated at a resolution of 0.5° based on historical records worldwide for the period of 1901–2018. The daily 0.25°×0.25° statistically downscaled Tmax and Tmin data from 21 global couple models of CMIP5 were taken from NASA’s NEX-GDDP dataset (https://cds.nccs.nasa.gov/nex-gddp/). Taking into consideration the availability and reliability of the downscaled Tmax and Tmin data for all three study periods of 1986–2005, 2020–2039, and 2080–2099, we adopted 18 of 21 global models which include BCC-CSM1-1, BNU-ESM, CanESM2, CCSM4, CESM1-BGC, CNRM-CM5, CSIRO-Mk3-6-0, GFDL-ESM2G, GFDL-ESM2M, Inmcm4, IPSL-CM5A-LR, IPSL-CM5A-MR, MIROC-ESM-CHEM, MIROC5, MPI-ESM-LR, MPI-ESM-MR, MRI-CGCM3, NorESM1-M (http://cmip-pcmdi.llnl.gov/cmip5/[2013-05-15]). 1986–2005 is used as the historical baseline period, and projected changes focus on the next 20 years (2020–2039) and the late 21st century (2080–2099) under the RCP4.5 and RCP8.5 pathways.
The Bias-Correction and Spatial Disaggregation method (BCSD) was adopted by the NEX-GDDP of NASA to downscale the original model data at coarse resolutions from 18 global models to 0.25°×0.25° grid cells. The BCSD method was carried out by the following steps (Thrasher et al. Citation2012). First, the observational temperature and precipitation data at a resolution of 0.25°×0.25° from the Global Meteorological Forcing Dataset (GMFD) were regridded onto the same resolution as the global model based on area weighting. Second, to correct model deviation, the cumulative distribution function (CDF) of GMFD observational data for the period of 1950–2005 on each grid point was adopted to modify the CDF of each global model in history and under two future emission pathways of RCP4.5 and RCP8.5. Third, the bilinear interpolation was employed to interpolate “scaling factors” calculated by the bias-corrected global model daily data and the GMFD observational data to 0.25° fine-resolution GMFD grid points. The downscaling global climate model data were then obtained with the interpolated scaling factors based on the fine-resolution GMFD climatological values. It should be noted that the BCSD method does not correct and adjust the trend of variables.
Using the CRU observations, we evaluate the 18-member MME mean simulations in three temperature change indicators for the historical period over the main BRI regions. Then, the 18-member MME mean projections are employed to estimate future changes in Tmax, Tmin and DTR over the main BRI regions in the two future periods for RCP4.5 and RCP8.5 relative to the historical period. Finally, we analyze the annual cycles of future changes in Tmax, Tmin and DTR averaged over the main BRI regions and two selected key regions. In this study, the standard deviations of the downscaled data from 18 models are calculated to represent the model uncertainties of the projected changes in Tmax, Tmin and DTR, and the statistical significances of the future temperature changes are assessed by Student’s t-test.
Evaluation of MME mean simulations for the historical period
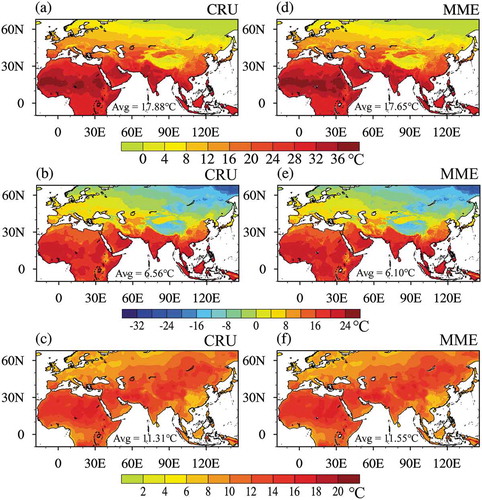
displays the spatial distributions for 1986–2005 mean Tmax, Tmin and DTR in the main BRI regions for the CRU observations and MME mean simulations. The MME mean is calculated using the statistically downscaled data from 18 global coupled models. The spatial patterns of the 18-member MME mean simulations are in good agreement with those of the CRU observations for Tmax, Tmin and DTR over the historical period. Both the CRU observations and the 18-member mean simulation results show that, except for the Qinghai-Tibet Plateau, Tmax and Tmin generally decrease from low to high latitudes with the highest values occurring over the region from the western Sahara desert to the Arabian Peninsula, South Asia, and Southeast Asia (,,d,e)). The high DTR values mainly appear over the region from the Sahara desert through West and central Asia to the eastern part of North Asia in both the observations and the MME mean simulations (,)).
Figure 1. Spatial distribution of 1986–2005 mean Tmax (1st row), Tmin (2nd row) and DTR (3rd row) in the main BRI regions for the CRU observations (left panel) and MME mean simulations (right panel) (unit: °C). MME mean simulations are calculated using statistically downscaled data for 18 global coupled models
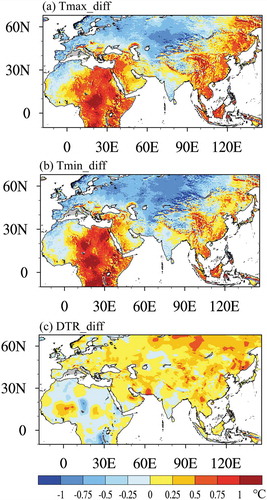
Compared with the CRU observations, the 18-member mean simulations generally overestimate Tmax and Tmin over most of northern Africa, western part of West Asia, northeastern Asia, East Asia, and Southeast Asia with the maximum warm bias exceeding 1°C (,)). Cold biases are mainly found in Europe, western and central parts of North Asia, central Asia, and South Asia. For the DTR, the MME mean simulations generally have positive biases over the main BRI regions except for northern Africa ()).
Figure 2. Spatial distribution of the temperature differences in the main BRI regions between the MME mean simulations and the CRU observations (unit: °C):: (a) Tmax; (b) Tmin; and (c) DTR. MME mean simulations are calculated using statistically downscaled data for 18 global coupled models
Averaged over the main BRI regions, the 1986–2005 mean Tmax, Tmin and DTR values for the simulations are very close to those of the CRU observations. The 18-member MME mean Tmax, Tmin and DTR are 17.65°C, 6.10°C, and 11.55°C, respectively, and the CRU-observed values are 17.88°C, 6.56°C, and 11.31°C, respectively. These results indicate that the 18-member MME mean simulations can capture well-observed spatial structures and area-averaged values of the 1986–2005 mean Tmax, Tmin and DTR in the main BRI regions. Therefore, the downscaled data from the 18 global coupled models can be used to further analyze the future change characteristics of Tmax, Tmin and DTR in the main BRI regions under the RCP4.5 and RCP8.5 emission scenarios.
MME mean projections of future temperature changes
The 18-member MME mean projections show that Tmax and Tmin will significantly and consistently increase in the main BRI regions in the next 20 years and the late 21st century for RCP4.5 and RCP8.5 with regard to the historical period ( and ). The spatial characteristics of projected Tmax and Tmin changes are similar with larger increases at higher latitude in two future periods for two emission pathways.
Figure 3. MME mean projected changes of Tmax in the next 20 years (2020–2039) and the late 21st century (2080–2099) with regard to the historical period for RCP4.5 (left panel) and RCP8.5 (right panel) over the main BRI regions. The slash areas are significant at the 95% confidence level
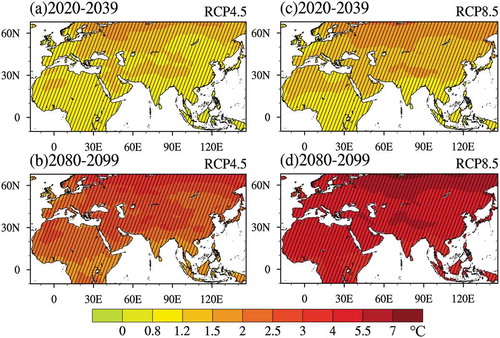
Figure 4. Same as Figure 3 but for Tmin.
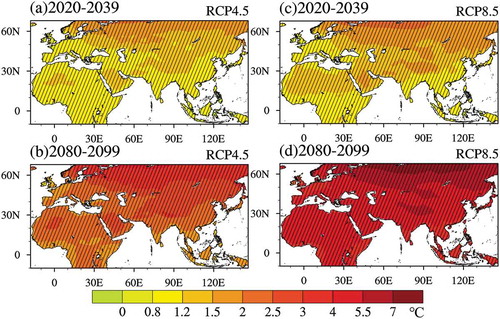
There are asymmetric increases in Tmax and Tmin over different areas of the main BRI regions according to MME mean projections. In each future period under two emission scenarios, the DTR is projected to significantly increase over central and southern Europe, many areas surrounding the Black Sea and the Caspian Sea, and southeastern China as the warming in Tmax is more rapid than that in Tmin (). By contrast, the significantly decreased DTR is expected to appear over the regions north of 55°N and other some areas resulting from the larger increase in Tmin than in Tmax (). The DTR changes are projected to be strongest by the late 21st century for RCP8.5 in the main BRI regions.
Figure 5. Same as Figure 3 but for the DTR. The green and black boxes in Figure 5(d) indicate the two selected key regions
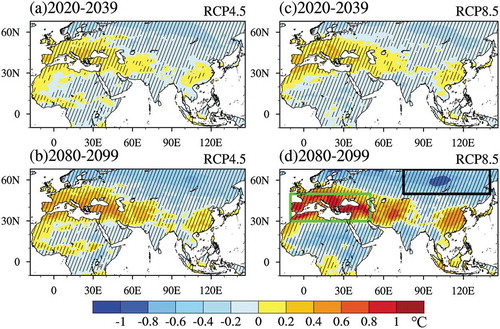
Land surface conditions, cloud cover, aerosols, and many other factors can influence Tmax, Tmin, and DTR, and their roles vary with region (e.g., Dai, Genio, and Fung Citation1997; Roy, Robert, and Balling Citation2005; Wu, Zhang, and Dong Citation2011; Wang et al. Citation2013; Sun et al. Citation2019). For example, over the region from central and southern Europe to the areas surrounding the Black Sea and the Caspian Sea, MME projections demonstrated that surface air temperature will significantly increase while precipitation will decrease or have small changes, resulting in drier soil conditions in the future (Zhang et al. Citation2019a, Citation2019b). Dry soils may induce more strong increases in Tmax than in Tmin, leading to the larger DTR in this region (Zhang, Wang, and Wu Citation2009; Seneviratne et al. Citation2010). The complex physical processes explaining for DTR changes over the main BRI regions are subject to further investigations in the future.
We further calculate the Tmax, Tmin and DTR values averaged over the main BRI regions and the two selected key regions including the Mediterranean and Black Sea region and North Asia ( and ). The Mediterranean and Black Sea region is defined as the region extending from 30°N to 50°N and from 10°W to 50°E (enclosed by the green box in )), and the region of 50°N − 68°N, 75°E − 140°E is defined as North Asia (enclosed by the black box in )). Averaged over the main BRI regions, Tmax and Tmin are projected to significantly increase in the next 20 years and the late 21st century relative to 1986–2005 for RCP4.5 and RCP8.5. The regional average Tmax and Tmin incremental values are 1.14°C and 1.20°C in the next 20 years, and 2.46°C and 2.54°C in the late 21st century under the RCP4.5 emission scenario (). For RCP8.5, the increases in Tmax and Tmin are larger with magnitudes of 1.33°C and 1.38°C in the next 20 years, and 4.92°C and 5.03°C in he late 21st century (). Averaged over the whole main BRI regions, the increases in Tmax are of slightly smaller magnitudes than those in Tmin, leading to the decreased DTR ()).
Figure 6. MME mean projected changes of Tmax (left panel) and Tmin (right panel) averaged over the main BRI regions, the Mediterranean and Black Sea region and North Asia in the next 20 years and the late 21st century with regard to the historical period for RCP4.5 and RCP8.5 (unit: °C). ★ represents that MME mean projected change is significant at the 99% confidence level. The error bar indicates ±one standard deviation among the 18 global coupled models
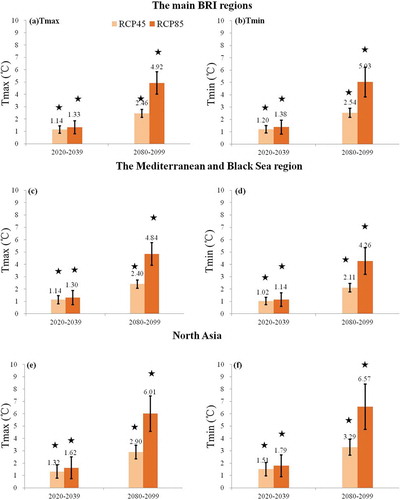
Figure 7. Same as Figure 6 but for the DTR. ▲ represents that MME mean projected change is significant at the 95% confidence level. The error bar denotes ±one standard deviation for the 18 global coupled models
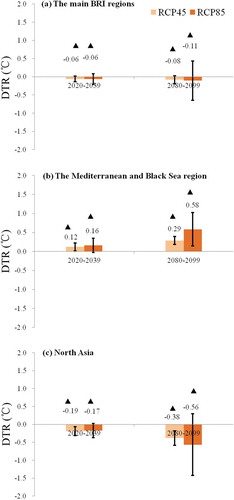
Averaged over the Mediterranean and Black Sea region and North Asia, there are obvious asymmetric warmings in the projected Tmax and Tmin in the two future periods for RCP4.5 and RCP8.5 (). In the Mediterranean and Black Sea region, Tmax and Tmin are projected to rise remarkably by 1.14°C and 1.02°C in the next 20 years, and 2.40°C and 2.11°C in the late 21st century under the RCP4.5 emission scenario. For RCP8.5, the warmings in Tmax and Tmin are stronger with the increments of 1.30°C and 1.14°C in the next 20 years and 4.84°C and 4.26°C in the late 21st century. The more rapid increase in Tmax than in Tmin, result in the significantly increased DTR in the two future periods for RCP4.5 and RCP8.5 over the Mediterranean and Black Sea region ( and )). The increased magnitudes of the DTR are 0.12°C and 0.16°C in the next 20 years, and 0.29°C and 0.58°C in the late 21st century for RCP4.5 and RCP8.5.
By contrast, the DTR in North Asia is projected to significantly decrease due to the greater warming in Tmin than in Tmax ( and )). For RCP4.5 and RCP8.5, Tmax will increase by 1.32°C and 1.62°C in the next 20 years and by 2.90°C and 6.01°C in the late 21st century ()), and Tmin will increase by 1.51°C and 1.79°C in the next 20 years and by 3.29°C and 6.57°C in the late 21st century ()). As a result, the DTR will decrease significantly by −0.19°C and -0.17°C in the next 20 years, and -0.38°C and −0.56°C in the late 21st century for RCP4.5 and RCP8.5 ()).
We also calculate the standard deviation among the 18 downscaled models to represent the uncertainty of the future projections. The results indicate that under the same emission scenario, the model standard deviations in the next 20 years for Tmax, Tmin and DTR are less than those in the late 21st century. The model standard deviations are larger under the RCP8.5 scenario than those under the RCP4.5 scenario in the same future period.
We finally analyze the annual cycles of future Tmax, Tmin and DTR changes averaged over the main BRI regions and two selected key regions under the RCP4.5 and RCP8.5 scenarios (–). Compared with the historical period, regional average results over the main BRI regions and two selected key regions show that there are notable increases in Tmax and Tmin from January to December both in the next 20 years and the late 21st century for two emission scenarios ( and ). Regardless of RCP 4.5 or RCP 8.5, the increases in Tmax and Tmin from January to December in the late 21st century are much greater than those in the next 20 years. In the same future period, the warmings for RCP 8.5 are larger than those for RCP 4.5.
Figure 8. The monthly values of Tmax, Tmin and DTR for the historical period, the future 20 years and the late 21st century (left panel) for RCP4.5 and RCP8.5 averaged over the main BRI regions and the differences between the two future periods (2020–2039 and 2080–2099) and the historical period (right panel)
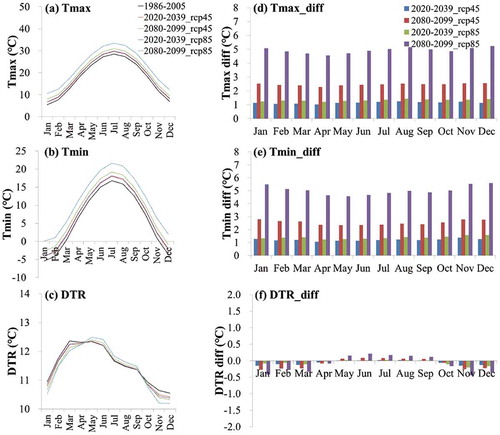
Figure 9. Same as Figure 8 but for the Mediterranean and Black Sea region as enclosed by the green box in Figure 5(d)
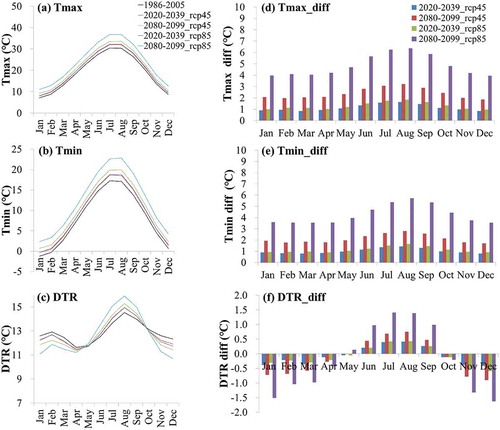
Figure 10. Same as Figure 8 but for North Asia as enclosed by the black box in Figure 5(d)
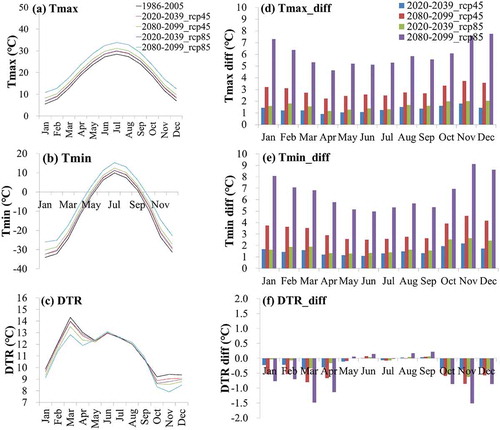
The DTR averaged over the main BRI regions is projected to decrease substantially from November to March due to the stronger warming in Tmin than in Tmax, while the DTR in the remaining months have relatively small changes (). Averaged over the Mediterranean and Black Sea region, the DTR is projected to increase largely from June to September, and decrease from November to March (). For North Asia, the DTR changes are small from May to September, yet have notable decreases from November to March due to the more rapid warmings in Tmin than those in Tmax (Figure 10).
Conclusions
Tmax, Tmin and DTR are three key climate change indicators, and scientific information in their changes has important implications for climate change adaptation and risk management. Based on fine-resolution downscaled data for 18 global models from NASA’s NEX-GDDP, we use the MME approach to project future changes in Tmax, Tmin and DTR in the two periods of 2020–2039 and 2080–2099 for RCP4.5 and RCP8.5 with regard to the historical period 1986–2005 in this study.
The 18-member MME mean simulations can capture spatial patterns of observed Tmax, Tmin and DTR well over the main BRI regions for the historical period. Regarding their magnitudes, the MME simulations also perform well. Averaged over the main BRI regions, the 1986–2005 mean observed Tmax, Tmin and DTR are 17.88°C, 6.56°C and 11.31°C, and the modeled ones are 17.65°C, 6.10°C and 11.55°C. The differences between the observed and modeled values for three temperature variables are generally small, ranging from 0.23°C to 0.46°C.
According to 18-member MME mean projections, Tmax will warm up more rapidly than Tmin, resulting in the increased DTR over central and southern Europe, many areas surrounding the Black Sea and the Caspian Sea, and southeastern China in each future period for RCP4.5 and RCP8.5. By contrast, the projected stronger warming in Tmin than in Tmax can cause the decreased DTR over the regions north of 55°N and some other areas. Averaged over the main BRI regions for RCP8.5, Tmax and Tmin are projected to significantly rise by 1.33°C and 1.38°C in the next 20 years, and by 4.92°C and 5.03°C in the late 21st century. As a consequence, the project DTR will decrease by -0.06°C and −0.11°C in two future periods for RCP8.5. Generally speaking, the model spreads are relatively small or moderate for Tmax and Tmin, while they are large for DTR.
Finally, we analyze the annual cycles of future Tmax, Tmin and DTR changes averaged over the main BRI regions and two selected key regions including the Mediterranean and Black Sea region and North Asia. The results show that there are strong seasonal variations for the projected future changes in the three temperature variables. Averaged over the main BRI regions, the DTR is projected to substantially decrease from November to March due to the stronger warming in Tmin than in Tmax, while the asymmetric warmings of Tmax and Tmin in other months are relatively small. In the Mediterranean and Black Sea region, the DTR is projected to increase largely from June to September, and yet decrease from November to March. For North Asia, there are small changes for the DTR from May to September, yet notable decreases from November to March due to the much faster warmings in Tmin than in Tmax.
Future projections of Tmax, Tmin and DTR based on fine-resolution downscaled data from 18 global models can provide valuable information for effectively adapting to climate change and preventing their adverse impacts on the nature and human society over the main BRI regions. Meanwhile, the uncertainties of projected changes should be recognized. In the future, further analyses with CMIP6 model data should be addressed.
Disclosure statement
No potential conflict of interest was reported by the authors.
Additional information
Funding
References
- Braganza, K., D. J. Karoly, and J. M. Arblaster. 2004. “Diurnal Temperature Range as an Index of Global Climate Change during the Twentieth Century.” Geophysical Research Letters 31 (13): L13217. doi:10.1029/2004GL019998.
- Coumou, D., and S. A. Rahmstorf. 2012. “A Decade of Weather Extremes.”.Nature Climate Change 2 (7): 491–10. doi:10.1038/nclimate1452.
- Dai, A., A. D. D. Genio, and I. Y. Fung. 1997. “Clouds, Precipitation and Temperature Range.” Nature 386: 665–666. doi:10.1038/386665b0.
- Dai, A., K. E. Trenberth, and T. R. Karl. 1999. “Effects of Clouds, Soil Moisture, Precipitation, and Water Vapor on Diurnal Temperature Range.” Journal of Climate 12: 2451–2473. doi:10.1175/1520-0442(1999)012<2451:EOCSMP>2.0.CO;2.
- Davy, R., I. Esau, A. Chernokulsky, S. Outten, and S. Zilitinkevich. 2017. “Diurnal Asymmetry to the Observed Global Warming.” International Journal of Climatology 37 (1): 79–93. doi:10.1002/joc.4688.
- Easterling, D. R., B. Horton, P. D. Jones, T. Peterson, T. Karl, D. Parker, M. Salinger, et al. 1997. “Maximum and Minimum Temperature Trends for the Globe.” Science 277 (5324): 364–367. doi:10.1126/science.277.5324.364.
- Harris, I., P. D. Jones, T. J. Osborn, and D. H. Lister. 2014. “Updated High-resolution Grids of Monthly Climatic Observations - the CRU TS3.10 Dataset.” International Journal of Climatology 34 (3): 623–642. doi:10.1002/joc.3711.
- Hua, W. J., and H. S. Chen. 2013. “Impacts of Regional-scale Land Use/land Cover Change on Diurnal Temperature Range.” Advances in Climate Change Research 4: 166–172. doi:10.3724/SP.J.1248.2013.166.
- IPCC. 2014. “Climate Change 2014: Synthesis Report.” In Contribution of Working Groups I, II and III to the Fifth Assessment Report of the Intergovernmental Panel on Climate Change, edited by Core Writing Team, R. K. Pachauri and L. A. Meyer, 151. Geneva, Switzerland: IPCC.
- IPCC. 2018. “Summary for Policymakers. Global Warming of 1.5°C.” In An IPCC Special Report on the Impacts of Global Warming of 1.5°C above Pre-industrial Levels and Related Global Greenhouse Gas Emission Pathways, in the Context of Strengthening the Global Response to the Threat of Climate Change, Sustainable Development, and Efforts to Eradicate Poverty, edited by, V. Masson-Delmotte, P. Zhai, H. O. Pörtner, D. Roberts, J. Skea, P. R. Shukla, A. Pirani, W. Moufouma-Okia, C. Péan, R. Pidcock and S. Connors, 32. Geneva, Switzerland: World Meteorological Organization.
- Karl, T. R., G. Kukla, V. N. Razuvayev, M. J. Changery, R. G. Quayle, R. R. Heim, and D. Easterling. 1991. “Global Warming: Evidence for Asymmetric Diurnal Temperature Change.” Geophysical Research Letters 18 (12): 2253–2256. doi:10.1029/91GL02900.
- King, A. D., D. J. Karoly, and B. Henley. 2017. “Australian Climate Extremes at 1.5°C and 2°C of Global Warming.” Nature Climate Change 7: 412–416. doi:10.1038/nclimate3296.
- Lobell, D. B., C. Bonfils, and P. B. Duffy. 2007. “Climate Change Uncertainty for Daily Minimum and Maximum Temperatures: A Model Inter-comparison.” Geophysical Research Letters 34 (5): L05715. doi:10.1029/2006GL028726.
- Peng, S. S., S. L. Piao, P. Ciais, R. B. Myneni, A. P. Chen, F. Chevallier, A. Dolman, et al. 2013. “Asymmetric Effects of Daytime and Night-time Warming on Northern Hemisphere Vegetation.” Nature 501 (7465): 88–92. doi:10.1038/nature12434.
- Roy, S. S., C. Robert, and J. Balling. 2005. “Analysis of Trends in Maximum and Minimum Temperature, Diurnal Temperature Range, and Cloud Cover over India.” Geophysical Research Letters 32 (12): L12702. doi:10.1029/2004GL022201.
- Seneviratne, S. I., T. Corti, E. L. Davin, M. Hirschi, E. Jaeger, I. Lehner, B. Orlowsky, and A. Teuling. 2010. “Investigating Soil Moisture–climate Interactions in A Changing Climate: A Review.” Earth Science Reviews 99 (3–4): 125–161. doi:10.1016/j.earscirev.2010.02.004.
- Stone, D. A., and A. J. Weaver. 2002. “Daily Maximum and Minimum Temperature Trends in a Climate Model.” Geophysical Research Letters 29 (9): 701–704. doi:10.1029/2001GL014556.
- Sun, X., G. Ren, Q. You, Y. Ren, W. Xu, X. Xue, Y. Zhan, S. Zhang, and P. Zhang. 2019. “Global Diurnal Temperature Range (DTR) Changes since 1901.” Climate Dynamics 52 (5–6): 3343–3356. doi:10.1007/s00382-018-4329-6.
- Tang, Q., and G. Leng. 2012. “Damped Summer Warming Accompanied with Cloud Cover Increase over Eurasia from 1982 to 2009.” Environmental Research Letters 7: 014004. doi:10.1088/1748-9326/7/1/014004.
- Thrasher, B., E. P. Maurer, C. McKellar, and P. B. Duffy. 2012. “Technical Note: Bias Correcting Climate Model Simulated Daily Temperature Extremes with Quantile Mapping.” Hydrology and Earth Systems Science 16 (9): 3309–3314. doi:10.5194/hess-16-3309-2012.
- Wang, F., C. Zhang, Y. Peng, and H. Zhou. 2013. “Diurnal Temperature Range Variation and Its Causes in a Semiarid Region from 1957 to 2006.” International Journal of Climatology 34 (2): 343–354. doi:10.1002/joc.3690.
- Watts, N., M. Amann, N. Arnell, S. Ayeb-Karlsson, K. Belesova, H. Berry, T. Bouley, et al. 2018. “The 2018 Report of the Lancet Countdown on Health and Climate Change: Shaping the Health of Nations for Centuries to Come.” Lancet 392: 2479–2514. doi:10.1016/S0140-6736(18)32594-7.
- Weber, R. O., P. Talkner, and G. Stefanicki. 1994. “Asymmetric Diurnal Temperature Change in the Alpine Region.” Geophysical Research Letters 21 (8): 673–676. doi:10.1029/94GL00774.
- WMO. 2013. “The Global Climate 2001–2010, a Decade of Climate Extremes.” WMO-No. 1103, 119.
- WMO. 2019. “WMO Statement on the State of the Global Climate in 2018.” WMO-No. 1233. https://library.wmo.int/index.php?lvl=notice_display&id=20799#.XUkFC_ZuJPZ
- Wu, L. Y., J. Y. Zhang, and W. J. Dong. 2011. “Vegetation Effects on Mean Daily Maximum and Minimum Surface Air Temperatures over China.” Chinese Science Bulletin 56 (9): 900–905. doi:10.1007/s11434-011-4349-7.
- Yang, J., H. Z. Liu, C. Q. Ou, G. Z. Lin, Q. Zhou, G. C. Shen, P. Y. Chen, and Y. M. Guo. 2013. “Global Climate Change: Impact of Diurnal Temperature Range on Mortality in Guangzhou, China.” Environmental Pollution 175: 131–136. doi:10.1016/j.envpol.2012.12.021.
- Zhang, J. Y., and W. C. Wang. 2008. “Diurnal-to-seasonal Characteristics of Surface Energy Balance and Temperature in East Asian Summer Monsoon Simulations.” Meteorology & Atmospheric Physics 102 (1–2): 97–112. doi:10.1007/s00703-008-0009-0.
- Zhang, J. Y., W. C. Wang, and L. Y. Wu. 2009. “Land-atmosphere Coupling and Diurnal Temperature Range over the Contiguous United States.” Geophysical Research Letters 36 (6): L06706.
- Zhang, J. Y., Y. H. Zhuang, C. F. Li, Y. H. Wang, B. H. Gu, and X. C. Tan. 2018. “Temporal and Spatial Analyses of Climate Change and Extreme Events over Major Areas of the Belt and Road.” China Meteorological Press, Beijing, 1–91.
- Zhang, J. Y., Y. H. Zhuang, K. Li, C. F. Li, B. H. Gu, and X. C. Tan. 2019a. “Future Projections of Climate Change over Major Regions of the Belt and Road.” China Meteorological Press, Beijing, 1–114.
- Zhang, J. Y., Y. H. Zhuang, L. X. Zhang, F. Chen, M. P. Chen, B. H. Gu, and X. C. Tan. 2019b. “Future Projections of Weather and Climate Extremes in Major Belt and Road Regions.” China Meteorological Press, Beijing, 1–219.
- Zhou, L., R. E. Dickinson, P. Dirmeyer, A. Dai, and S. K. Min. 2009. “Spatiotemporal Patterns of Changes in Maximum and Minimum Temperatures in Multi-model Simulations.” Geophysical Research Letters 36: L02702. doi:10.1029/2008GL036141.