
ABSTRACT
Introduction
China’s import bans on solid wastes starting from 2017 have challenged the global trade system of plastic wastes, which remains poorly characterized. This study chooses polyethylene (PE) as a case and aims to map out the global trade networks of PE waste (GPETN) from 1976 to 2017.
Outcomes
We find that the size and complexity of the GPETN had been growing until 2016. After the mid-1990s, PE waste basically flowed from developed economies, mainly the EU and the US, to developing economies such as China. Since 2001 when admitted into the WTO, China’s PE waste import surged until 2014 when it absorbed over 60% of global export. Regulations on solid waste import following the Green Fence campaign in 2013 resulted in substantial reductions in China’s import as well as the global export of PE waste after 2014. Several other developing economies, such as Malaysia, Turkey, and Vietnam, had transitioned to net importers, but their imports were insufficient to replace China as new recycling bases for PE waste.
Conclusion
The results highlight the urgent need of a joint effort for developed and developing countries to build a stronger global circular economy system with sufficient capacity to treat PE waste locally.
Introduction
Plastics are a group of versatile materials with various forms and properties. The global production of plastics has grown exponentially since the 1950s, from 1.5 million tonnes (Mt) in 1950 to 348 Mt in 2017 (PlasticsEurope Citation2008, Citation2018). Accompanying the use of plastics is the generation of plastic waste and their disposal and management. It was estimated that 6.3 billion tonnes (Bt) of plastic waste has been generated as of 2015, with around 79% landfilled or discarded into the environment, 12% incinerated, and only 9% recycled (Geyer, Jambeck, and Law Citation2017).
Export is an important means of plastic waste treatment for many countries. In 2016, 4.6 Mt of plastic waste was traded globally (Citation2019). Major exporters of plastic waste are mainly high-income countries such as the US, Japan, Germany, and UK (Brooks, Wang, and Jambeck Citation2018). The world’s largest importer of plastic waste is China, receiving 45% of the global total cumulative trade volumes by 2016 (Brooks, Wang, and Jambeck Citation2018). This trend of developed countries exporting wastes to less-developed countries has been studied in the case of hazardous waste, and specifically e-waste (Schmidt Citation2006; Hotta et al. Citation2008; Puckett et al. Citation2002). Several studies applied the Pollution Haven Hypothesis (PHH) to investigate the phenomenon of developed countries exporting e-waste to informal dumping hubs in developing countries in Asia and Africa (Davis, Akese, and Garb Citation2019). Lepawsky and McNabb (Lepawsky and McNabb Citation2010) find that most trade flows of e-waste were intraregional rather than interregional. Later studies further proposed the need for a revised and more nuanced interpretation of the PHH: Lepawsky (Lepawsky Citation2015) revealed the decrease of e-waste trade from Annex VII countries to non-Annex VII countries and the growth of trade in the opposite direction; Gregson and Crang (Gregson and Crang Citation2015) stressed the economic significance of wastes for developing countries as secondary resources.
The trade of recyclable non-hazardous solid waste, especially plastic waste, has gained increasing interest after China started a series of regulation efforts on plastic waste import to alleviate their negative environmental impacts. These regulations include, at least, a permanent ban on the import of non-industrial plastic waste issued in 2017 and a further ban on both industrial and nonindustrial plastic waste issued in 2018 (Ministry of Ecology and Environment of the People’s Republic of China Citation2017, Citation2018). Brooks, Wang, and Jambeck (Brooks, Wang, and Jambeck Citation2018) drew a general picture of the global plastic waste trade, illustrating the flow of most plastic waste from high-income countries to low-income countries, especially China. They projected that approximately 111 Mt of plastic waste will be displaced by China’s new plastic waste ban by 2030.
The global trade network of plastic waste is complicated and dynamic, affected by various socioeconomic factors. Despite the public concerns aroused by the issue of plastic waste trade, there is still a gap in understanding the historical evolution of spatial and temporal characteristics of the global trade network of plastic waste. A recent study by Wang et al. (Wang et al. Citation2020) explores the characteristics of the global trade network of all plastic waste as a whole, revealing China’s important role in the network and the redirection of plastic waste to Southeast Asia as a response to China’s import ban. However, no study has yet investigated the trade network of waste of individual polymers such as polyethylene (PE) or polyethylene terephthalate (PET).
PE is one of the most widely used plastics, accounting for 33% of global plastic waste export, and 30% of European plastic converter demand in 2017 (PlasticsEurope Citation2018). It has good physicochemical properties to be melted and molded into recycled products. The main types of PE include High-Density Polyethylene (HDPE), Low-Density Polyethylene (LDPE), and Linear Low-Density Polyethylene (LLDPE), and HDPE is the most easily recycled type of all plastics (Plastics Insight Citation2019a). The recycling rate of PE has considerable potential for growth. In the US, the recycling rates of HDPE and LDPE/LLDPE were 10.3% and 6.2% in 2015, respectively, significantly lower than other resins (22.6%) and PET (18.4%) (U.S. Environmental Protection Agency OoLaEM, Office of Resource Conservation and Recovery Citation2018). It is thus very likely that the scale of PE waste trade continuously increases in the near future as a result of growing recycling practices.
Complex network analysis is a method commonly used to investigate the characteristics of global trade networks for various commodities such as petroleum, rare earths, and iron ore (Ji, Zhang, and Fan Citation2014; Wang et al. Citation2016; Hao et al. Citation2018). Many studies focused on the roles of countries or areas in the network, using indicators for properties of individual countries such as unweighted and weighted degree, clustering coefficient (Hao et al. Citation2018), centrality (Ge et al. Citation2016), and competitiveness (Chen et al. Citation2016). Others described the overall structure of trade networks with indicators characterizing the network as a whole, such as density, diameter, average pathlength (Hao et al. Citation2016), and trade stability (Ji, Zhang, and Fan Citation2014). To describe the internal structure of a network, trade communities were often detected using the indicator modularity (Ji, Zhang, and Fan Citation2014; Zhong et al. Citation2014, Citation2017).
Therefore, by taking advantage of the complex network method, this study aims to provide an in-depth analysis of the global trade history of PE waste during the period 1976–2017. We especially attempt to address the following questions: (1) how did the volume and system structure of PE waste trade evolve from 1976 to 2017? (2) what roles did different countries play in the global PE waste trade system and what were the differences and relationships between developed and developing economies? and (3) how important was China in this system, and will its import ban significantly influence the future of global PE waste trade?
Materials and methods
System definition
We studied the PE waste trade data of all 195 countries and areas (hereafter countries) that have PE waste trade data present in the United Nations (UN) Comtrade Database from 1976 to 2017. Due to the large number of countries studied and the fact that trade volumes vary dramatically among countries, there are difficulties identifying evident regional distribution patterns of PE waste trade by merely studying trade data of separate countries. Thus, we grouped the studied countries into 11 regions using the United Nations’ Standard Country or Area Codes for Statistical Use (M49) with slight modifications taking into account the relative significance of PE waste trade of certain countries. For example, we defined “Mainland China and Hong Kong” and “Japan” as separate regions because their trade weights of PE waste took up considerable portions of the world total (see Appendix A. for the full list of countries and the regions they were classified to).
We paid special attention to trade patterns on 10-year intervals starting from 1976, when the trade data of PE waste were first recorded. We also selected the year 2017 because trade patterns changed rapidly after China’s import ban. For 1976, 1986, 1996, 2006, 2016, and 2017, we built trade networks for PE waste, identified major importers and exporters, and calculated the net import or export of these countries.
Data source
We extracted trade data in physical unit (kilograms) from the UN Comtrade Database, using both the SITC (Standard International Trade Classification) and HS (Harmonized System) commodity codes. There have been three commodity codes for PE waste: the SITC codes 58,319 (Rev. 2) and 5791 (Rev. 3 and Rev. 4), and the HS code 391,510 (see Appendix B. for the names of commodity and years of data available for each code) (United Nations Comtrade Database Citation2019). Because each country switched to new codes in different years (for example, the code for PE waste trade reported by Japan changed from 58,319 to 391,510 in 1988, whereas the same code switch for Mainland China happened in 1992), trade data in the same year could be under different codes depending on the reporter. However, there is no repetition because data from the same reporter in the same year are based on only one code.
Data processing
The same trade record, when reported by the importer and the exporter, can have slight discrepancies due to factors such as inconsistent attribution of importers and exporters in entrepot trade and difference in measurement methods of trade values. When building the trade networks of PE waste, we used data reported by importers only, as possible loss of trade mass during transportation was accounted for in these data. For convenience, when analyzing the import and export patterns of the world and different regions, countries, and areas, we used import and export data reported by the regions, countries, and areas that we study.
While the monetary data (trade value) are available for every trade record, some data for mass are missing. We estimated these missing data with the following method: if the data for the same reporter in adjacent years of the missing entry are available, we calculate the average unit price for the year before and the year after, and divide the known trade value by this average unit price; if data for the same reporter are missing in continuous years, we assume that the unit prices follow a linear trend and calculate them by interpolation.
One likely error that we identified in the data obtained is the abnormally high trade weight reported by the US during 1985–1988. For these years, there is a large gap between the US reported data and the same record reported by its trade partners. For example, the US reported import mass from Canada in 1988 was 100 times higher than that reported by Canada. We fixed this error by replacing data reported by the US from 1985 to 1988 with data for the same record reported by its trade partners.
In the original data, the import and export of Hong Kong, China (hereafter Hong Kong) accounted for as high as 40% of that of the world. However, most were repeated calculation, as the majority of its export was reexport, that is, “exports of foreign goods in the same state as previously imported,” to Mainland China (UN International Trade Statistics Knowledgebase Citation2016). We thus modified Hong Kong’s trade data by excluding the part of Hong Kong’s reexport to China in both of Hong Kong’s import and export. In years when Hong Kong’s reexport to China exceeded Hong Kong’s total import, we assumed Hong Kong’s “real” import to be 0.
Methods for building trade networks, calculating network indicators, and identifying major importers and exporters
Building trade networks
For each of the years 1976, 1986, 1996, 2006, 2016, and 2017, we constructed a comprehensive network of all trade records from country to country and a simplified network of the net trade flow from region to region, as defined in the System Definition section. We used the comprehensive network to study the basic features of the global trade of PE waste and identify major importers and exporters at the country level, and we used the simplified network to inspect patterns at the regional level.
Nodes in the comprehensive network represent countries. Each special reporter in the UN Comtrade Database that does not represent a specific country or area (for example, “areas, not elsewhere specified,” “Europe, not elsewhere specified,” etc.) is also counted as a node. Edges in the comprehensive network denote trade records from one country to another, and their directions are determined by the directions of trade. In the simplified network, nodes represent the 11 regions, and edges denote the net trade flows. The edges have the same direction as the net flows of commodities. For example, if Territory A imported more from Territory B than it exported to Territory B, the edge between them represents Territory A’s net import from Territory B and is directed from B to A, and vice versa. The weights of edges in both types of networks are equal to the weights of commodities traded in kilograms.
Calculating network indicators
We used the complex network visualization and analysis software Gephi to calculate the following network indicators: average degree and average weighted degree, which show the number and mass of trade per country; modularity class, which groups countries into communities; density, average clustering coefficient, diameter, and average path length, which demonstrate how closely connected the nodes in the networks are. Detailed methods adopted by Gephi for calculating these indicators, if provided, are listed in Appendix C.
Identifying major importers and exporters
In the PE waste trade networks in this study, a high weighted in-degree or weighted out-degree of a country indicates a relatively important role in the import or export of PE waste. In the five trade networks of PE waste in 1976, 1986, 1996, 2006, and 2016, countries with weighted in-degrees or weighted out-degrees above the 90% percentile were identified as major importers and exporters.
Results
Scale and structure of the trade network
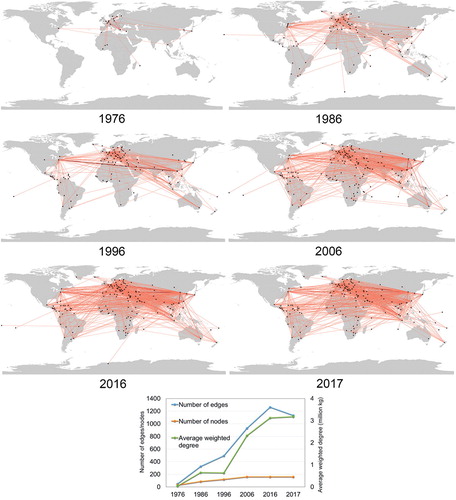
A clear trend in the trade network of PE waste was that it had substantially grown in size, trade partnerships, and trade mass, as indicated by the number of nodes, edges, and the average weighted degree, respectively. The number of countries involved in the trade system grew from only 22 in three continents in 1976 to 154 in all continents except Antarctica in 2017. The number of trade partners and the volume of trade per country had also increased, as indicated by the average degree and average weighted degree. The average degree grew from 1.7 to 7.3 per year, and the average weighted degree grew from 2.4 million to 31.6 million kilograms (kg) per year from 1976 to 2017. A particularly rapid increase in trade volume was observed during 1996–2006. In 2017, the number of trade flows dropped rather sharply, which is mostly accounted for by a change in data reporting strategies of some countries. Taking this out of consideration, the number of global trade flows only dropped slightly ().
Figure 1. The global trade network of PE waste in 1976, 1986, 1996, 2006, 2016, and 2017; the number of nodes, the number of edges, and the average weighted degree of nodes in the networks.
The two most dominant trade communities that persisted throughout the timeline were the Europe community and the Asia–America community. European countries have dense trade relationships among each other, forming one to three distinct trade communities. The main dynamic in the Asia–America community, on the other hand, is the US consistently exporting to Asia, especially China ()). While the trade communities have always been generally geographically defined, the extent varies with time. Starting from 1996, the Asia–America community started to have more and more members in Europe and Africa. During 10-year intervals before 2016, the Europe community and Asia–America community did not experience the exchange of members. In 2016, however, some major members in Europe communities in 2006, such as Germany and France, began to join communities of American and Asian countries ()).
Figure 2. (a) and (b): The evolution of PE waste trade communities with more than three members in 1976, 1986, 1996, 2006, 2016, and 2017. One color represents one community. The colors of boxes in the flow chart correspond with the color nodes in the network graph, the same color representing the same community. The size of nodes represents the trade mass of the country relative to global trade mass.
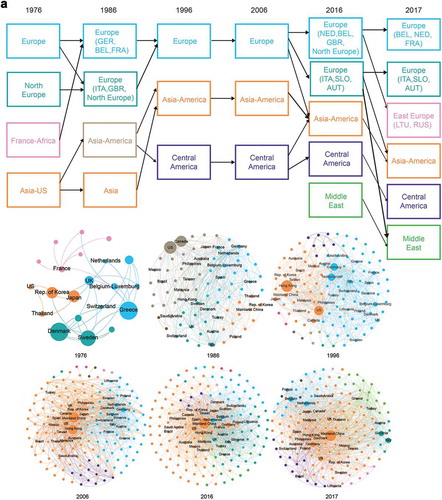
Figure 2. (Continued).
The trend of network indicators observed in 1996 and 2016 suggests that the network became less connected as a whole around 1996 and more so around 2016. The decreased density and average clustering coefficient in the 1996 network compared to 1986 suggest that the portion of existing trade flows in all possible trade flows decreased, and the increased diameter and average path length suggest that the number of intermediate countries needed for any two countries to trade increased. The opposite trend was observed in 2016 ().
Table 1. Diameters, densities, average degrees, average weighted degrees, average clustering coefficients, and average path lengths of the comprehensive trade network of PE waste in 1976, 1986, 1996, 2006, 2016, and 2017.
Distribution and flows by region
Regional distribution of import and export
Based on the regional distribution of import and export, the history of PE waste trade can be divided into three periods.
Period 1 (1976–2000): the trade system was dominated by the EU-28 and North America in both import and export. Total trade weight increased steadily but slowly.
Period 2 (2001–2014): Mainland China and Hong Kong’s share in import grew rapidly to over 50%, and the export of every other region also increased. Global trade weight skyrocketed, mostly contributed by Mainland China and Hong Kong as the biggest importer and EU-28 as the biggest exporter.
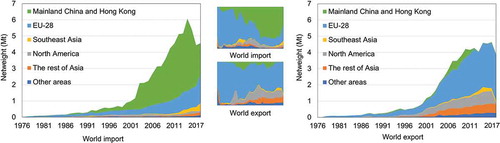
Period 3 (2015–2017): An overall decline was seen in both import and export after 2014. While Mainland China and Hong Kong was the only contributor to the drop of import, almost every region showed a reduction in export. In 2017, the import of Mainland China and Hong Kong continued to decrease. This reduction was compensated by the considerable growth in the import of EU-28 and Southeast Asia that made the world’s total import increase slightly ().
Figure 3. World import (left) and export (right) of PE waste (1976–2017) (intraregional trade included).
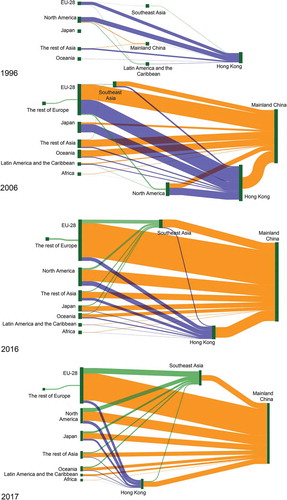
Interregional flows
The interregional flows of PE waste in 1976 were not centered at any particular region. The three greatest flows were 369 tonnes (44% of world total) from the rest of Europe to EU-28, 266 tonnes (32%) from EU-28 to Africa, and 101 tonnes (12%) from Japan to Southeast Asia. There were few connections among different continents relatively distant to each other – countries tend to trade mainly with their neighbors. The destination of global PE waste had been concentrated to one region since 1986. In 1986, this destination was EU-28, its import from the rest of Europe, Asia, and the Americas taking up 64% of the world total. Starting from 1996, Mainland China and Hong Kong replaced EU-28 as the biggest importer. The biggest source of China’s PE waste import was North America in 1996, accounting for 45% of total import, and then the EU-28 in 2006 and 2016, accounting for 38% and 41% of total import, respectively.
Many regions experienced a transition in trade balance, the timing of which reflecting their development status. Most regions transitioned from net importer to net exporter up to 2017, the more developed ones making the transition earlier: EU-28 and Oceania started net exporting in as early as 1996, followed by other less-developed regions. Shifts from net exporter to net importer, on the other hand, rarely happened. Despite China’s dramatic shift to net importer between 1986 and 1996, the only significant change from net exporter to net importer was observed in Southeast Asia in 2017. This shift is mostly due to increased PE waste flows diverged from China because of its import ban, and thus it is more of a response to external policy as opposed to a natural pattern related to economic development. Therefore, it can be concluded that regions tend to transition to net importers as their economy develops to a certain point.
Hong Kong’s role as an entrepot became clear when its trade flows were separated from that of China’s. In 1996, when China’s net import volume was still small, Hong Kong was the biggest net importer for regions across the world. The net import of both China and Hong Kong surged during the following 10 years, and China’s net import exceeded Hong Kong. In 2006, Hong Kong’s net export to China accounted for around one-third of its net import from other regions in the world. In 2016 and 2017, Hong Kong’s net import kept shrinking and became nearly equal to its net export to China. Meanwhile, Southeast Asia’s net import from other regions was growing, while net-exporting to China. Southeast Asia’s net export to China was comparable to its total net import from other regions in 2016, but as its net import continued to increase in 2017, a considerable portion of the net import was consumed in the region ().
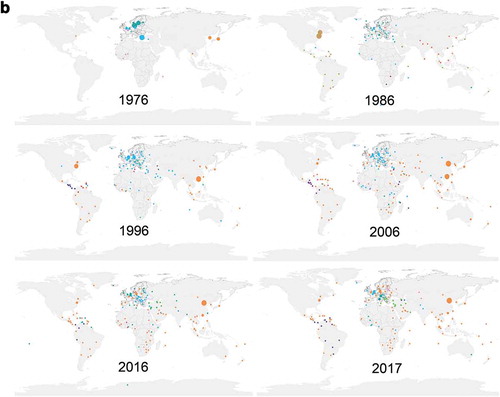
Figure 4. Interregional flows of PE waste in 1996, 2006, 2016, and 2017. The direction of the flows are from left to right.
Trade patterns of typical countries, areas, and regions
Developed economies
Among the world’s 35 developed countries, the number of net exporters of PE waste increased from 1996 to 2016. However, the leading net exporters, namely Germany, the UK, the US, Japan, and France, were relatively stable. Among these five countries, Germany, the US, and Japan exceeded 0.1 Mt of net export in 2001, and the UK and France followed in 2006. The net export of the top net exporter in 1996, 2001, 2006, and 2011 increased by approximately 0.2 Mt every 5 years. The net export of other developed countries was less than 0.1 Mt, except for South Korea and Belgium that reached 0.1Mt in 2016 and 2017, respectively. Net import was considerably lower than net export: up to 2017, the Netherlands was the only developed country with a net import of over 0.1 Mt. Two important changes in the trade balance of developed economies from 2016 were observed. First, the net export of the top net exporter Germany decreased in 2016 compared to 2011, and all five dominant net exporters listed above further reduced their net export in 2017. Second, the number of net exporters that had been increasing since 1996 declined in 2017 as Slovenia, Portugal, and Cyprus shifted to net importers ()).
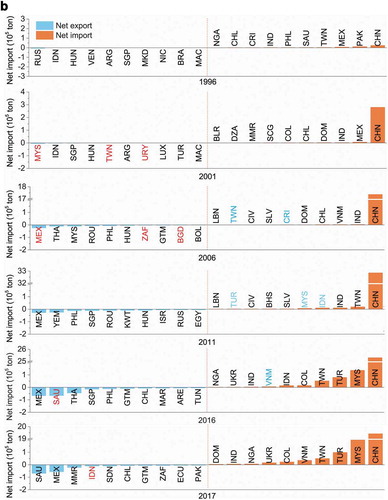
Figure 5. (a) The net export or net import weight of PE waste of developed economies in 1996, 2001, 2006, 2011, 2016, and 2017 (Red font: change from net importer to net exporter; blue font: change from net exporter to net importer). (b) The net export or net import weight of PE waste of developing economies (top 10 in net export and top 10 in net import) in 1996, 2001, 2006, 2011, 2016, and 2017 (Red font: change from net importer to net exporter; blue font: change from net exporter to net importer).
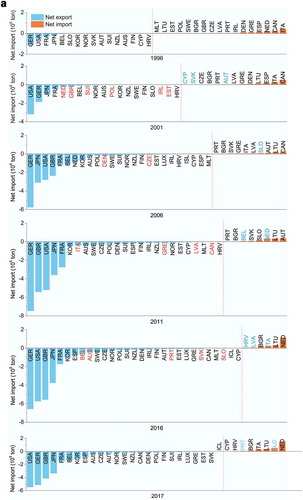
Figure 5. (Continued).
We identified 29 countries that were, or used to be, major importers and exporters of PE waste, and observed their trade volumes from 1976 to 2017. Twenty of them were developed countries, among which nine had always been net exporters (including all the top five net exporters mentioned earlier), six (Australia, Greece, South Korea, Spain, Sweden, and Switzerland) had turned from net importers to net exporters, and only two (Italy and Lithuania) had always been net importers. A common turning point for developed countries is the year 2001, when the export of most of them began to significantly increase. While there are countries such as Austria and Belgium that increased import at a similar rate as well, 2001 is the point after which import started to lag behind export for most developed countries.
EU-28 had a balanced and stable trade pattern until 2000, when it began increasing export at a faster speed than import. Its export accounted for 60% of the world’s total export per year on average. From 2012 to 2016, EU-28’s export stagnated while its import continued to rise. In only 3 years from 2014 to 2017, the portion of EU-28’s import in global total import grew from 18.4% to 38.0% ()).
Figure 6. (a) PE waste trade balance of EU-28 and the percentage of EU-28 import/export to world import/export (1976–2017). (b) PE waste trade balance of the United States and the percentage of US import/export to world import/export (1985–2017).(c) PE waste trade balance of Japan and the percentage of Japan export to world export (1976–2017). (d) PE waste trade balance of China and the percentage of China export to world export (1987–2017).(e) PE waste trade balance of Southeast Asia and the percentage of Southeast Asia export to world export (1976–2017).
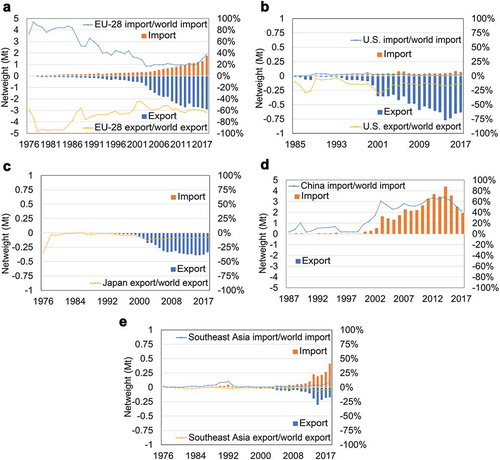
Unlike EU-28, the US only experienced dramatic growth in export in 2000, while its import always stayed at the same level (almost zero) as in 1985 when its trade was first recorded. As a result, the US’s export was nearly 15 times larger than its import in 2014, before it began to decline. Nonetheless, the US’s export had always been stably accounting for around 15% of the world’s total export since 2004 ()).
Japan was one of the first countries to trade PE waste, with barely any import compared to export, and its absolute export volume accounted for 9% of global total export ever since 2001. Unlike EU-28 and the US that did not slow down export growth until the 2010s, Japan’s export began to level in as early as 2006 ()).
Developing economies
Nine of the 29 major importers and exporters of global PE waste trade are developing countries, and they are all emerging market economies (MSCI Citation2019). Five of them (Brazil, Malaysia, Mainland China, Turkey, and Taiwan, China (hereafter Taiwan)) were net importers in 2016, among which Mainland China and Taiwan had been reducing import in recent years. The other four were net exporters, importing very small amounts of PE waste. Among them, the Philippines had been reducing export since 2014, whereas Mexico, Saudi Arabia, and Thailand had been increasing their export since 2010.
Mainland China and Southeast Asia were the two most important players among the developing economies. China had been an extremely large net importer. Its net import had always been more than 10 times higher than the second biggest net importer among developing economies – in 2011, it was over 150 times higher. The years 1999–2003 were the period of rapid growth for China’s import; during these 4 years, the proportion of China’s import in global total surged from less than 10% to around 60%. This proportion fluctuated in the next decade but kept growing. After 2013, both the net weight and proportion of China’s import declined as a result of the 2013 Green Fence campaign that enhanced inspections on the quality of imported solid waste ()) (Velis Citation2014).
Southeast Asia turned from a net importer to a net exporter from around 2000, and became a net importer again from 2015, with its import growing and export declining at an ever-increasing rate. Its import almost doubled in only 1 year from 2016 to 2017. Nonetheless, the portion of its import in global total import remains relatively low at around 10% ()).
Either as a whole or separately, developing economies other than China did not contribute to the global trade volume as much as developed economies did. The net trade weight per developing country was much lower than that of the developed countries: around 90% of all developing countries or areas shown in ) had net trade weights lower than 0.05 Mt per year. The growth in net trade weight had been little until 2016, when Malaysia, Turkey, and Taiwan first exceeded 0.05 Mt per year in net import, while Mexico, Saudi Arabia, and Thailand first reached over 0.04 Mt per year in net export. In just 1 year from 2016 to 2017, Malaysia’s net import grew a remarkable 0.05 Mt ()).
Discussion
Our examination of the temporal evolution of global trade network of PE waste on the aggregate level, the regional level, and the level of individual countries revealed patterns of PE waste trade based on time and development status of regions. Two important time points were identified: (1) 2001, when the import of Mainland China and the export of most developed countries dramatically increased, and (2) 2014, when Mainland China’s import started decreasing, and the import of Southeast Asia began to increase while export of major exporters such as EU-28 and the US began to drop as a response. These two time points each corresponds to a major event in the history of global PE waste trade. In 2001, China joined the World Trade Organization (WTO), which accounts for its dramatic increase in import that stimulated growing export in developed countries. In 2014, China began to reduce its import as a result of the 2013 Green Fence campaign that enhanced inspections on the quality of imported solid waste, diverging PE waste trade flows to Southeast Asia (Velis Citation2014). In the analysis of network indicators, we identified the years 1996 and 2016 among the 6 examined years as when the network became significantly less and more connected according to network indicators, respectively. This pattern in network properties is a reflection of the two major events in 2001 and 2014 regarding China’s enhanced and weakened role in the network explained above.
The impact of the participation of China on the network structure in 2001 can be interpreted as follows. Before 2001, the PE waste export of one country was usually distributed to a number of countries since each one’s import mass was relatively small, and these importers were often of geographical proximity with the exporter, because factors other than geographical proximity were similar. This was reflected in the network structure as denser trade relationships. After China started to contribute import capacity, not only many times more than the average of other importers but also at lower prices, countries around the world were incentivized to send PE waste there regardless of geographical closeness. The export demand of one country can consequently be satisfied by fewer importers. This pushed the network structure to an opposite direction of having fewer trade relationships per country.
Similar reasoning can explain the network’s return to one that was more connected, as part of China’s import was replaced by multiple other countries starting from 2014. One difference, however, was that trade communities did not return to the geographically defined pattern before 1996, and countries were even having more longer-distance trade than before. This suggests that trading only with neighbors was no longer enough to satisfy some countries’ need for PE waste export. One observation worth noticing is that this reversal of the network structure took place before China officially banned plastic waste import in 2017. This suggests that the impact of a thorough ban of all plastic wastes after 2018 to the global PE trade network would only be more significant than that observed in this article.
Major regions across the world shared the trend of transitioning toward net-exporting PE waste, and more developed regions generally make the shift earlier. In the same vein, on the country level, developed countries are predominantly net exporters while developing countries are predominantly net importers. The trade volumes of developing countries, with the exception of Mainland China, were far lower than that of developed countries, and those that were identified as major importers or exporters were all emerging market economies, which polarized into either net importers or net exporters since the last decade.
The predominance of net exporters and continuous increase of net export volume among developed countries before 2016 reflect strong economic incentives to export PE waste and lack of incentives to import PE waste. On the one hand, domestic PE recycling has a high cost, driving developed countries to ship PE waste to less-developed countries for more inexpensive disposal. On the other hand, developed countries’ demand for PE, primarily driven by end-user industries such as packaging and construction, has become stable and can be satisfied by domestic PE production (Plastics Insight Citation2019a, Citation2019b, Citation2019c). Importing PE waste as secondary materials does not generate significant cost savings while requiring extra effort on cleaning and sorting.
In contrast, emerging market economies have economic incentives to import PE waste as secondary materials, in that their production capacity of virgin PE cannot catch up with the soaring demand for plastic products as a result of rapid economic development and increasing living standards (Behrens et al. Citation2007). Nonetheless, our results show that many of them still turned into net exporters of PE waste over time. One main explanation is their lack of infrastructure and capability to properly dispose imported PE waste, the quality of which is often inconsistent. Until December 2017, Europe’s plastic waste was still predominantly disposed of by incineration (~40%), landfill (~30%), and export (~12%), because the plastic recycling schemes and facilities are incapable of recycling low-quality waste (European Commission Citation2018). In other words, only a small portion of Europe’s plastic waste is clean, well sorted, and suitable for recycling. Around 25% of all waste collected by the US recycling company Waste Management was contaminated and must be landfilled (Albeck-Ripka Citation2018). The PE recycling rates in countries less developed, and consequently less invested in such technology, would then only be lower. In major developing countries importing PE waste, such as Malaysia and Turkey, unrecycled waste is eventually disposed through landfill or incineration, leading to contamination (Ananthalakshmi Citation2018; Gokce Saracoglu Citation2018). This environmental consideration has driven more countries to halt plastic waste import – typical examples are China’s Green Fence campaign in 2013 and a permanent ban on the import of both industrial and nonindustrial plastic waste in 2018 (Ministry of Ecology and Environment of the People’s Republic of China Citation2017, Citation2018; Velis Citation2014). As plastic waste exports were directed from China to Southeast Asia, Southeast Asian countries such as Malaysia, Vietnam, and Thailand also took action to prevent plastic waste from entering, by issuing crackdowns and bans on the import of plastic waste in late 2018 (DHL Resilience360 Citation2018; Fullerton Citation2018; Reintjes Citation2018). The lack of ability to mitigate the negative environmental impact of PE waste explains why most developing economies turned into net exporters despite their demand for secondary PE.
The discussion above provides insights to predicting the world’s response to the challenge that our PE waste management system is facing today. China’s plastic waste ban will displace an estimated 111 Mt, which is 47% of the global total imported plastic waste since 1988, by 2030 (Brooks, Wang, and Jambeck Citation2018). In 2017, China imported 1.9 Mt of PE waste from the world, a 24% decline from 2016. Because of the imbalance in number and capacity of net exporters (developed countries with large trade mass and a rising number of emerging developing countries) and net importers (developing countries with small trade mass), this big and still enlarging gap in PE waste import is unlikely to be filled by a single country. If this gap in PE waste import is jointly filled by multiple countries around the world, the structure of the global trade network will move further toward the direction that we observed from 2016. As China continues to reduce import in the future, it is possible that the global trade network of PE waste will become bigger and denser, have more regional communities, but also becoming more closely connected as a whole as geographical proximity is given less importance.
China is not the only country that banned plastic waste import. As Southeast Asian countries, which currently account for around one-fourth of world total import of PE waste, adopt stricter import policies, the structure of the trade network will experience a further change, though at a smaller degree. Upon then, another gap in import will appear, and it is most likely that other emerging economies (e.g., Turkey, Taiwan, India) will take the burden of filling it. Eventually, the time when all importers exceed their capacity of receiving waste will approach. Thus, while striving to fill the gap in import, it is also crucial that every country minimizes its exports by developing a domestic recycling system for PE waste. More importers will only help relieve part of the problem: the current five developed countries with the largest trade volume of PE waste all had almost no history of importing PE waste, and the PE waste disposal ability of other countries combined, as shown by their previous import volumes, has a gap behind China’s and will need time to catch up. Our results highlight the urgent need of a joint effort for both developed and developing countries to build a stronger global circular economy system with sufficient capacity to treat PE waste locally. To improve domestic recycling rates, countries should aim to improve the quality of collected PE waste to meet the standard for recycling and develop or recover sound facilities, technologies, and regulations on PE waste disposal and recycling. This would also help reduce the emissions of waste plastics into rivers, the ocean, and other ecosystems, consequently promoting global sustainability by enhancing the close-loop cycles of plastics.
One limitation of this study is that trade data after 2017 were not covered in the analyses, because data for some countries in these years were not yet available. In the future, it is crucial to understand and interpret data of future years, especially the few years after China made the important move of banning all plastic waste import in 2018, to verify the predictions on how the global PE waste trade system will react. Future research can also investigate global trade patterns of wastes of other polymers (e.g., PVC and PS), and of other types of solid waste such as wastes of paper and metals. Trade flow data can be combined with waste generation data of countries measured using the material flow analysis method (Laner and Rechberger Citation2016) to obtain a more complete picture of the global flows of wastes.
Acknowledgments
We acknowledge Prof. Yong-Guan Zhu and Dr. Ping Zhong for helpful comments and thank the United Nations Department of Economic and Social Affairs, Statistics Division for access to global trade data of PE waste. We also thank the editor and the two anonymous reviewers for helpful comments.
Correction Statement
This article has been republished with minor changes. These changes do not impact the academic content of the article.
Additional information
Funding
References
- Albeck-Ripka, L. 2018. “Your Recycling Gets Recycled, Right? Maybe, or Maybe Not.” The New York Times, May 29.
- Ananthalakshmi, A., EC. 2018. “Swamped with Plastic Waste: Malaysia Struggles as Global Scrap Piles Up”. https://www.businessinsider.my/swamped-with-plastic-waste-malaysia-struggles-as-global-scrap-piles-up/?_ga=2.147211635.554056196.1551840705-1596260945.1551840705
- Behrens, A., S. Giljum, J. Kovanda, and S. Niza. 2007. “The Material Basis of the Global Economy: Worldwide Patterns of Natural Resource Extraction and Their Implications for Sustainable Resource Use Policies.” Ecological Economics 64 (2): 444–16. doi:10.1016/j.ecolecon.2007.02.034.
- Blondel, V. D., J.-L. Guillaume, R. Lambiotte, and E. Lefebvre. 2008. “Fast Unfolding of Communities in Large Networks.” Journal of Statistical Mechanics: Theory and Experiment 2008 (10): P10008. doi:10.1088/1742-5468/2008/10/P10008.
- Brandes, U. 2001. “A Faster Algorithm for Betweenness Centrality.” The Journal of Mathematical Sociology 25 (2): 163–177. doi:10.1080/0022250X.2001.9990249.
- Brooks, A. L., S. Wang, and J. R. Jambeck. 2018. “The Chinese Import Ban and Its Impact on Global Plastic Waste Trade.” Science Advances 4 (6): eaat0131. doi:10.1126/sciadv.aat0131.
- Chen, Z., H. An, X. Gao, H. Li, and X. Hao. 2016. “Competition Pattern of the Global Liquefied Natural Gas (LNG) Trade by Network Analysis.” Journal of Natural Gas Science and Engineering 33: 769–776. doi:10.1016/j.jngse.2016.06.022.
- Davis, J. M., G. Akese, and Y. Garb. 2019. “Beyond the Pollution Haven Hypothesis: Where and Why Do E-waste Hubs Emerge and What Does This Mean for Policies and Interventions?” Geoforum 98: 36–45. doi:10.1016/j.geoforum.2018.09.020.
- DHL Resilience360. 2018. “Vietnam Bans Scrap Import to Keep Its Ports Congestion-free” https://www.resilience360.dhl.com/news/vietnam-bans-scrap-import-to-keep-its-ports-congestion-free/
- European Commission. 2018. A European Strategy for Plastics in A Circular Economy. Brussels: European Union.
- Fullerton, J. 2018. “Thailand to Ban Foreign Plastic Waste from 2021 as South East Asia Buckles under Waste Influx”. The Telegraph.
- Ge, J., X. Wang, Q. Guan, W. Li, H. Zhu, and M. Yao. 2016. “World Rare Earths Trade Network: Patterns, Relations and Role Characteristics.” Resources Policy 50: 119–130. doi:10.1016/j.resourpol.2016.09.002.
- Geyer, R., J. R. Jambeck, and K. L. Law. 2017. “Production, Use, and Fate of All Plastics Ever Made.” Science Advances 3 (7): e1700782. doi:10.1126/sciadv.1700782.
- Gokce Saracoglu, S. L. 2018. “Turkey’s Plastic Waste Imports from the UK are Booming – But at What Cost?.” The Guardian, October 18.
- Gregson, N., and M. Crang. 2015. “From Waste to Resource: The Trade in Wastes and Global Recycling Economies.” Annual Review of Environment and Resources 40 (1): 151–176. doi:10.1146/annurev-environ-102014-021105.
- Hao, X., H. An, H. Qi, and X. Gao. 2016. “Evolution of the Exergy Flow Network Embodied in the Global Fossil Energy Trade: Based on Complex Network.” Applied Energy 162: 1515–1522. doi:10.1016/j.apenergy.2015.04.032.
- Hao, X., H. An, X. Sun, and W. Zhong. 2018. “The Import Competition Relationship and Intensity in the International Iron Ore Trade: From Network Perspective.” Resources Policy 57: 45–54. doi:10.1016/j.resourpol.2018.01.005.
- Hotta, Y., M. Elder, H. Mori, and M. Tanaka. 2008. “Policy Considerations for Establishing an Environmentally Sound Regional Material Flow in East Asia.” The Journal of Environment & Development 17 (1): 26–50. doi:10.1177/1070496507312562.
- Ji, Q., H.-Y. Zhang, and Y. Fan. 2014. “Identification of Global Oil Trade Patterns: An Empirical Research Based on Complex Network Theory.” Energy Conversion and Management 85: 856–865. doi:10.1016/j.enconman.2013.12.072.
- Laner, D., and H. Rechberger. 2016. “Material Flow Analysis.” In Special Types of Life Cycle Assessment, edited by M. Finkbeiner, 293–332. Dordrecht: Springer Netherlands.
- Latapy, M. 2008. “Main-memory Triangle Computations for Very Large (Sparse (Power-law)) Graphs.” Theoretical Computer Science 407 (1): 458–473. doi:10.1016/j.tcs.2008.07.017.
- Lepawsky, J. 2015. “The Changing Geography of Global Trade in Electronic Discards: Time to Rethink the E-waste Problem.” The Geographical Journal 181 (2): 147–159. doi:10.1111/geoj.12077.
- Lepawsky, J., and C. McNabb. 2010. “Mapping International Flows of Electronic Waste.” The Canadian Geographer/Le Géographe Canadien 54 (2): 177–195. doi:10.1111/j.1541-0064.2009.00279.x.
- Ministry of Ecology and Environment of the People’s Republic of China. 2017. “Announcement of Releasing the Catalogues of Imported Wastes Management.” Announcement no. 39, 2017.
- Ministry of Ecology and Environment of the People’s Republic of China. 2018. “Announcement on Amending Catalogues of Imported Wastes Management.” Announcement no. 6, 2018.
- MSCI. 2019. “Msci Emerging Markets Index.” https://www.msci.com/emerging-markets
- Plastics Europe. 2008. The Compelling Facts About Plastics. Brussels: PlasticsEurope.
- Plastics Europe. 2018. Plastics—the Facts 2018. Brussels: PlasticsEurope.
- Plastics Insight. 2019a. “HDPE (High-density Polyethylene): Production, Market, Price and Its Properties.” https://www.plasticsinsight.com/resin-intelligence/resin-prices/hdpe/
- Plastics Insight. 2019b. “LDPE (Low-density Polyethylene): Production, Price and Its Properties.” https://www.plasticsinsight.com/resin-intelligence/resin-prices/ldpe/
- Plastics Insight. 2019c. “LLDPE (Linear Low-Density Polyethylene): Production, Price and Its Properties.” https://www.plasticsinsight.com/resin-intelligence/resin-prices/lldpe/
- Puckett, J., and C. S. Theodore. 2002. Exporting Harm: The High-Tech Trashing of Asia. Seattle, WA: Basel Action Network.
- Reintjes, M. 2018. “Malaysia Bans Import of Plastic Waste Recycling International.” https://recyclinginternational.com/plastics/malaysia-to-ban-import-of-all-plastic-scrap-within-three-years/
- Schmidt, C. W. 2006. “Unfair Trade: E-waste in Africa.” Environmental Health Perspectives 114 (4): a232–a5. doi:10.1289/ehp.114-a232.
- U.S. Environmental Protection Agency OoLaEM, Office of Resource Conservation and Recovery. 2018. Advancing Sustainable Materials Management: 2015 Tables and Figures.
- UN International Trade Statistics Knowledgebase. 2016 “Re-exports and Re-imports.” https://unstats.un.org/unsd/tradekb/Knowledgebase/Reexports-and-Reimports
- United Nations Comtrade Database. 2019. [Internet]. https://comtrade.un.org/data/
- Velis, C. 2014. Global Recycling Markets–Plastic Waste: A Story for One Player – China. Vienna: International Solid Waste Assosiation.
- Wang, C., L. Zhao, M. K. Lim, W.-Q. Chen, and J. W. Sutherland. 2020. “Structure of the Global Plastic Waste Trade Network and the Impact of China’s Import Ban.” Resources, Conservation and Recycling 153: 104591. doi:10.1016/j.resconrec.2019.104591.
- Wang, X., J. Ge, W. Wei, H. Li, C. Wu, and G. Zhu. 2016. “Spatial Dynamics of the Communities and the Role of Major Countries in the International Rare Earths Trade: A Complex Network Analysis.” PloS One 11 (5): e0154575. doi:10.1371/journal.pone.0154575.
- Zhong, W., H. An, L. Shen, T. Dai, W. Fang, X. Gao, D. Dong, et al. 2017. “Global Pattern of the International Fossil Fuel Trade: The Evolution of Communities”. Energy 123: 260–270. doi:10.1016/j.energy.2017.02.033.
- Zhong, W., H. An, X. Gao, and X. Sun. 2014. “The Evolution of Communities in the International Oil Trade Network.” Physica A: Statistical Mechanics and Its Applications 413: 42–52. doi:10.1016/j.physa.2014.06.055.
Appendix A
Countries and areas investigated
Appendix B
Commodity codes used
Appendix C.
Calculation methods for complex network indicators
(1) Average degree
The average degree of a network is the average number of edges that are adjacent to each node.
(2) Average weighted degree
The average weighted degree of a network is the average sum of the weights of edges adjacent to each node.
(3) Modularity class
Gephi adopts the Louvain method to calculate the modularity class of each node (Blondel et al. Citation2008).
(4) Density
The density of a network is the number of existing edges divided by the number of all possible edges among all nodes in the network.
(5) Average clustering coefficient
The clustering coefficient of a node is the number of edges connecting the neighbors of the node divided by all possible edges among the neighbors of this node. The average clustering coefficient of a network is the average of the clustering coefficients of all nodes in the network. Gephi implements the algorithm of Latapy to calculate average clustering coefficients (Latapy Citation2008).
(6) Average path length
One pair of connected nodes has graph distance 1. The average path length of a network is the average graph distance between all pairs of nodes in the network. Gephi implements the algorithm of Brandes to calculate average path lengths (Brandes Citation2001).
(7) Diameter
The diameter of a network is the maximum graph distance between any pair of nodes in the network. Gephi implements the algorithm of Brandes to calculate diameters (Brandes Citation2001).