
 ?Mathematical formulae have been encoded as MathML and are displayed in this HTML version using MathJax in order to improve their display. Uncheck the box to turn MathJax off. This feature requires Javascript. Click on a formula to zoom.
ABSTRACT
In order to understand better on medium-and long-term climate change issues in international cooperation of the Belt and Road Initiative (BRI), this paper is meant to assess the implementation of National Determined Contributions (NDCs) of the BRI countries and the emission constraints under the Paris Agreement to hold the increase in the global average temperature to well below 2°C above pre-industrial levels, based on the Belt and Road Integrated Assessment Model (BRIAM) and the best available data. The results show that the BRI countries are expected to collectively reduce about 3.2 billion tons of CO2 emissions with the implementation of their NDCs by 2030. In order to achieve the global goal of 2°C, without appropriate mitigation burden sharing and enhanced climate finance support, the BRI countries will face big challenges to bridge the emission gaps. The investment in clean energy and related new infrastructures in BRI will rise sharply to above US$100 trillion by the end of this century accordingly with the increase in carbon price, which will also eventually have a significant impact on the price of electricity and oversea freight transport in a connecting world.
Introduction
The low-carbon development of the Belt and Road Initiative (BRI) has received increasing attention along with the global implementation of the Paris Agreement and its Rulebook. Until the end of 2018, a total of 120 countries have signed collaborative agreements with China to jointly pursue this initiative. These Belt and Road countries account for roughly 60% of the global population, 33% of the global economy, 55% of the global energy consumption, and 59% of the Greenhouse Gases (GHG) emissions. The majority of those countries are developing countries, with fragile ecology system, poor infrastructure, and high vulnerability to climate change (Dong et al. Citation2018). At the same time, those countries are experiencing rapid economic growth with relatively high energy and carbon intensity, becoming the main sources of growth in global energy consumption and GHG emissions in the future. How to avoid the “lock-in” effects on newly built infrastructures and promote low emission and climate-resilient development in these countries would be critical in achieving global long-term goals of the Paris Agreement. Based on the global analytical model and the latest available data, this study conducted the scenario analysis to evaluate the implementation status and gaps in fulfilling the National Determined Contributions (NDCs) of BRI countries as well as the needs in achieving the global well below 2°C target that has been set up in the Paris Agreement. Grounded on the analysis, this study further provided policy recommendations for how to pursue increased ambition in addressing climate change and promote enhanced multilateral cooperation with BRI countries.
GHG Emissions and Current Climate Policies in the BRI Countries
The countries along the Belt and Road, with petroleum exporting and emerging economies in the list, are the major supplier of natural resources and manufacturer of commodities, and also the sources of the recent growing GHG emissions in part, due to the global division of labor. Some disputes on such potential environmental and climate risk are increasing (Wang Citation2015). Statistics shows that the BRI countries accounted for 75% of global oil supply, 57% of natural gas supply, and 69% of coal supply in 2015. From 2000 to 2015, the CO2 emissions in the BRI countries increased by about 85%, which is more than twice the global average. At the same time, the carbon emissions per unit GDP in the BRI countries are relatively high. In 2015, it was 0.83 t CO2/k US$ (excluding China, 0.63 t CO2/k US$), which was about 1.8 times that of the world average (0.46 t CO2/k US$) and three times that of other countries (0.28 t CO2/k US$). It indicates that the economic growth of the BRI countries is carbon-intensive (Chai, Qi, and Fu Citation2017; Qi, Fan, and Yang et al. Citation2017). Shifting the perspective from total to average, the per capita energy and electricity consumption of the BRI countries were only about 80% of the global average and the per capita emissions were about 2.8 t CO2, less than 60% of the global average in 2015. With the industrialization and urbanization process moving on, the BRI countries will highly contribute to large energy consumption growth in the coming decades.
Since the BRI has been evolving rapidly, the early studies on this topic were limited in geographical coverage and agenda-setting (Ouyang Citation2017). Some literatures studied the 64 countries along the ancient Silk Road; however, they are not fully overlapped with the BRI today (Liu Citation2019; Wu et al. Citation2019; Yang, Guo, and Xiao Citation2016). Others put their eyes on geopolitical issues, such as the social-economical influence on the international landscape, the rise and fall of the great powers (Liu, Dunford, and Gao Citation2017; Scobell, Lin, and Shatz et al. Citation2018). In the latest studies, some has moved the focuses onto the fossil energy investment in the BRI countries, for instance, financing the oil and gas exploitation and the coal power plants (Li, Huang, and Tian Citation2019; Yuan et al. Citation2019; Duan et al. Citation2018; Zhang Citation2019; Zhang, Fu, and Pu Citation2019; Gallagher and Qi Citation2018). Those literatures intended to take stock of the changes in overseas trade and investment between China and other BRI countries from a bottom-up perspective with data sources collected online. More and more expected to explore the potential of sustainable infrastructure investment in green BRI, including regional cooperation and case studies on the non-fossil energy development and providing policy recommendations for enabling environment (Zhao et al. Citation2019; Shuai et al. Citation2018; Xu et al. Citation2017; Han et al. Citation2018; Wang, Zhang, and Hu Citation2019; Wu and Sun Citation2018; Liu, Zhang, and Zhu Citation2018; Sun and Jiang Citation2018; Chen and Che Citation2018; Wang Citation2018; Wang, Zhang, and Wang et al. Citation2018; Yu, Jiao, and Gao Citation2018). In addition, some specialized research has investigated the issues like energy efficiency, total factor productivity, and technological change, and partially summarize the characteristics of energy consumption and carbon emissions in the BRI countries (Huang Citation2019; Liu and Hao Citation2018; Liu and Xin Citation2019; Fan et al. Citation2019; Long Citation2019; Yang and Wei Citation2018; Ma and Liu Citation2017). It seems that the existing literatures are insufficient in systematically analyzing the long-term low greenhouse gas emission development strategies for BRI countries. No comprehensive analytical framework has been set up for supporting such integrated assessment on the needs of clean energy investment, carbon price, and other policy-induced change, etc.
In fact, preliminary and qualitative analysis has been conducted regarding the climate policy collaboration among BRI countries (Chai, Qi, and Fu Citation2017; Qi, Fan, and Yang et al. Citation2017; Ding and Zhang Citation2018; Liu, Zheng, and Yu Citation2019; Xiao Citation2018; Liang Citation2017), and a sub-initiative to establish a Belt and Road low-carbon community was proposed. However, quantitative analysis is also required to underpin those policy discussions. New studies related to Global Stocktake under the Paris Agreement provide a solid basis of information sources and policy database for the integrated assessment (Chai, Fu, and Qi et al. Citation2018; Qi, Chai, and Liu et al. Citation2018; Chai et al. Citation2017). By 2018, 121 countries (including China) in BRI have signed and ratified the Paris Agreement, including 20 Annex I Parties (15 EU member states) and 101 non-Annex I Parties under the United Nations Framework Convention on Climate Change (UNFCCC). Except for Libya, all countries in BRI submitted Intended National Determined Contributions (INDCs) or National Determined Contributions (NDCs) under the Paris Agreement. Those countries have successively introduced a series of climate policies in various sectors including industry, energy, building, transportation, agriculture, forestry, and waste management. With the exception of Turkey, all the developed countries, including three Economies in Transition as Russia, Ukraine, and Belarus, have set absolute GHG emission reduction targets by 2030. Among that, 65 developing Parties have proposed the conditional emissions reduction targets appealing to the support of finance, technology transfer, and capacity building from the developed Parties; 45 developing Parties have raised the emission deviation targets from the Business-As-Usual scenarios; 14 developing Parties have put forward the absolute emissions reduction targets as the developed Parties; and 7 developing Parties (including China) have present the relative emission reduction targets, which is the carbon intensity per unit of GDP. Besides that, 12 developing Parties have not proposed quantitative targets and 5 only proposed the target by 2025. In addition, China, South Korea, Kazakhstan, New Zealand, and 15 EU member states have also proposed policies to establish emission trade markets. Those above helps set the scene for this study.
The Belt and Road Integrated Assessment Model and Its Scenarios
The BRIAM Model
This study used a multiregional hybrid model BRIAM (the Belt and Road Integrated Assessment Model) to evaluate the implementation of NDCs and the emission pathways consistent with 2°C scenarios for both BRI countries and the rest of world. The BRIAM, as shown in , was secondarily developed from a global model IAMC (Chai Citation2010; Chai and Zhang Citation2010; Chai and He Citation2013; Chai and Xu Citation2014, Citation2015) based on GAMS (the General Algebraic Modeling System), which is composed of a partial equilibrium module FIT (Finance, Infrastructure, and Trade) with sub-sectors such as macro-economy and trade, finance, energy/power, transportation, agriculture, forest, and land use, and has a soft link with simplified climate and air pollution model by using the impact/adaptation cost curves. Probability density on consumption and investment preference for the typical countries and regions as agents can be simulated in a limited manner.
Figure 1. The Belt and Road Integrated Assessment Model (BRIAM).
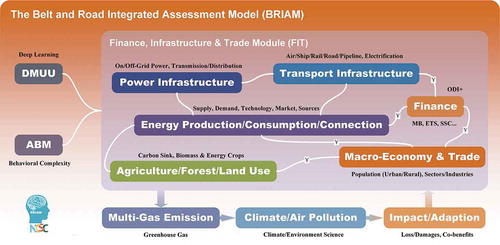
In order to highlight the scarcity of GHG emission space, the production and expenditure functions in the BRIAM were modified to cover the cost of mitigation, adaptation, and residual damage with inter-temporal optimization of social welfare (Chai Citation2010).
The primary nested function (1) illustrated that the total output is the CES function of value-added inputs
and carbon asset inputs
, and the secondary nested function (2) represented that the value-added inputs
is the CES function of capital inputs
and labor inputs
. Here,
,
and
are the share parameters, and 0 < α, β, γ < 1. The
indicates the impacts of climate change on the factor productivities, and
,
and
indicate technological change parameters of production factors, namely non-price-induced technological change. The indexes
and
are related to the elasticity of substitution.
The gross expenditure of the countries or regions is distributed among consumption , investment
, trade
and climate change finance flow, as illustrated in (3). Thereinto,
,
and
is the expenditure on mitigation, adaptation, and market loss of climate change impacts for region
in time period
.
is the financial support received, while for the donor countries or regions,
, and for the recipient countries or regions,
.
The model further applied the Carbon Equity Indicator as the constraint, and its expression is shown in (4) (Chai and He Citation2013). Thereinto,
is the initial coefficient based on cumulative per capita emission
and a carbon Lorentz curve (Teng, He, and Pan et al. Citation2010; Padilla and Serrano. Citation2006), and
is the adjusted coefficient based on cumulative per capita GDP loss
, which is the dependent variable on the net climate finance flow
.
In order to analyze the green development of BRI in the global context and make it available for comparison and communication with other modeling results, the BRIAM model used Region Code 5 (RC5) of Intergovernmental Panel on Climate Change (IPCC) (IPCC Citation2014a), but a further distinction was made between the developed countries/developing countries or the BRI countries/other countries. As shown in , the region categorization in the model included the European Union (EU28/EU28-BRI), the United States (USA), Japan (JPN), Economies in Transition (EIT-BRI/EIT-AI-BRI), other OECD (X-OECD90/X-OECD90-BRI), China (CHN-BRI), India (IND), South Korea (KOR-BRI), Southeast Asia (ASEAN-BRI), other Asia (X-ASIA/X-ASIA-BRI), Latin America & Caribbean (LAM/LAM-BRI), Middle East & North Africa (MNA-BRI), Sub-Saharan Africa (SSA and SSA-BRI), and International Transport.
Table 1. The Region Categorization in BRIAM Model.
The Scenarios
In this study, three clusters of scenarios were simulated, as shown in . In the BAU Scenario, the world will fully implement its pledges under the Cancun Agreement, which means the developed countries will achieve their Quantified Emissions Reduction and Limitation Objectives (QERLOs) under the UNFCCC and its Kyoto Protocol by 2020, while the developing countries will implement the Nationally Appropriate Mitigation Actions (NAMAs) under the UNFCCC in the meantime. Policies after the year 2020 will be frozen in the BAU Scenario. The NDC Scenario was based on the first INDCs/NDCs submitted under the Paris Agreement, taking into account the conditional or unconditional pledges of the developing countries. Policies after the year 2030 or 2025 for rare cases will be frozen in the NDC Scenario. The 2°C Scenario’s carbon budget was consisting with the Representative Concentration Pathways of 2.6 W/m2 (RCP2.6) in the IPCC Fifth Assessment Report (AR5) database (IPCC Citation2014a; IIASA Citation2014) with no delay since the year 2020.
Table 2. The Storyline of the Three Scenarios.
The AR5 indicates limiting total human-induced warming to less than 2°C relative to the period 1861–1880 with a probability of greater than 66% would require cumulative CO2 emissions from all anthropogenic sources since 1870 to remain below about 2900 Gt, and about 1900 Gt CO2 had already been emitted by 2011. Thus, the 2°C Scenario adopts the 1000 Gt cumulative CO2 emissions from 2011 to 2100 as a global budget (IPCC Citation2014a). Here, the BRIAM applied least-cost approach and intertemporal optimization for burden-sharing among the countries and regions in this study, and assumed a forward-looking scenario for the perfect foresight and decision-making (Höhne, Elzen, and Escalante Citation2014).
Based on the projections and data sources from UN-Habitat (UNDEDA Citation2017), World Bank, International Monetary Fund, International Energy Agency (IEA Citation2019), and IPCC (IPCC Citation2014b, Citation2018), the assumption of the population and economic growth was streamlined for the scenarios.
The global population is projected to rise from about 7.2 billion in 2015 to about 9.0 billion in 2050, as shown in . The population of the BRI countries will grow from about 4.3 billion in 2015 to 5.4 billion in 2050, and its increment will be 1.5 times that of other countries. Thereinto, Sub-Saharan Africa, Middle East & North Africa, and Southeast Asia will be the major source of population growth in the BRI Countries.
Table 3. Global Population 2005–2100 for Scenarios (Million).
The average economic growth in the BRI countries was estimated to reach 4.3% annually by 2050, 1.6 times that of other countries, as shown in . The total GDP of BRI countries will hit 80 trillion (2010US$) in 2050, exceeding the global GDP in 2015. The per capita GDP of the BRI countries will also rise from 5,600 (2010US$) in 2015 to about 19,000 (2010US$) in 2050. It is still far behind the level of other countries (35,000, 2010US$), yet with a narrowing gap. Thereinto, Sub-Saharan Africa, Middle East & North Africa, Southeast Asia, China, and Economies in Transition will be the major drivers of economic growth in the BRI Countries.
Table 4. Global GDP 2005–2100 for Scenarios (Billion 2010US$).
Preliminary Analysis on Modeling Results
The climate change issue in BRI is diverse, complex, and dynamic. This study presented some preliminary findings to facilitate the communication and further insights. Based on the modeling results, we could see that the BRI Countries will embrace prominent change in CO2 emission, energy consumption, infrastructure investment, and factor price, if the Paris Agreement is effectively implemented by all Parties from the year 2020 and on.
This study assumes full effective implementation of NDCs in the BRI and other countries under the Paris Agreement. However, as the actions and supports provided in Parties’ NDCs were proposed in a bottom-up way and nationally determined manner, which is not legally binding to a certain extent. Some NDCs are subject to conditions related to finance and technology transfer, such assumption would bring the uncertainty to the estimates of emission trajectory under the Scenarios. In addition, there are many other factors that may influence the mitigation pathways, including socio-economic factors are: (1) variations in long-term socioeconomic conditions; (2) uncertainties diffusion from historical emission inventories; (3) the availability and cost of new technologies; (4) chaos factors of the complex climate systems, etc.
CO2 Emission
The CO2 emission projection of the BRI and other countries, including regional and sectoral distribution, is shown in –. In the BAU Scenario, the total CO2 emissions from fossil fuel combustion and industrial process in the BRI countries will grow from approximately 20.0 Gt in 2015 to about 27.7 Gt in 2030 and 38.1Gt in 2050. In the NDC Scenario, the BRI countries are expected to reduce CO2 emissions by about 3.2 Gt in 2030 and 9.0 Gt in 2050, and will significantly contribute to the global low emission development. Nevertheless, due to the poverty eradication and development imperative, the region in total still accounts for about 90% of the global emission growth by 2050. In the 2°C scenario, the BRI countries will be further to reduce emissions by about 8.0 Gt and 25.0 Gt in addition to their first NDCs in 2030 and 2050, respectively.
It implies that the current climate policies and actions in the BRI countries without the support of finance, technology transfer, and capacity building are not yet ambitious enough. However, efforts in other countries are also insufficient to fulfill the global 2°C goal. The world should achieve climate-neutral or net-zero carbon emission around 2060. That will bring mega challenges to the developing countries. Additional mitigation contribution and equitable burden-sharing are simultaneously required under the Paris Agreement, and the world as a whole needs to step forward with updating and enhancing its action, support, and international cooperation for climate change.
Figure 2. CO2 Emissions of BRI Countries in Three Scenarios (2005–2100).
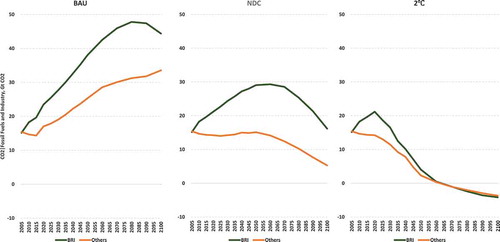
Figure 3. Regional CO2 Emission of BRI Countries (2015, 2030&2050).
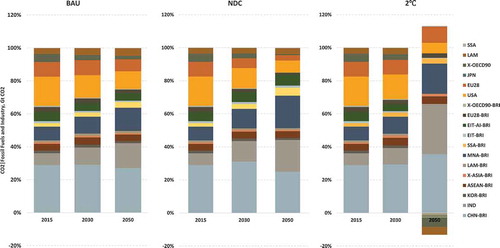
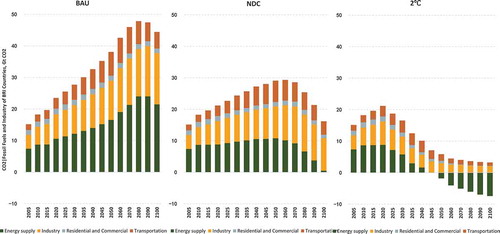
Among the BRI countries, both in the BAU and NDC scenarios, the Middle East & North Africa, Sub-Saharan Africa, Latin America & Caribbean, and Southeast Asia are the major contributors to the emission growth, with the annual rate of 1.8%~3.4% in BAU Scenario and 0.9%~3.3% in NDC Scenario by 2050. On the other side, India would be the biggest contributor to the emission growth outside the BRI, with an annual rate of 4.0% in BAU Scenario and 3.7% in NDC Scenario by 2050. In the 2°C Scenario, most OECD countries, together with some Latin America & Caribbean countries, will achieve climate neutral by 2050. An economy-wide deep carbonization is definitely required in the 2°C Scenario, among that the energy supply would be the first sector to be carbon neutral ever around 2045 and then turn into the negative emission.
Figure 4. Sectoral CO2 Emission of BRI Countries (2005–2100).
Energy Consumption
The total energy consumption and mix change of the BRI countries are shown in . In the NDC Scenario, the share of non-fossil fuels in primary energy consumption of the BRI countries will increase from approximately 12.2% in 2015 to 14.7% in 2030 and 18.9% in 2050. The share of non-fossil electricity in the total installed power capacity will increase from approximately 27.5% in 2015 to 32.3% in 2030 and 35.9% in 2050. In the 2°C Scenario, the total energy consumption will reduce by approximately 30% by the end of this century, and the coal consumption will phase out around the year 2045 in the BRI countries. The share of non-fossil fuels in primary energy consumption of the BRI countries will rise to about 21.4% in 2030 and 46.2% in 2050. The share of non-fossil electricity in the total installed power capacity will reach about 40.8% in 2030 and 61.2% in 2050. Meantime, about 40.7% of the fossil fuel use needs to be facilitated with Carbon Capture and Storage (CCS) by 2050.
Figure 5. Total Energy Consumption and Mix of BRI Countries (2005–2100).
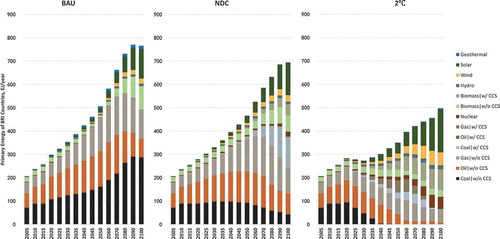
Such significant changes in the energy sector request the BRI countries to speed up the low emission transition, by not only the ambitious public policy, subsides, and finance support but also the profound institutional reform, market innovation, and technology development. The application of cross-border information and communication technology and financial technology will also greatly promote the revolution of energy supply and consumption.
Finance Needs
The finance needs typically in the energy supply sector of the BRI countries are shown in . In the NDC Scenario, the annual investment in clean energy and related infrastructure in the BRI countries will increase from approximately US$ 281.9 billion in 2015 to US$ 530.1 billion in 2050, exceeding that of other countries. In the 2°C Scenario, the annual investment in the BRI countries will be doubled to approximately US$ 1.1 trillion by 2050. The cumulative investment in clean energy and related new infrastructure from 2015 to 2050 is about US$ 21.8 trillion in total in the 2°C Scenario, which is US$ 7.9 trillion more than in the NDC Scenario. And the BRI countries will need to accumulatively increase their investment by an additional US$ 78.4 trillion from the mid-century to 2100.
Table 5. Finance Needs of BRI Countries (Trillion US$).
The gross investment in energy supply by the end of this century was projected to vary slightly; however, the investment makeup in the BRI countries will shift markedly from traditional fossil fuels toward the greener sectors, especially in non-hydro renewable power plants, smart grids, energy storage, hydrogen facilities, carbon capture and storage, and other sustainable infrastructure. The cumulative investment in fossil fuel will drop dramatically from US$ 70.6 trillion in the BAU Scenario to US$ 59.7 trillion in the NDC Scenario and US$ 27.8 trillion in the 2°C Scenario, respectively. If the decision-makers in the market keep the traditional profiles theory in BRI in a 2°C constraint world, then the investment will be very likely to turn into the stranded assets.
Carbon Price
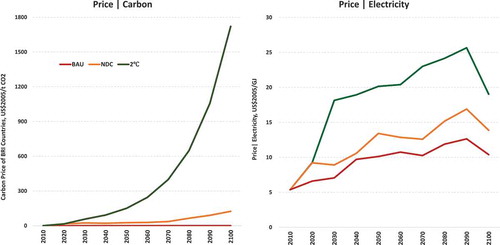
The price variation of CO2 and electricity in the BRI countries are shown in . In the NDC Scenario, the carbon price in the BRI countries will rise to around 24 US$/ton CO2 in 2030 and sustain at this level until the 2070 s then followed a distinct increase. In the 2°C Scenario, the carbon price in the BRI countries will increase to about 57 US$/ton CO2 in 2030 and rise sharply to around 150 US$/ton CO2 in 2050. The marginal cost of CO2 emission reduction in the second half of this century will become very high. Accordingly, the electricity price will also increase with the amplified mitigation efforts, which is expected to be 1.7 to 3.8 times that of the 2015 price. The logistics cost of international trade will also increase with the rising energy and carbon price. The changes above will undoubtedly exert impacts on the investment of the energy-intensive manufacture and international trade between the BRI countries.
Figure 6. Carbon and Electricity Price Variation in BRI Countries (2005–2100).
Conclusions
Faced with common challenges in protecting the ecological environment and addressing climate change, the BRI countries are simultaneously going through green and low-carbon transition on an unprecedented scale. The structural evolvement in energy consumption, investment, and price, in the complicated and ever-changing international environment, will further substantiate the pragmatic cooperation of BRI countries on green technology, green trade, green capacity, and green finance.
The BRI countries should strengthen the long-term low emission development strategic planning on enhancing climate actions and collaborations under multilateral and bilateral mechanisms, to jointly promote the comprehensive, balanced and effective implementation of the Paris Agreement. Regarding the projected rising CO2 emissions and inappropriate burden sharing, the BRI countries need to promote consensus and find out the fair, just and mutually beneficial solutions to collectively racket up the climate action and support toward achieving the purpose of the Paris Agreement and its long-term goals. Financial and technical support to Sub-Saharan Africa, Southeast Asia, and those that are particularly vulnerable to the adverse effects of climate change should be considered.
The BRIAM model and its scenarios should be improved with the best available inputs on other non-energy infrastructures, green finance resources, and the specific needs and special circumstances of developing countries in the BRI. Besides the traditional financial market, credit, business, legal, and compliance risks, the climate risk assessment methodology needs to be integrated into the investment and financing decision-making process for the BRI countries, through scientifically assessing the potential climate change impact at sector and industrial levels, conducting necessary climate risk stress tests, and effectively carrying out risk mitigation and management. It is also worth noting that the BRI countries are heterogeneous in the levels of the social-economic development. Therefore, climate risk assessments should be pragmatic, effective, feasible, and sustainable and based on the specific needs and special circumstances of local stakeholders.
In such a new era for the global geopolitical and ecosystem change, the Belt and Road Initiative should explore and pursue a new growth pathway driven by the scientific and technological innovation, industrial and energy revolution, to mitigate the social-economical costs of the development-induced ecological environment and climate change, and avoid the high-carbon lock-in trap. The Initiative should also raise the ambition on high-quality green investment and employment, share the green benefits of low emission development transition, and build the community with a shared climate-neutral future.
Acknowledgments
The National Key Research and Development Program of the Ministry of Science and Technology, the Special Project of Global Change and Response “The Modality Design and Key Scientific Issues Study on the Stocktaking of Nationally Determined Contributions of Carbon Emission Reduction,” “The Framework and System Design of the Global Stocktake” (Approval Number: 2017YFA0605301).
Disclosure statement
No potential conflict of interest was reported by the authors.
Additional information
Funding
References
- Chai, Q. 2010. Global Change Integrated Assessment Model for China (IAMC) and Sequential Decision Making under Uncertainty [D]. Beijing: Tsinghua University.
- Chai, Q., and H. Xu. 2014. “Modeling an Emissions Peak in China around 2030: Synergies or Trade-offs between Economy, Energy and Climate Security [J].” Advances in Climate Change Research 5: 169–11. doi:10.1016/j.accre.2015.06.001.
- Chai, Q., and H. Xu. 2015. “Modeling Carbon Emission Peaking Pathways in China Based on Integrated Assessment Model IAMC [J].” China Population, Resources and Environment 25 (6): 37–46.
- Chai, Q., and J. He. 2013. “Climate Equity: Concepts, Politics and Integrated Assessment – How to Comprehensively Apply the Principle of Common but Differentiated Responsibilities in Durban Platform [J].” China Population, Resources and Environment 23 (6): 1–7.
- Chai, Q., and X. Zhang. 2010. “Technologies and Policies for the Transition to a Sustainable Energy System in China [J].” Energy 35 (10): 3995–4002. doi:10.1016/j.energy.2010.04.033.
- Chai, Q., S. Fu, H. Xu, W. Li, and Y. Zhong. 2017. “The Gap Report of Global Climate Change Mitigation, Finance, and Governance after the United States Declared Its Withdrawal from the Paris Agreement [J].” Chinese Journal of Population, Resources and Environment 15 (3): 196–208. DOI:10.1080/10042857.2017.1365450.
- Chai, Q., S. Fu, Y. Qi, X. Fan, & X. Wen. 2018. “The Implementation, Updating and Convergence of Nationally Determined Contributions to Addressing Climate Change [J].” China Development Observation 10: 25–29.
- Chai, Q., Y. Qi, and S. Fu. 2017. “Jointly Construction of A Low Carbon Community in the Belt and Road Initiative [J].” China Development Observation Z2: 35–40.
- Chen, X., and Z. Che. 2018. “The Basis, Model and Mechanism of New Energy Cooperation between China and Countries along the Belt and Road [J].” Journal of Xinjiang University (Philosophy, Humanities & Social Sciences) 46 (5): 9–15.
- Ding, J., and C. Zhang. 2018. “The Belt and Road Construction and Global Climate Governance [J].” Modern International Relations 09: 53–59+43.
- Dong, T., W. Dong, Y. Guo, J. Chou, S. Yang, D. Tian, and D. Yan. 2018. “Future Temperature Changes over the Critical Belt and Road Region Based on CMIP5 Models [J].” Advances in Climate Change Research 9 (1): 57–65. DOI:10.1016/j.accre.2018.01.003.
- Duan, F., Q. Ji, B. Liu, and Y. Fan. 2018. “Energy Investment Risk Assessment for Nations along China’s Belt & Road Initiative [J].” Journal of Cleaner Production 170: 535–547. doi:10.1016/j.jclepro.2017.09.152.
- Fan, J., Y. Da, S. Wan, M. Zhang, Z. Cao, Y. Wang, and X. Zhang, et al. 2019. “Determinants of Carbon Emissions in ‘Belt and Road Initiative’ Countries: A Production Technology Perspective [J].” Applied Energy 239: 268–279. doi:10.1016/j.apenergy.2019.01.201.
- Gallagher, K., and Q. Qi. 2018. China’s Overseas Development Finance Implications for Climate Change [R]. Cambridge: Tufts University.
- Han, L., B. Han, X. Shi, B. Su, X. Lv, and X. Lei. 2018. “Energy Efficiency Convergence across Countries in the Context of China’s Belt and Road Initiative [J].” Applied Energy 213: 112–122. doi:10.1016/j.apenergy.2018.01.030.
- Höhne, N., M. Elzen, and D. Escalante. 2014. “Regional GHG Reduction Targets Based on Effort Sharing: A Comparison of Studies [J].” Climate Policy 14 (1): 122–147. doi:10.1080/14693062.2014.849452.
- Huang, Y. 2019. “Environmental Risks and Opportunities for Countries along the Belt and Road: Location Choice of China’s Investment [J].” Journal of Cleaner Production 211: 14–26. doi:10.1016/j.jclepro.2018.11.093.
- IEA. 2019. World Energy Statistics and Balances [R]. Paris: International Energy Agency.
- IIASA. 2014. AR5 Scenario Database [EB/OL]. https://secure.iiasa.ac.at/web-apps/ene/AR5DB/dsd?Action=htmlpage&page=about
- IPCC. 2014a. “Climate Change 2014: Synthesis Report.” Contribution of Working Groups I, II and III to the Fifth Assessment Report of the Intergovernmental Panel on Climate Change. Geneva: IPCC.
- IPCC. 2014b. “Climate Change 2014: Mitigation of Climate Change.” Contribution of Working Group III to the Fifth Assessment Report of the Intergovernmental Panel on Climate Change [R]. Cambridge and New York: Cambridge University Press.
- IPCC. 2018. “Global Warming of 1.5°C.” An IPCC Special Report on the impacts of global warming of 1.5°C above pre-industrial levels and related global greenhouse gas emission pathways, in the context of strengthening the global response to the threat of climate change, sustainable development, and efforts to eradicate poverty [R]. Geneva: World Meteorological Organization.
- Li, H., Y. Huang, and S. Tian. 2019. “Risk Probability Predictions for Coal Enterprise Infrastructure Projects in Countries along the Belt and Road Initiative [J].” International Journal of Industrial Ergonomics 69: 110–117. doi:10.1016/j.ergon.2018.10.006.
- Liang, X. 2017. “International Energy Cooperation under the Belt and Road Strategy – From the Perspective of the Paris Agreement on Climate Change [J].” Theory Monthly 05: 161–164.
- Liu, B., Y. Zhang, and T. Zhu. 2018. “Research on Energy Cooperation between China and BRI Countries [J].” Crossroads: Southeast Asian Studies 5: 10–21.
- Liu, W. 2019. Joint Construction of Green Silk Road: Social, Economic and Environmental Context [R]. Beijing: Commercial Press.
- Liu, W., M. Dunford, and B. Gao. 2017. “Discursive Construction of the Belt and Road Initiative: From Neoliberal to Inclusive Globalization [J].” Progress in Geography 36 (11): 1321–1331.
- Liu, Y., J. Zheng, and X. Yu. 2019. “European Union Environment and Climate Mainstreaming Experience and Its Enlightenment for Promoting Belt and Road Initiative Green Investment and Finance [J].” Environmental Protection 47 (5): 64–70.
- Liu, Y., and Y. Hao. 2018. “The Dynamic Links between CO2 Emissions, Energy Consumption and Economic Development in the Countries along “The Belt and Road” [J].” Science of the Total Environment 645: 674–683. doi:10.1016/j.scitotenv.2018.07.062.
- Liu, Z., and L. Xin. 2019. “Has China’s Belt and Road Initiative promoted its green total factor productivity?– Evidence from primary provinces along the route [J].” Energy Policy 129: 360–369. doi:10.1016/j.enpol.2019.02.045.
- Long, Y. 2019. “Establishment of New Mechanism of Carbon Emission Reduction for Belt and Road Countries [J].” Journal of Accounting and Economics 33 (2): 101–110.
- Ma, Z., and Y. Liu. 2017. “Spatio-temporal Patterns of Key Climate Technology Innovation Differences: A Case of Countries along the Belt and Road [J].” China Population, Resources and Environment 27 (9): 102–111.
- Ouyang, X. 2017. “Reflection on Climate Change and Induced Security Risks under the Belt and Road Initiative [J].” Modern Economic Information 12: 1–2+4.
- Padilla, E., and A. Serrano. 2006. “Inequality in CO2 Emissions across Countries and Its Relationship with Income Inequality: A Distributive Approach [J].” Energy Policy 34: 1762–1772. doi:10.1016/j.enpol.2004.12.014.
- Qi, Y., Q. Chai, G. Liu, X. Fan, Y. Zhong, and A. Ma. 2018. “A Stock-take on Developed Countries’ Pre-2020 Climate Action and Support [J].” Climate Change Research 14 (5): 522–528.
- Qi, Y., X. Fan, J. Yang, and Q. Chai. 2017. “Outlook and Recommendation on International Climate Cooperation in the Belt and Road Initiative [J].” China Economic & Trade Herald 17: 40–43.
- Scobell, A., B. Lin, H. Shatz, M. Johnson, L. Hanauer, M. Chase, A. Cevallos, I. Rasmussen, A. Chan, A. Strong, E. Warner, and L. Ma. 2018. At the Dawn of Belt and Road: China in the Developing World [R]. Santa Monica: RAND Corporation.
- Shuai, J., C. Chen, J. Cheng, Z. Leng, and Z. Wang. 2018. “Are China’s Solar PV Products Competitive in the Context of the Belt and Road Initiative [J].” Energy Policy 120: 559–568. doi:10.1016/j.enpol.2018.05.042.
- Sun, J., and X. Jiang. 2018. “Current Situation, Challenges and Strategies of Energy Cooperation between China and the Middle East under the Belt and Road Initiative [J].” Journal of International Economic Cooperation 10: 67–72.
- Teng, F., J. He, X. Pan, and C. Zhang. 2010. “How to Measure Carbon Equity: Carbon Gini Index Based on Historical Cumulative Emission per Capita [J].” Advances in Climate Change Research 6 (6): 449–455.
- UNDEDA. 2017. World Population Prospects: The 2017 Revision [R]. New York: United Nations.
- Wang, C., H. Zhang, F. Wang, and Y. Ye. 2018. “The Process and Outlook of Energy Development in ASEAN Countries along the Belt and Road [J].” Science and Technology Management Research 38 (16): 240–244.
- Wang, L. 2018. “Issues and Countermeasures of Energy Cooperation between China and Asian Countries under the Background of the Belt and Road Initiative [J].” Practice in Foreign Economic Relations and Trade 09: 37–40.
- Wang, S., H. Zhang, and L. Hu. 2019. “Study on Location Selection of Clean Energy Investment in the Belt and Road Countries [J].” International Project Contracting & Labour Service 1: 51–54.
- Wang, Z. 2015. “Climate Security Risks Associated with China’s Belt and Road Initiative [J].” The Journal of International Studies 36 (4): 56–72+6.
- Wu, L., and L. Sun. 2018. “Analysis of Energy Trade Competitiveness and Complementarity between China and the Belt and Road Countries [J].” Productivity Research 11: 77–81.
- Wu, S., L. Liu, Y. Liu, J. Gao, E. Dai, A. Feng, and W. Wang. 2019. “The Belt and Road: Geographical Pattern and Regional Risks [J].” Journal of Geographical Sciences 29 (4): 483–495. DOI:10.1007/s11442-019-1611-4.
- Xiao, F. 2018. “Innovation of the Implementing Mechanism of China for the Paris Agreement against the Background of the Belt and Road Initiative [J].” Journal of Customs and Trade 39 (4): 113–124.
- Xu, L., X. Fan, W. Wang, L. Xu, Y. Duan, and R. Shi. 2017. “Renewable and Sustainable Energy of Xinjiang and Development Strategy of Node Areas in the Silk Road Economic Belt [J].” Renewable and Sustainable Energy Reviews 79: 274–285. doi:10.1016/j.rser.2017.05.031.
- Yang, T., Q. Guo, and T. Xiao. 2016. “Research on Distribution Characteristics of Natural Disasters along the Belt and Road [J].” Journal of Safety Science and Technology 12 (10): 165 171.
- Yang, Z., and X. Wei. 2018. “Total Factor Energy Efficiency of the Regions along the Belt and Road: Measurement, Decomposition and Influence Factors Analysis [J].” China Environmental Science 38 (11): 4384–4392.
- Yu, X., J. Jiao, & Q. Gao. 2018. “Research on the Innovation of International Energy Cooperation Model under the OB&OR Strategy [J].” Scientific Management Research 36 (4): 112–115.
- Yuan, J., X. Li, C. Xu, C. Zhao, and Y. Liu. 2019. “Investment Risk Assessment of Coal-fired Power Plants in Countries along the Belt and Road Initiative Based on ANP-Entropy-TODIM Method [J].” Energy 176: 623–640. doi:10.1016/j.energy.2019.04.038.
- Zhang, C., J. Fu, and Z. Pu. 2019. “A Study of the Petroleum Trade Network of Countries along the Belt and Road Initiative [J].” Journal of Cleaner Production 222: 593–605. doi:10.1016/j.jclepro.2019.03.026.
- Zhang, J. 2019. “Oil and Gas Trade between China and Countries and Regions along the Belt and Road: A Panoramic Perspective [J].” Energy Policy 129: 1111–1120. doi:10.1016/j.enpol.2019.03.020.
- Zhao, Y., X. Liu, S. Wang, and Y. Ge. 2019. “Energy Relations between China and the Countries along the Belt and Road: An Analysis of the Distribution of Energy Resources and Interdependence Relationships [J].” Renewable and Sustainable Energy Reviews 107: 133–144. doi:10.1016/j.rser.2019.03.007.