
 ?Mathematical formulae have been encoded as MathML and are displayed in this HTML version using MathJax in order to improve their display. Uncheck the box to turn MathJax off. This feature requires Javascript. Click on a formula to zoom.
ABSTRACT
Introduction
One of the most striking features of urbanization is the replacement of the original natural land cover type by artificial impervious surface area (ISA). However, the extent of the contribution of various environmental factors, especially the growth of 3D space to ISA expansion, and the scope and mechanism of their influences in dramatically expanding cities, are yet to be determined. The boosted regression tree (BRT) model was adopted to analyze the main influencing factors and driving mechanisms of ISA change in Shenyang, China between 2010 and 2017.
Outcomes
The nearly complete-coverage ISA (≥0.7) increased from 42% in 2010 to 47% in 2017. The percentage of landscape with a high ISA fraction increased, while the landscape evenness and diversity of ISA decreased. The BRT analysis revealed that elevation, regional population density, and landscape class had the largest influences on the change of urban ISA, contributing 22.55%, 18.16%, and 11.18% to the model, respectively.
Conclusion
Overall, topographic and socioeconomic factors had the greatest influence on urban ISA change in Shenyang, followed by land use type and building pattern indices. The trend of high aggregation was strong in large commercial and residential areas. The 3D expansion of the city had an influence on its areal expansion.
Introduction
The world is experiencing a rapid urbanization process. In 2017, 54.8% of the world’s population lived in cities. It has been estimated that by 2050, the urban population will increase to 67.2% of total, and could reach up to 85.9% in developed countries and 77.3% in China (United Nations Citation2011). In addition to promoting socioeconomic development, this large-scale rapid urbanization process has also brought about a series of negative effects, leading to an increasingly prominent “urban disease” characterized by traffic congestion, urban heat islands, and environmental pollution. These effects pose enormous challenges to the sustainable development of cities and the wider surrounding regions.
One of the most striking features of urbanization in space is that the original natural land cover type is largely replaced by artificial impervious surface area (ISA). The urban ISA is mainly composed of urban roads, plazas, parking lots, and roofs and is a key factor driving the evolution of the urban ecological environment. It can therefore serve as an important indicator for monitoring the urban environmental health risks and the human–land relationship in cities. Expansion of ISA is closely related to multiple ecological processes and it threatens the healthy development of cities and the well-being of residents (Zhou, Guo, and Zibibula Citation2018; Li, Lin, and Sun Citation2017). However, the extent of the contribution of various environmental factors to ISA expansion and the scope and mechanism of their influences in dramatically expanding cities are yet to be determined.
Along with the development of remote sensing (RS), geographic information systems (GIS), and complexity science, many studies have focused on the simulation and prediction of land use dynamics in urban areas through comprehensive applications of 3 S technology (RS, GIS, and global positioning systems) and various intelligent simulation methods. These methods include dynamic simulation models for urban growth and land use change based on cellular automata (CA), such as SLEUTH (Xi et al. Citation2009; Al-shalabi et al. Citation2013), UrbanSim (Kakaraparthi and Kockelman Citation2011), and LEAM (Mortberg et al. Citation2013); dynamic multi-agent simulation models, such as TranSims (Park and Kwak Citation2011); spatial statistics simulation methods exploring the causal relationship between urban growth and socioeconomic variables, such as the Markov chain model (Liu et al. Citation2014; Mitsova, Shuster, and Wang Citation2011); and pattern analysis based on artificial neural networks (Grekousis, Manetos, and Photis Citation2013; Tayyebi, Pijanowski, and Tayyebi Citation2011) and logistic regression models (Chang et al. Citation2013). Urban expansion is bound to cause changes in land use/land cover and ISA configuration, which are important drivers of regional environmental change (Chen, Sun, and Liu Citation2013; Li et al. Citation2014). Currently, the RS methods for estimation of ISA can be roughly divided into two categories: the conventional pixel-based method, which extracts ISA information via image interpretation and classification; and the sub-pixel-based method, which estimates the area and distribution of ISA through spectral mixture decomposition (Wu and Murray Citation2003), artificial neural networks, and classification and regression trees (Xian Citation2007; Yang et al. Citation2003).
Urban ISA is a typical land cover component that can effectively describe the spatial gradient characteristics of land cover change. ISA is an important indicator of urban environmental quality, and its expansion and evolution is tightly linked to drivers such as urban population size, economic development, and urban master planning. The urban agglomeration of central Liaoning province, China, is an old industrial base wherein urban and industrial development has caused dramatic landscape change and prominent environmental issues. Over the past decade, the central city of Shenyang has experienced rapid urbanization, with greatly expanding urban area and persistent increases to the density and height of new buildings (Zhang, Hu, and Xiong Citation2012), driven by policies such as “Building the Shenyang Economic Zone” (April, 2010), as indicated by the transformation of the Tiexi District and the development of the Hunnan New District. In addition, large-scale transformation of urban interior space has been implemented. In 2013, the Ministry of Land and Resources of China included Shenyang in the first batch of key cities for expanding the scope of the “three olds” (old towns, old factories, and old villages) transformation pilot program. The building capacity and ISA are expected to further increase in urban Shenyang in the future.
In this study, the urban area of Shenyang was selected to investigate the spatiotemporal change of ISA and its drivers over the period of 2010–2017. The boosted regression tree (BRT) model not only gives the relative influence of each environmental factor, but also indicates the relationship between the relative influence and the change of each factor. The main objectives of this study were as follows: (1) to obtain the change in area and landscape patterns of ISA in Shenyang, China; (2) to determine the factors influencing ISA change; and (3) to analyze the contribution of various environmental factors, especially the growth of three-dimensional (3D) space, to ISA expansion and identify the mechanisms behind their influences. The results will provide a theoretical foundation and scientific reference for the formulation of relevant policies in the planning and control of an industrial metropolis.
Study area and methods
Study area
Shenyang is located in the southern part of Northeast China, which is situated in the center of the northeast Asian economic circle and the Bohai Sea rim economic circle, known as the “Oriental Ruhr.” In 2018, Shenyang had a resident population of 8.294 million, with an administrative region of 12,948 km2 and an urban area of 3,495 km2. This area is within a mid-temperate continental climate zone, with an average annual temperature of 8.4°C and an average annual precipitation of 530–680 mm. According to the “Urban Master Plan of Shenyang (2011–2020),” the Third Ring Road was taken as the boundary of the urban built-up area, and the study area covered nine major municipal districts with an area of 456 km2 (41°09′N–41°55ʹN, 123°16ʹE–123°36ʹE). In the past decade, Shenyang showed a steady trend of development and expansion.
Data sources
The data used here included Landsat-5 satellite imagery of 2010 and Landsat-8 satellite imagery of 2017. A total of eight land use types were classified by comparison with Google Earth, namely urban green space, water body, arable land, industrial land, road, residential land, bare land, and public facilities. The sets of imageries were derived from the United States Geological Survey (USGS, https://www.usgs.gov/). Elevation data were derived from a digital elevation model (DEM, from the National Administration of Surveying, Mapping and Geoinformation of China). All RS data used the Universal Transverse Mercator (UTM) coordinate system and the World Geodetic System 84 (WGS84) coordinate system. Statistical data were retrieved from the China City Statistical Yearbook and the Shenyang Statistical Yearbook. Three-dimensional information of buildings was mainly obtained by inversion of multi-source RS image data from the study area in 2017 based on the ArcGIS 10.2 (ESRI INC, 2013) and ENVI platforms.
Methods
Linear spectral mixed-pixel decomposition
The linear spectral mixed pixel decomposition model was adopted to extract ISA from the two imagery sets. This model has higher precision than the conventional band combination method and can effectively represent the percentage of surface hardening in mixed pixels. The main calculation process includes endmember component selection, minimum noise separation, and pure pixel index extraction. The core equation for linear spectral separation is expressed as follows (Deng and Wu Citation2013; Weng and Lu Citation2008):
where i is the number of spectral wavebands, i = 1, …, m (number of wavebands);k is the number of endmember components, k= 1, …, n (number of endmembers); Ri is the pixel reflectance at the i-th waveband, including one or multiple pixel components; fk is the fraction of the reflectance of the k-th endmember within a pixel; Rik is the reflectance of the k-th endmember within a pixel at the i-th waveband; and ERi is the fitting error of the model at the i-th waveband.
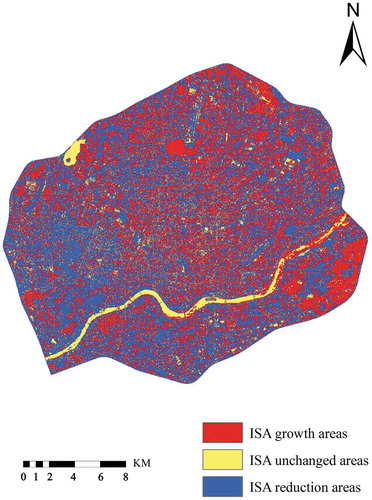
The ISA fraction maps in 2010 and 2017 obtained by the above method were reclassified into seven grades (), non-coverage (ISA < 0.2), low-coverage (0.2 ≤ ISA < 0.3), relatively low-coverage (0.3 ≤ ISA < 0.4), medium-coverage (0.4 ≤ ISA < 0.5), relatively high-coverage (0.5 ≤ ISA < 0.6), high-coverage (0.6 ≤ ISA < 0.7), and nearly complete-coverage (0.7 ≤ ISA). The ISA fraction in 2017 was then subtracted from that in 2010 with positive values indicating ISA growth areas and negative values indicating ISA reduction areas (). The results were transformed in ArcGIS to the format required by the BRT model and used as input data for the model.
Figure 1. Distribution of ISA grades in Shenyang in 2010 and 2017.
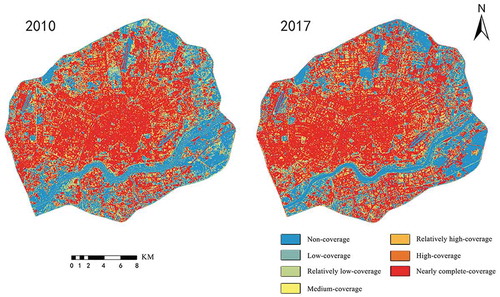
Figure 2. Change of ISA in Shenyang between 2010 and 2017.
Transition matrix
The transition matrix quantitatively describes the change of landscape class area and also reveals the class that the increased or decreased area is derived from and transformed to. To investigate the mutual transformation between various ISA fraction grades, a transition matrix analysis was performed on the ISA extraction results from the two sets of imageries based on the spatial analysis function in ArcGIS.
Landscape pattern indices
The key to selection of landscape pattern indices includes the understanding of their ecological meaning and the analysis of specific object characteristics, such as class number and resolution, to enable selection of the indices that can elucidate the problem and are as simple as possible (Li et al. Citation2004). An appropriate index system should include at least three components: the configuration of individual landscape units, the spatial configuration of landscape components, and the diversity of the overall landscape. When analyzing the spatiotemporal patterns of urban ISA, the present study mainly explored the landscape pattern change of different ISA fraction grades on the scales of class and landscape. To this end, the number of patches (NP), patch density (PD), landscape shape index (LSI), percent of landscape (PLAND), and perimeter area fractal dimension (PAFRAC) were selected to indicate the configuration of landscape individual units; the aggregation index (AI) was used to indicate the spatial configuration of landscape components; and the Shannon evenness index (SHEI) was used to indicate the diversity of the overall landscape. The landscape pattern indices were calculated using Fragstats v.4.2.
Environmental variable selection and correlation analysis
With the development of social and economic, the growth of the urban ISA in China is affected by geographical location, urban pattern, population growth, macro policies, and other aspects (Li et al. Citation2018b). Economic factors include economic industrial structure layout, urbanization situation, marketization conditions, traffic conditions, and commercial trade development. These factors directly or indirectly affect the land use change. Moreover, urban planning guidance is also one of the main factors affecting the increase of urban ISA. According to the results from relevant literature combined with the actual situation in the study area, four groups of 24 environmental factors that influence ISA change were selected as alternative predictive variables for the construction of an urban ISA evolution model ().
Table 1. Environmental factors used for BRT analysis.
The topographical factors were defined as follows. The transformation of aspect is also known as irradiation aspect, ranging from 0 to 1; the larger the index value, the higher the solar energy received (Wu, Li, and Hu Citation2016; Wu et al. Citation2018). Relief amplitude refers to the elevation difference between the highest and lowest points within a certain distance range on the ground; this index is used to quantitatively describe the characteristics of surface configuration and is important in the classification of landform types. Surface roughness is the ratio between the surface area of the earth and its projected area within a particular area and is one of the macro indices reflecting surface configuration.
The socioeconomic factors were defined as follows. Growth rate refers to the average annual growth rate during the period 2011–2017. In 2011, the boundaries of municipal districts were redefined by the “Twelfth Five-Year Plan” of Shenyang Urban Planning (the previous 11 districts were changed to 9 districts), and the socioeconomic indices information for 2017 was provided by the 2018 Statistical Yearbook. In order to ensure a uniform data range and increase credibility, the socioeconomic indices for 2011–2017 were selected.
The building pattern indices were defined as follows. The extraction of 3D building information involved two parts: building base contour extraction and building height inversion. Building base contour extraction was performed using an object-oriented method, and the base area of the building was calculated after image preprocessing, edge detection and linking, shadow and vegetation removal, binarization, region identification, feature measurement, region segmentation, and vectorization. Building height extraction was performed using a shadow length method, in which the shadow length of the high-resolution RS image perpendicular to the building shadow was inverted to obtain the building height, and the number of layers was classified. Finally, the building shape coefficient was calculated from the height, base area, and perimeter of the building.
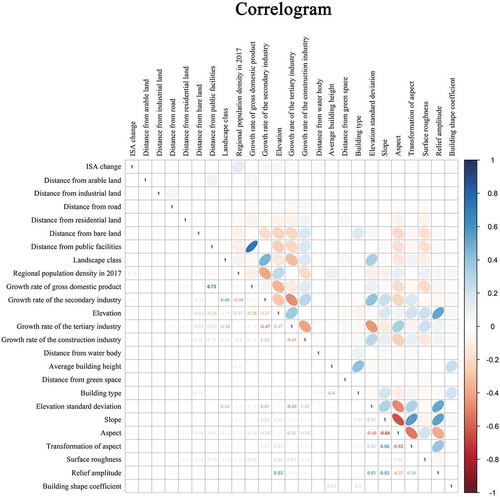
To avoid the influence of spatial autocorrelation, 10,000 randomly stratified points were generated in ArcGIS and the attribute values of random points in each factor layer were extracted (Reeves et al. Citation2018). To reduce the effect of multicollinearity, the data of environmental variables were subjected to a correlation test with cor.test in R v.3.3.3 (http://www.r-project.org/). All 24 environmental variables met the requirement of correlation (|r| < 0.75; ) (Couturier et al. Citation2014; Dormann et al. Citation2013). Finally, all factor layers were unified into the WGS84 coordinate system on the ArcGIS platform, with a grid resolution of 25 m × 25 m.
Figure 3. Pearson correlation coefficients for all pairs of the environmental factors.
BRT analysis
The BRT method is a self-learning method based on the classification and regression tree algorithm (De’ath Citation2007). It generates multiple regression trees through random selection and self-learning, which can improve model stability and prediction accuracy (Prasad, Iverson, and Liaw Citation2006). During calculation, a certain amount of data is randomly selected multiple times to analyze the degree of influence of the independent variable on the dependent variable. The remaining data are used to verify the fitting result. The multiple regression trees generated are averaged and exported (Elith, Leathwick, and Hastie Citation2008). To date, the BRT method has been applied to many fields, such as species distribution simulation (Pittman, Costa, and Battista Citation2009) and land use classification (Weisberg, Shandra, and Becker Citation2013), and has achieved satisfactory simulation results. The change of ISA fraction extracted in this study was taken as the dependent variable, and the 24 environmental factors were used as the independent variables. BRT analysis was performed in R, with the learning rate set to 0.01. For each run, 50% of the data was extracted for analysis, and the other 50% was used for training, with five iterations of cross-validation (Wu et al. Citation2019a). The optimal model was obtained via 1,000 fractals.
Results
Area change and classification of ISA
The study area was 456.36 km2 in total (). In 2010, the area of non-coverage ISA was 89.21 km2, accounting for 20% of the total study area, and the area of nearly complete-coverage ISA was 191.90 km2, accounting for 42% of the total study area. In 2017, the area of non-coverage ISA changed to 84.04 km2 (18%) and the nearly complete-coverage ISA was 215.73 km2 (47%). From 2010 to 2017, the area of ISA growth was 226.81 km2 (49.7%). The percentage of medium- to low-coverage ISAs decreased in the study area, and the largest decrease (15.73 km2) was observed in low-coverage ISA, which accounted for 34% of the low-coverage ISA in 2010. Conversely, the percentage of medium- to high-coverage ISAs increased substantially.
Table 2. The transition matrix of urban impervious surface fraction grades in Shenyang from 2010 to 2017 (unit: km2).
The results of the transition matrix analysis revealed that the ISA change of various fraction grades was mainly derived from transformation between adjacent grades. The most striking characteristic was the transformation from non-coverage ISA to low-coverage ISAs and the transformation between relatively high-coverage ISA and high-coverage ISA. For example, 16.67 km2 of the non-coverage ISA in 2010 was transformed to low-coverage ISA in 2017, accounting for 19%, and 16.54 km2 of the high-coverage ISA was transformed to nearly complete-coverage ISA, accounting for 42%.
Landscape patterns of ISA
At the class level, the area index showed that the percentages of both nearly complete-coverage and relatively high-coverage ISAs increased from 2010 to 2017 (). Specifically, the PLAND of nearly complete-coverage ISA increased from 42.05% to 47.27%, while the PLAND of relatively high-coverage ISA increased from 8.69% to 9.01%. This indicates that the percentage of the landscape with a high ISA fraction had a growing trend, whereas the area index decreased for the other ISA fraction grades. In terms of the density indices, both NP and PD generally remained stable for each ISA fraction grade, which indicates that the landscape fragmentation level did not substantially increase within the ISA. The shape indices LSI and PAFRAC were also generally stable for different grades. The AI considerably decreased in low-coverage ISA (from 35.25% to 26.64%) and relatively low-coverage ISA (from 22.56% to 16.99%), whereas it did not change substantially for the remaining ISA fraction grades.
Figure 4. Landscape pattern change of urban impervious surface fraction grades in Shenyang from 2010 to 2017.
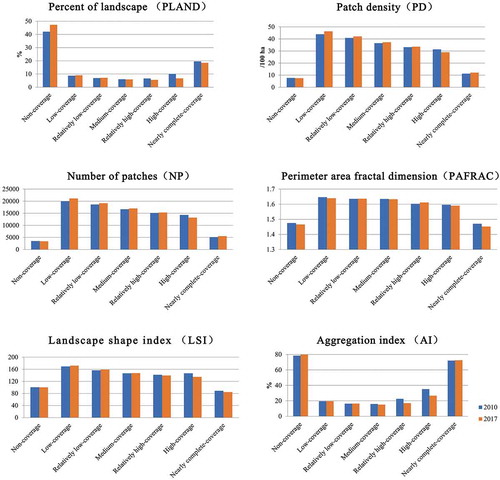
At the landscape level, the density indices NP and PD both increased from 2010 to 2017. However, the shape indices generally did not change. The diversity index SHEI decreased from 0.854 to 0.812, indicating that the landscape diversity was reduced and the landscape evenness of ISA was decreased.
Relative contributions and marginal effects of influencing factors
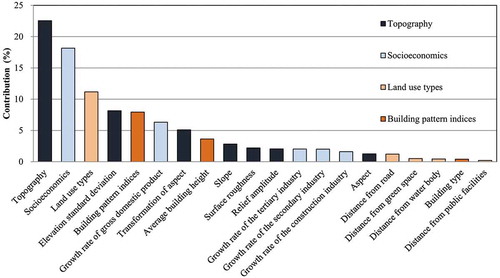
The BRT analysis showed that there were five main factors influencing ISA change, namely elevation, regional population density in 2017, landscape class factor, elevation standard deviation, and building shape coefficient (), which contributed 22.55%, 18.16%, 11.18%, 8.15%, and 7.94% to the model, respectively. The five factors with lowest influences were distance from public facilities (0.21%), distance from residential land (0.07%), distance from bare land (0.06%), distance from industrial land (0.03%), and distance from arable land (0%). Overall, topographic factors had the largest influence on urban ISA change with a contribution rate of 44.14%, followed by socioeconomic factors (30.14%).
Figure 5. Relative influence on the ISA for the environmental factors (contribution>0.2%) in a BRT analysis.
The relative influence on ISA expansion was determined for each driver in Shenyang (). For topographic factors, when the elevation was between 40 and 80 m, it was positively correlated with urban ISA change, and the largest influence was observed at the elevation of 45 m. When the elevation was above 80 m, the influence became negative and elevation restricted urban ISA change. Both elevation standard deviation and slope also played a role in restricting urban ISA expansion. For socioeconomic factors, when the regional population density was 5,000 people/km2, the relative influence was positive and the relative influence gradually increased with increasing population density above the level of 5,000 people/km2. For the building pattern indices, when the building shape coefficient was less than 0.5, the relative influence fluctuated in a negative interval, and the largest influence was observed with the building shape coefficient of 0.7. As the average building height increased, the relative influence on ISA change gradually decreased.
Figure 6. Effects of the main environmental factors on change of ISA, in the BRT analysis.
Discussion
Change and landscape patterns of ISA
This study showed that the area associated with the growth of the ISA fraction exceeded 50% of the study area in Shenyang over the period 2010–2017. The expanding trend was apparent from inside the Second Ring Road toward the periphery, until the vicinity of the Third Ring Road. The industrial areas, residential areas, and roads of the city were constantly expanding outwards, while the overall hardening and expanding intensity of the city were still increasing. Natural land cover types such as water bodies and bare soils had changed into artificial architectural landscapes, directly leading to continuous growth of the ISA fraction.
The transition matrix analysis revealed that there was mutual transformation between low coverage ISAs (ISA< 0.3) as well as between high coverage ISAs (ISA ≥ 0.6). This result suggests that old district transformation, greening construction, and industrial migration in the city have caused various land cover changes. When interpreting RS imagery, we refer to the RS image of the previous phase for judgment, which means each image is compared with the previous one. If the object in previous phase image is a residence or building, the area belongs to urban renewal. If bare land, farmland, or other land use type are shown in the previous phase image, the area is classified as a newly built-up area. We also found that the ISA has aggregated in the core urban areas and sub-central areas, as well as along both sides of main traffic trunks and river channels. The trend of high aggregation was still strong in large commercial areas and residential areas. Compared with 2010, the AI value for 2017 decreased in low-coverage ISAs, which indicates some gradual improvements in the ecological quality of this region. This result is similar to the finding of Wang and Xu (Citation2018) regarding the spatiotemporal change of urban ISA in Shanghai (Wang and Xu Citation2018). The AI value for nearly complete-coverage ISA changed from 78.4 in 2010 to 79.65 in 2017. Despite the slight increase, the aggregation level was within reasonable limits based on comparison with similar cities in China during the same period (Mu et al. Citation2017). The results of landscape pattern indices showed that the landscape diversity of all ISA fraction grades decreased, while the dominance and complexity both increased. The landscape evenness of ISA was reduced.
Drivers of ISA change
The socioeconomic indices are generally classified as external driving mechanisms for the change of urban ISA (Wu, Zhao, and Henebry Citation2019). Expansion of urban ISA is influenced by various factors such as population density growth, economic development, and national macroeconomic policy regulation. In the present study, the regional population density factor in 2017 had an important influence on the growth rate of ISA in Shenyang. Within a certain threshold, population density growth plays a stimulating positive role in urban ISA expansion. Our results showed that when the population density exceeded 5,000 people/km2, the positive role was continuously enhanced with increasing population density. Li et al. (Citation2017a) came to a similar conclusion in the study of spatiotemporal change and driver analysis of ISA in the urban–rural junction in Harbin (Li et al. Citation2017a). As the population grows, a series of supporting facilities such as houses, roads, schools, and shopping centers will be developed. To address the production and living needs of the residents, a large amount of building land is needed to meet the requirements for spatial expansion. This will drive construction, and the ISA will increase accordingly (Brueckner Citation2000). Development of secondary industry can lead to continuous increases in the area of industrial land and can also bring a large population into the city, thereby increasing urban residential land. Moreover, development of tertiary industry also contributes to continuous growth of ISA. Herein, the internal factors, including gross domestic product and average annual growth rate of individual industry, made a total contribution of more than 30% to the model. This shows that factors such as the structure and distribution of economic industries and the development of commercial trade have a major influence on land use change.
Topography, land use type, and 3D building pattern indices are generally classified as internal factors that influence the change of ISA. The current study showed that elevation, landscape class, elevation standard deviation, and building shape coefficient had large influences on the change of urban ISA; however, the contribution rates of distance from various land use types in the city were generally low. This result is inconsistent with the findings of previous research. This may be because the time span in the present study was relatively short (7 years), and thus the change of various land use types was not substantial and the transport network did not change much in the urban area. This might explain why the change of ISA did not respond substantially to this group of factors. Transportation factors have often been identified as important in long-term studies over three decades (Li et al. Citation2018a). In the current study, the contribution rate of the building shape coefficient was approximately 8%, which indicates that 3D expansion of the city had an influence on its areal expansion. The building shape coefficient is the external surface area per unit building volume; the higher the coefficient value, the larger the area dissipating heat per unit space of buildings, and the higher the building energy consumption. The factor response curve shows that the peak of the influence occurred at 0.6–0.8, which indicates a strong response of ISA change to the 3D configuration of buildings. The distribution and expansion of urban ISA is closely associated with the 3D urban landscape pattern, which is worthy of attention in the future (Liu, Hu, and Li Citation2017; White, Uljee, and Engelen Citation2012).
Li et al. (Citation2014) showed that the main influencing factors of urban ISA expansion are similar in China. Geographical location, transportation, policy, population growth, and economic development are the main drivers of urban expansion. Feng et al. (Citation2012) found that topographic factors were the basis of urban expansion in Xining. Population growth and economic development are the main factors of urban expansion, and policies have a major role in promoting and guiding urban expansion. Mu et al. (Citation2007) indicated that the development of transportation promotes the expansion of urban land, which is the traction force of urban expansion, and has a directional effect on urban space expansion. Huang et al. (Citation2009) indicated that the macro-scale policy and the urban pattern determined the basic pattern of Beijing’s urban development. At the meso-scale, the population growth and the improvement of people’s living standards provide the impetus for urban expansion. In contrast, at the micro-scale, topography, location, and traffic determine the possibility of urban expansion. Qu and Chou (Citation2013) found that economic transformation and industrial structure optimization were the core driving forces of urban land expansion, transportation is also an important guiding force, and urban planning is an important regulatory force.
In general, the location factor is the leading factor of urban expansion and the DEM, rivers, and other natural factors are the basis of urban development and determine the overall spatial form of the city (Zhang et al. Citation2014). The construction of roads, railways, rivers, and other infrastructure widens the urban landscape pattern. Socioeconomic factors such as GDP and population determine the speed of urban expansion (Li, Sun, and Fang Citation2018a). The urban master planning and construction of development zones provide spatial guidance. This study shows that the 3D pattern has a certain impact on urban ISA expansion, which may become an important research topic in the future (Sun et al. Citation2020).
Evolutionary mechanism analysis of ISA
The analyzes conducted in this study revealed that the evolution of impermeable surface in Shenyang is mainly affected by the following three factors:
Rapid expansion of urban built-up areas. The rapid urbanization process has brought about drastic changes in the underlying surface of the city, and the three-dimensional characteristics of the spatial form are important. The rapid expansion of the urban built-up area is the direct cause of the expansion of ISA. In the process of spatial expansion, population gathering, increased traffic, replacement of agricultural production with industrial production, and other changes have taken place, leading to major changes in the urban thermal environment.
The relocation of industrial enterprises. The decrease of the proportion of the industrial landscape is also one of the direct factors of the evolution of ISA in the downtown area of Shenyang. As a typical city with traditional heavy industry, industrial enterprises began to relocate in order to alleviate congestion in the core area and control environmental pollution, and nearly all heavy polluting enterprises within the second ring road were relocated outside of the city around 2013. The industrial landscape dominated by large floor space and open low-rise buildings was quickly replaced by roads and residential areas dominated by compact high-rise buildings, which intensified the expansion of ISA.
Efforts to increase the greening in urban areas. In recent years, Shenyang has been vigorously strengthening community greening, restoring green open space such as water areas; carrying out large-scale greening construction on urban roads, river system, community units, and courtyards; and transforming parks and green spaces in the urban area. These efforts have led to a major increase in the vegetation coverage rate in urban built-up areas. The thermal radiation capacity of vegetation cover is substantially less than that of ISA, and greening is crucial to alleviate the evolution of the urban heat island and ISA.
Innovation and limitations
This study has made many improvements to the research methods as follows. First, there was an improvement in the procedure of endmember selection during urban ISA extraction; given the divergence of the spectral features of urban ISA, a linear combination of high albedo and low albedo features was adopted to express the urban ISA. Moreover, a 3D feature space was constructed to select endmembers, which could reduce the information loss caused by endmember selection in two-dimensional space in previous study cases. Second, for the selection of environmental factors, three factors (average building height, building type, and building shape coefficient) were introduced to describe the 3D spatial configuration of urban ISA, which could effectively express the expansion of the city in both horizontal and vertical directions. The results also showed that the total contribution rate of 3D building pattern index factors was 12%, indicating their influence on the expansion of urban ISA.
The present study also had four main limitations. The first of these is related to the selection of RS data: a combination of QuickBird, Google Maps, and TM/ETM+ multi-source RS imageries. However, the time resolution of these imageries was quite different, which interfered with the study of the evolution of urban ecological environment based on the time series. The second limitation is the insufficient spatialization accuracy of socioeconomic factors. Because of the difficulty of obtaining relevant data, this study only assigned values according to administrative divisions, which affected the accuracy of the results. The third limitation is related to the grading of the ISA fraction. In this study, the urban ISA fraction was classified and graded mainly by reference to the literature (Li et al. Citation2017a), but it was impossible to rule out the influence of subjective and empirical judgments. The ideal grading method needs further exploration. The fourth limitation relates to the selection of influencing factors; the model and drivers of urban expansion in China comply with the unconscious natural growth model objectively required by topographic conditions, transportation conditions, present land use status, and socioeconomic development. However, policy orientation and decision makers also strongly influence urban expansion. Strong conscious human-oriented planning or control occurs in practice, but the influence of policy factors could not be quantitatively shown in this study and should be further researched.
Conclusions
The average ISA fraction in the central urban area of Shenyang has grown slowly over the past decade. The area percentage of nearly complete-coverage ISA increased from 42% in 2010 to 47% in 2017. The ISA change of different fraction grades mainly came from transformation between adjacent grades, and the most striking characteristic was mutual transformation between low coverage ISAs (ISA< 0.3) as well as between high coverage ISAs (ISA ≥ 0.6). There was a growing trend in the percentage of landscape with a high ISA fraction. The landscape fragmentation level of ISA did not increase substantially, whereas the landscape evenness and diversity decreased. This shows that human activities, such as relocation of industrial areas, old district transformation, and new district construction, had an influence on ISA. With regard to the drivers of urban ISA expansion, the most influential factors were elevation (22.55%), population density (18.16%), and landscape class (11.18%). Topographic factors had the largest influence on the change of urban ISA, with a total contribution rate of 44.14%, followed by socioeconomic factors (30.14%).
The rapid urbanization process has caused a dramatic change to urban ISA. The 3D characteristics of spatial configuration are important, and result in complicated interactions and influences between the evolution of ISA patterns and the processes of the ecological environment. In summary, the change of ISA is jointly influenced by the natural environment, socioeconomics, and policy orientation through complex and comprehensive mechanisms. Construction of a long-term, stereo, multi-dimensional influencing factor system is recommended, while also focusing on delineating the landscape pattern characteristics associated with ISA evolution, which are conducive to a deeper understanding of the mechanism of ISA evolution.
Disclosure statement
No potential conflict of interest was reported by the authors.
Additional information
Funding
References
- Al-shalabi, M., L. Billa, B. Pradhan, S. Mansor, and A. A. A. Al-Sharif. 2013. “Modelling Urban Growth Evolution and Land-use Changes Using GIS Based Cellular Automata and SLEUTH Models: The Case of Sana’a Metropolitan City, Yemen.” Environmental Earth Sciences 70: 425–13. doi:10.1007/s12665-012-2137-6.
- Brueckner, J. K. 2000. “Urban Sprawl: Diagnosis and Remedies.” International Regional Science Review 23: 160–171. doi:10.1177/016001700761012710.
- Chang, Y., Z. L. Zhu, R. C. Bu, H. W. Chen, Y. T. Feng, Y. H. Li, Y. M. Hu, and Z. C. Wang. 2013. “Predicting Fire Occurrence Patterns with Logistic Regression in Heilongjiang Province, China.” Landscape Ecology 28: 1989–2004. doi:10.1007/s10980-013-9935-4.
- Chen, L. D., R. H. Sun, and H. L. Liu. 2013. “Ecoenvironmental Effects of Urban Landscape Pattern Changes: Progresses, Problems, and Perspectives.” Acta Ecologica Sinica 33: 1042–1050. In Chinese. doi:10.5846/stxb201205070659.
- Couturier, T., A. Besnard, A. Bertolero, V. Bosc, G. Astruc, and M. Cheylan. 2014. “Factors Determining the Abundance and Occurrence of Hermann’s Tortoise Testudo Hermanni in France and Spain: Fire Regime and Landscape Changes as the Main Drivers.” Biological Conservation 170: 177–187. doi:10.1016/j.biocon.2013.12.028.
- De’ath, G. 2007. “Boosted Trees for Ecological Modeling and Prediction.” Ecology 88: 243–251. doi:10.1890/0012-9658(2007)88[243:btfema]2.0.co;2.
- Deng, C. B., and C. S. Wu. 2013. “Examining the Impacts of Urban Biophysical Compositions on Surface Urban Heat Island: A Spectral Unmixing and Thermal Mixing Approach.” Remote Sensing of Environment 131: 262–274. doi:10.1016/j.rse.2012.12.020.
- Dormann, C. F., J. Elith, S. Bacher, C. Buchmann, G. Carl, G. Carre, J. R. G. Marquez, et al. 2013. “Collinearity: A Review of Methods to Deal with It and a Simulation Study Evaluating Their Performance.” Ecography 36: 27–46. doi:10.1111/j.1600-0587.2012.07348.x.
- Elith, J., J. R. Leathwick, and T. Hastie. 2008. “A Working Guide to Boosted Regression Trees.” Journal of Animal Ecology 77: 802–813. doi:10.1111/j.1365-2656.2008.01390.x.
- Feng, S. C., X. H. Gao, J. Kang, G. L. Wu, C. Zou, and J. J. Yang. 2012. “Research on Land Use/cover Change and Urban Expansion in Xining City in Recent 30 Years.” Arid Zone Research 29: 129–136. In Chinese.
- Grekousis, G., P. Manetos, and Y. N. Photis. 2013. “Modeling Urban Evolution Using Neural Networks, Fuzzy Logic and GIS: The Case of the Athens Metropolitan Area.” Cities 30: 193–203. doi:10.1016/j.cities.2012.03.006.
- Huang, Q. X., C. Y. He, P. J. Shi, Y. Y. Zhao, Y. Yang, and H. Y. Liu. 2009. “Understanding Multi-scale Urban Expansion Driving Forces: In the Case Study of Beijing.” Economic Geography 29: 714–721. In Chinese.
- Kakaraparthi, S. K., and K. M. Kockelman. 2011. “Application of UrbanSim to the Austin, Texas, Region: Integrated-model Forecasts for the Year 2030.” Journal of Urban Planning and Development-Asce 137: 238–247. doi:10.1061/(asce)up.1943-5444.0000065.
- Li, C. L., M. Liu, Y. M. Hu, Y. Y. Xu, and F. Y. Sun. 2014. “Driving Forces Analysis of Urban Expansion Based on Boosted Regression Trees and Logistic Regression.” Acta Ecologica Sinica 34: 727–737. In Chinese.
- Li, G. D., S. Sun, and C. L. Fang. 2018a. “The Varying Driving Forces of Urban Expansion in China: Insights from a Spatial-temporal Analysis.” Landscape and Urban Planning 174: 63–77. doi:10.1016/j.landurbplan.2018.03.004.
- Li, M., S. Y. Zang, C. S. Wu, and X. D. Na. 2018b. “Spatial and Temporal Variation of the Urban Impervious Surface and Its Driving Forces in the Central City of Harbin.” Journal of Geographical Sciences 28: 323–336. doi:10.1007/s11442-018-1475-z.
- Li, M., S. Y. Zang, C. S. Wu, and Y. Tian. 2017a. “Spatial and Temporal Variation and Its Driving Forces of Urban Impervious Surface in Urban-rural Continuum of Harbin.” Acta Geographica Sinica 72: 105–115. In Chinese.
- Li, X. Z., R. C. Bu, Y. Chang, Y. M. Hu, Q. C. Wen, X. G. Wang, C. G. Xu, Y. H. Li, and H. S. He. 2004. “The Response of Landscape Metrics against Pattern Scenarios.” Acta Ecologica Sinica 24: 123–134. In Chinese.
- Li, Y. F., J. Y. Lin, and X. Sun. 2017. “An Early Warning Method on Ecological Risk and Its Application to Improve Landscape Ecological Security Pattern Regulation.” Geographical Research 36: 485–494. In Chinese.
- Liu, M., C. L. Li, Y. M. Hu, F. Y. Sun, Y. Y. Xu, and T. Chen. 2014. “Combining CLUE-S and SWAT Models to Forecast Land Use Change and Non-point Source Pollution Impact at a Watershed Scale in Liaoning Province, China.” Chinese Geographical Science 24: 540–550. doi:10.1007/s11769-014-0661-x.
- Liu, M., Y. M. Hu, and C. L. Li. 2017. “Landscape Metrics for Three-dimensional Urban Building Pattern Recognition.” Applied Geography 87: 66–72. doi:10.1016/j.apgeog.2017.07.011.
- Mitsova, D., W. Shuster, and X. H. Wang. 2011. “A Cellular Automata Model of Land Cover Change to Integrate Urban Growth with Open Space Conservation.” Landscape and Urban Planning 99: 141–153. doi:10.1016/j.landurbplan.2010.10.001.
- Mortberg, U., J. Haas, A. Zetterberg, J. P. Franklin, D. Jonsson, and B. Deal. 2013. “Urban Ecosystems and Sustainable Urban Development-analysing and Assessing Interacting Systems in the Stockholm Region.” Urban Ecosystems 16: 763–782. doi:10.1007/s11252-012-0270-3.
- Mu, F. Y., Z. X. Zhang, Y. B. Chi, B. Liu, Q. B. Zhou, C. Y. Wang, and W. B. Tan. 2007. “Dynamic Monitoring of Built-up Area in Beijing during 1973—2005 Based on Multi-original Remote Sensed Images.” Journal of Remote Sensing 11: 257–268. In Chinese.
- Mu, Y. C., Y. W. Xie, L. L. Zhang, and Y. H. Chen. 2017. “. Analysis of the Impervious Surface Changes in Lanzhou City from 1994 to 2015.” Geospatial Information 15: 94–97+101. In Chinese.
- Park, B. B., and J. Kwak. 2011. “Calibration and Validation of TRANSIMS Microsimulator for an Urban Arterial Network.” Ksce Journal of Civil Engineering 15: 1091–1100. doi:10.1007/s12205-011-1002-6.
- Pittman, S. J., B. M. Costa, and T. A. Battista. 2009. “Using Lidar Bathymetry and Boosted Regression Trees to Predict the Diversity and Abundance of Fish and Corals.” Journal of Coastal Research 25: 27–38. doi:10.2112/si53-004.1.
- Prasad, A. M., L. R. Iverson, and A. Liaw. 2006. “Newer Classification and Regression Tree Techniques: Bagging and Random Forests for Ecological Prediction.” Ecosystems 9: 181–199. doi:10.1007/s10021-005-0054-1.
- Qu, A. X., and F. D. Chou. 2013. “The Process and Pattern of Urban Construction Land Expansion in Xuzhou.” Scientia Geographica Sinica 33: 61–68. In Chinese.
- Reeves, M. K., M. Perdue, L. A. Munk, and B. Hagedorn. 2018. “Predicting Risk of Trace Element Pollution from Municipal Roads Using Site-specific Soil Samples and Remotely Sensed Data.” Science of the Total Environment 630: 578–586. doi:10.1016/j.scitotenv.2018.02.171.
- Sun, F. Y., M. Liu, Y. C. Wang, H. Wang, and Y. Che. 2020. “The Effects of 3D Architectural Patterns on the Urban Surface Temperature at a Neighborhood Scale: Relative Contributions and Marginal Effects.” Journal of Cleaner Production 258: 120706. doi:10.1016/j.jclepro.2020.120706.
- Tayyebi, A., B. C. Pijanowski, and A. H. Tayyebi. 2011. “An Urban Growth Boundary Model Using Neural Networks, GIS and Radial Parameterization: An Application to Tehran, Iran.” Landscape and Urban Planning 100: 35–44. doi:10.1016/j.landurbplan.2010.10.007.
- United Nations. 2011. Department of Economic and Social Affairs Population Division, “World Urbanization Prospects, the 2011 Revision.” New York. esa.un.org/unpp/
- Wang, M. Y., and H. Q. Xu. 2018. “Temporal and Spatial Changes of Urban Impervious Surface and Its Influence on Urban Ecological Quality: A Comparison between Shanghai and New York.” Chinese Journal of Applied Ecology 29: 3735–3746. In Chinese . doi:10.13287/j.1001-9332.201811.018.
- Weisberg, P. J., O. Shandra, and M. E. Becker. 2013. “Landscape Influences on Recent Timberline Shifts in the Carpathian Mountains: Abiotic Influences Modulate Effects of Land-use Change.” Arctic Antarctic and Alpine Research 45: 404–414. doi:10.1657/1938-4246-45.3.404.
- Weng, Q. H., and D. S. Lu. 2008. “A Sub-pixel Analysis of Urbanization Effect on Land Surface Temperature and Its Interplay with Impervious Surface and Vegetation Coverage in Indianapolis, United States.” International Journal of Applied Earth Observation and Geoinformation 10: 68–83. doi:10.1016/j.jag.2007.05.002.
- White, R., I. Uljee, and G. Engelen. 2012. “Integrated Modelling of Population, Employment and Land-use Change with a Multiple Activity-based Variable Grid Cellular Automaton.” International Journal of Geographical Information Science 26: 1251–1280. doi:10.1080/13658816.2011.635146.
- Wu, C. S., and A. T. Murray. 2003. “Estimating Impervious Surface Distribution by Spectral Mixture Analysis.” Remote Sensing of Environment 84: 493–505. doi:10.1016/s0034-4257(02)00136-0.
- Wu, W., Y. H. Li, and Y. M. Hu. 2016. “Simulation of Potential Habitat Overlap between Red Deer (Cervus Elaphus) and Roe Deer (Capreolus Capreolus) in Northeastern China.” Peerj 4. doi:10.7717/peerj.1756.
- Wu, W., Y. H. Li, Y. M. Hu, C. L. Xiu, and X. L. Yan. 2018. “Impacts of Changing Forest Management Areas on Forest Landscapes and Habitat Patterns in Northeastern China.” Sustainability 10. doi:10.3390/su10041211.
- Wu, W., Y. H. Li, Y. M. Hu, Y. Chang, and Z. P. Xiong. 2019a. “Anthropogenic Effect on Forest Landscape Pattern and Cervidae Habitats in Northeastern China.” Journal of Geographical Sciences 29: 1098–1112. doi: 10.1007/s11442-019-1647-5.
- Wu, W. J., S. Q. Zhao, and G. M. Henebry. 2019. “Drivers of Urban Expansion over the past Three Decades: A Comparative Study of Beijing, Tianjin, and Shijiazhuang.” Environmental Monitoring and Assessment 191: 34. doi:10.1007/s10661-018-7151-z.
- Xi, F. M., Y. M. Hu, H. S. He, X. Q. Wu, R. C. Bu, Y. Chang, M. Liu, and J. Yu. 2009. “Simulate Urban Growth Based on RS, GIS, and SLEUTH Model in Shenyang-Fushun Metropolitan Area Northeastern China.” In Joint Urban Remote Sensing Event, Shanghai, China. IEEE. doi:10.1109/URS.2009.5137630.
- Xian, G. 2007. “Analysis of Impacts of Urban Land Use and Land Cover on Air Quality in the Las Vegas Region Using Remote Sensing Information and Ground Observations.” International Journal of Remote Sensing 28: 5427–5445. doi:10.1080/01431160701227653.
- Yang, L. M., C. Q. Huang, C. G. Homer, B. K. Wylie, and M. J. Coan. 2003. “An Approach for Mapping Large-area Impervious Surfaces: Synergistic Use of Landsat-7 ETM+ and High Spatial Resolution Imagery.” Canadian Journal of Remote Sensing 29: 230–240. doi:10.5589/m02-098.
- Zhang, P. F., Y. M. Hu, and Z. P. Xiong. 2012. “Influence of Location Factor on the Changes of Three-dimensional Architectural Landscape in Tiexi District of Shenyang, Northeast China.” Chinese Journal of Ecology 31: 1832–1838. In Chinese.
- Zhang, Q., J. Wallace, X. Z. Deng, and K. C. Seto. 2014. “Central versus Local States: Which Matters More in Affecting China’s Urban Growth?” Land Use Policy 38: 487–496. doi:10.1016/j.landusepol.2013.12.015.
- Zhou, X. D., H. D. Guo, and S. Zibibula. 2018. “Spatial Pattern Evolution of Impervious Surfaces and Its Influence on Surface Temperature in the Process of Urban Expansion: A Case Study of Urumqi.” Acta Ecologica Sinica 38: 7336–7347. In Chinese.