
 ?Mathematical formulae have been encoded as MathML and are displayed in this HTML version using MathJax in order to improve their display. Uncheck the box to turn MathJax off. This feature requires Javascript. Click on a formula to zoom.
ABSTRACT
Ecological footprint (EF) accounting system is widely used in assessing environmental sustainability at various spatial scales. To improve the EF performance, a new EF calculation framework was established in this study, in which HWP is considered as carbon sinks and the model was then applied to the Yangtze River basin of China. Results showed that (1) carbon sink in the basin is about 2.99 Tg per year and it varies substantially across subbasins, which has a nonlinear relationship with net primary productivity; (2) available biocapacity calculated in the whole basin increases from 0.5068 to 0.5759 national ha (nha) per capita when incorporating the carbon sinks. In a few subbasins, the added biocapacity is even larger than the biocapacity estimated from the conventional approach; (3) the EF of the basin is 5.598 nha per capita and it is much larger than its biological carrying capacity (BC), indicating that ecological deficit is ubiquitous across the basin. If carbon sinks are considered, the ecological deficit would decrease by 3.2–14.3% for different regions in the basin. It is necessary to incorporate HWP and other potential terrestrial carbon sinks in the EF accounting, and more efforts are needed in improving carbon sink accuracy.
Introduction
With the rapid development of the global population and economy, human’s impact on the planet is increasing considerably and has exceeded the limit of its carrying capacity in many aspects (Rockstrom et al. Citation2009). To mitigate deteriorating environmental sustainability, measuring anthropogenic influence on the natural environment is the fundamental step to manage both humans and nature (Wackernagel, Onisto, and Bello et al. Citation1999). Various environmental models have been suggested to quantify human’s impact on the natural environment to assess environmental sustainability, such as net primary productivity (NPP) (Vitousek, Ehrlich, and Ehrlich et al. Citation1986), material flow analysis (Fischer‐Kowalski and Haberl Citation1998), pressure-state-response model (Wang and Liu Citation2019), emergy analysis (Bonilla et al., Citation2019), life cycle assessment (Castellani and Sala Citation2012), and ecological footprint (EF) (Wackernagel, Onisto, and Bello et al. Citation1999). Among them, EF is one of the most widely used approaches (Mostafa Citation2010) and has been proved to be an effective tool to assess the impact of anthropogenic activity on the natural ecosystem (Wang et al. Citation2018). The EF is an important model for measuring environmental sustainability, which was first introduced by William Rees (Citation1992) and developed by Wackernagel, Onisto, and Bello et al. (Citation1999), and was applied in many countries. The EF accounting system measures environmental sustainability by comparing the bio-productive land areas that are consumed and produced in a region (Venetoulis and Talberth Citation2008). As a composite model of quantifying anthropogenic intervention and natural resources, the EF approach is consisted of a lot of calculating items, parameters, and assumptions that may lead to uncertainty in EF calculation results (Venetoulis and Talberth Citation2008; Beynon and Munday Citation2008; Lenzen and Murray Citation2001). To decrease model uncertainty and improve its performance, various modified models of EF have been established by including new calculation items (Lenzen and Murray Citation2001) or presenting new methods of calculating parameters such as the equivalence factor and the yield factor (YF) (Barrahmoune, Lahboub, and El Ghmari Citation2019; Li, Zhang, and Chang et al. Citation2018). In the EF case study of Australia, a revised model which considered greenhouse gases other than CO2 and regional productivity other than the world average was used in the calculation (Lenzen and Murray Citation2001). To improve parameter estimation in the model, NPP was suggested to estimate the YF and equivalent factor (EQF) (Liu, Fu, and Jiang et al. Citation2019). Some assumption in the model such as the calculation of YF and EQF for the built-up land has also been assessed and revised. In a recent study (Li, Zhang, and Chang et al. Citation2018), the assumption that built-up land is converted from cropland is modified from historic land-use change, concluding that in some urbanized regions, the assumption has a significant influence on the EF. New EF components such as water EF are included in the calculation in a recent study (Wang et al. Citation2018). The revised form of EF accounting system has improved the model performance and enhanced its ability to deal with different environmental and socioeconomic situations.
In the conventional EF accounting, biologically productive land used for assimilating carbon emission from fossil combustion (or carbon footprint) often accounts for the largest source of EF (Li, Zhang, and Chang et al. Citation2018; Yilanci, Gorus, and Aydin Citation2019; Wackernagel, Schulz, and Deumling et al. Citation2002; Lin et al. Citation2018). Therefore, accurate estimation of biological capacity for carbon assimilation is critical to estimate EF. The current EF accounting system assumes that biologically productive land is mutually exclusive (Wackernagel, Onisto, and Bello et al. Citation1999). Under this assumption, forest is only calculated as biological land use for producing forestry products mainly including roundwood and fuelwood, while its function for absorbing carbon dioxide is not calculated as biocapacity, and sequestration area is set as zero (Wackernagel, Onisto, and Bello et al. Citation1999; Lin et al. Citation2018). Although forest has long been identified as an important terrestrial carbon sink (CS), in the current EF calculation, only ocean is taken as a CS for assimilating carbon dioxide from fossil combustion, while no other natural CSs are considered (Wackernagel, Onisto, and Bello et al. Citation1999). With the development of CS study, terrestrial ecosystem such as forest and pasture is identified as an important CSs (Sarmiento and Gruber Citation2002; Pugh, Lindeskog, and Smith et al. Citation2019; Jmo and Hall Citation2010), which are excluded from the existing EF accounting, leading to underestimation of ecological carrying capacity and overestimation of ecological overshoot or ecological deficit. As pronounced land-use types of terrestrial ecosystem, forest and pasture make up a significant part of CS. Globally, tropical grasslands and savannas may act as essential CSs with a magnitude of 0.5 Pg C per year (Jmo and Hall Citation2010), and forest contributed about 2.15 Pg C per year across 2001–2010 (Sarmiento and Gruber Citation2002). Furthermore, land carbon sequestration may be accelerated with elevated atmospheric CO2 concentration (Liu, Piao, and Gasser et al. Citation2019). In China, forest and grasslands are also significant CSs, taking up 75.2 Tg C per year and 20.94–30.94 Tg C per year, respectively (Fang, Guo, and Piao et al. Citation2007). Therefore, incorporating terrestrial ecosystem CSs into the EF accounting is useful to reflect real carbon adsorption in the ecosystem, which may improve the model performance and reflect the real state of sustainability. Some publications have noticed the shortcoming of overlooking the carbon absorption capacity of the terrestrial ecosystem in the EF study (Wang et al. Citation2018), but it was only used in calculating the EF of energy consumption, and no approach for estimating its role in biocapacity has been suggested. However, it is worth noting that there are double-counting flaws if all terrestrial vegetable products are directly used to estimate CSs. Some terrestrial vegetable products such as crop, fruits, and firewood cannot act as CSs for a long time, and most carbon will return to atmosphere through rapid biological and chemical process within a year and thus not considered as important CSs (Fang, Guo, and Piao et al. Citation2007). Carbon sequestered in harvested wood products (HWP) usually has a much longer half-life time and acts as an important CS (Liu et al. Citation2018). It is true that carbon cannot be permanently stored in HWP and only acts as a temporary CS, but the stored carbon works as an important sink for a certain period because of lag release effect, which is a significant countermeasure for mitigating greenhouse effect (Yang, Ji, and Yang et al. Citation2013). Due to the rapid increase of HWP and its relatively slow release of carbon, the role of HWP in carbon sequestration attracts substantial attention, and it is reported that its net sequestration of carbon is increasing rapidly in many regions (Ji et al. Citation2013). With our knowledge, no attempts have been made to incorporate HWP CS in the EF accounting system to assess its impact on the biocapacity. Based on the study of HWP CS in the territorial ecosystem mentioned above, HWP is an increasingly important CS, and it should be included in the calculation of EF.
The objective of this study is to establish a new EF accounting system incorporating CS from HWP and to assess its applicability at regional scale. The established model was then applied to the Yangtze River basin to assess its impact on regional EF estimation. First, HWP sinks in the watershed were calculated based on historic statistic data. Second, the estimated CS was converted into carbon assimilation lands to estimate biological capacity in the region. Third, biological carrying capacity with and without HWP CS in the watershed was calculated and compared. Finally, the EF of the region was computed and compared to the biological carrying capacity. The revised model may renew our knowledge about the role of HWP CS in EF calculations and supply a novel insight for calculating the framework of EF.
Materials and methods
Study case
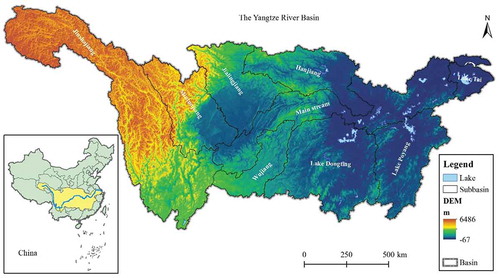
The Yangtze River is the longest river in China with a drainage area of 1.78 million km2 (), ranking the third longest and most water-abundant river in the world. In 2015, the total population in the basin was 450 million, making up 32% of China. The Yangtze River basin is also an important economic region in China. Its gross demotic product was 28.8 trillion RMB, contributing 35% of China. Land use in the basin (Figure S1) is dominated by forest (41.7%), cropland (26.9%), and pasture (23.3%). Human population, land use, and economic intensity diversify across different subbasins. Nine main subbasins were discerned in the region based on China watershed classification according to China Water Resource Second Class Zone (http://www.resdc.cn/Default.aspx). In recent decades, increased riverine nutrient loads and significant altered land use in the basin have been found (Liu, Beusen, and Van Beek et al. Citation2018; Cheng, Cheng, and Wu et al. Citation2017), and human pressure in the basin is intensifying.
Figure 1. Location and main subbasins in the Yangtze River basin.
Ecological footprint analysis
EF model is consisted of EF and biocapacity. The consumption demand of the population of the region can be compared to the biological regeneration of the region by comparing the relative magnitude of the two components.
where RE is the ratio of EF to accessible BC in national hectares which is total biologically productive land minus the land reserved for biodiversity protection. When the value of RE is greater than 1, it indicates ecological deficit, while the value less than 1 indicates ecological surplus, respectively; BC is the total existing bioproductive areas in national hectares (Lenzen and Murray Citation2001), indicating regional biological carrying capacity. The constant 0.12 is the percent of land suggested for protecting biodiversity on the Earth from the total existing biocapacity (Wackernagel, Onisto, and Bello et al. Citation1999).
Ecological footprint
In the EF accounting framework, human’s requirement of biologically productive space derives from six human activities (Wackernagel, Schulz, and Deumling et al. Citation2002): growing crops on cropland, grazing animals on grassland, harvesting timber on forest, fishing in freshwater and marine water, accommodating infrastructure on built-up land, and burning fossil fuel that requires forest to absorb greenhouse gases, which can then be categorized as three components: biological resources, built-up land, and fossil fuel emissions.
where EF is the total ecological footprint from all anthropogenic activities; EFb, EFu, and EFf refer to ecological footprint from consumption of biological resources, built-up land, and fossil fuel emissions, respectively.
The agricultural product is harvested from cropland, forest, pasture, and fishing ground. Their EF can be estimated by the following formula:
where i is the kind of agricultural products humans consumed; BR is the quantity of biological products consumed (t/year or m3 round wood/year for forest); YF is the yield factor, which can be estimated from local yield and national average yield (nha/ha); EQF is the equivalence factor; LY is the regional yield of the product (t/ha/year or m3 round wood/ha/year for forest).
EF from occupied built-up land can be derived from actual land-use image and then multiplies the YF and equivalence factor of cropland (Wackernagel, Onisto, and Bello et al. Citation1999). Since land uses other than cropland may also contribute to the converted built-up area, the YF and equivalence factor of built-up land in this study were estimated from actual land-use conversion. Thus, the EF of built-up land can be presented as follows (Li, Zhang, and Chang et al. Citation2018):
where UA is the built-up land area (ha); PAi is the percentage of the converted area from land use i to the total land area converted to built-up land; and YF and EQF are the yield factor (nha/ha) and equivalence factor of land use.
Carbon dioxide emitted from anthropogenic activity poses an important threat to the natural ecosystem. Its EF is quantified as the additional land area that can absorb CO2. Since forest is usually the largest CO2 consumer in terrestrial ecosystems, fossil energy lands are treated as the forest area needed for taking up CO2. The EFf can be described as follows:
where FE is the total CO2 emitted from fossil combustion (t C/year), which is usually estimated from burning coal, oil, and natural gas; So is the proportion of CO2 absorbed by oceans, which is about 35.2% (Sarmiento and Gruber Citation2002); FS is the global average forest CO2 sequestration (t C/ha/year), which is 0.45 t C/ha/year estimating from the reference Pugh, Lindeskog, and Smith et al. (Citation2019); and EQFf is the equivalence factor of forest.
Biocapacity and its revised form from terrestrial carbon sinks
Natural resources are the basis for calculating carrying capacity in a specific region. Various land use can supply a lot of ecosystem services such as food and absorb carbon dioxide for human society. Since the productivity of land use is different across the world, land-use area will firstly be transformed into national or global land-use area by multiplying its YF. Different land use will then be aggregated to national or global hectares by multiplying its equivalence factor.
where i is the set of five land-use types; LA is the area of land use (ha); EQF is the equivalence factor; and YF is the yield factor (nha/ha).
Different from traditional form (6), CS in the region is expressed as an important item of carrying capacity (7).
where i is the set of five land-use types; LA is the area of land use (ha); EQF is the equivalence factor; YF is the yield factor (nha/ha); CS is carbon sink of HWP in the region (t/year); FS is the CO2 sequestration of forest (t C/ha/year); and EQFf is the equivalence factor of forest.
The ocean and the terrestrial biosphere act as the two significant sinks of carbon in nature (Sarmiento and Gruber Citation2002). The magnitude of CS is usually calculated as the difference in carbon stocks at different periods, which can be estimated by atmospheric inverse model (Cheng, Cheng, and Wu et al. Citation2017) or NPP (Fang, Guo, and Piao et al. Citation2007). Due to data scarcity and model uncertainty, estimating CSs at local scales is rare in the current scientific research. Most studies of CSs have been carried out at global or national scales (Pugh, Lindeskog, and Smith et al. Citation2019; Fang, Guo, and Piao et al. Citation2007). In China, CS of forest and pasture is found to be highly related to NPP (Fang, Guo, and Piao et al. Citation2007), based on which regional CS could be calculated (Fang, Guo, and Piao et al. Citation2007; Yang, Ma, and Zhu et al. Citation2016). It is worth noting that CS can only be estimated when NPP value is within the extent between 114 and 536 g C·m−2·year−1; otherwise, negative value will be expected, which is a great limitation for this model. What is more, the estimated CS is the total amount of products from forest and pasture ecosystem, which may cause double counting for forestland. To avoid the unrealistic estimation of CSs in the region, CS of HWP is estimated from the following model revised from references (Liu et al., Citation2018; Yang, Ji, and Yang et al., Citation2013).
where CS is carbon sequestration rate of HWP in the region (t/year); CSS indicates the carbon stock of HWP in a specific year, CSS (1990) = 0 (t/year); k is the decay coefficient representing the annual rate at which the product goes out of use, citing from reference (Liu et al., Citation2018); TP is the timber production (m3); D refers to the density of timber (t/m3); CBC is the carbon content coefficient for timber; and i refers to the year studied. Different from the current HWP carbon storage assessment, the CS estimated from formulas 1 and 2 is CS contributed from local forest production; thus, no export or import is considered here.
Calculation of YF and equivalence factor based on NPP
YF and EQF are two key factors affecting EF calculation, and they can be estimated from detailed agricultural production of local and national or global agriculture. However, it is usually difficult to get a full inventory of agricultural goods at different spatial scales, and the data vary a lot across years. In this study, NPP is used to estimate the YF and EQF for the basin following the methods suggested by references Venetoulis and Talberth, Citation2008; Liu, Fu, and Jiang et al., Citation2019).
where LNPPi is the local NPP of type i biological production area (g C·m−2·year−1); NNPPi is the national NPP of type i biological production area (g C·m−2·year−1); and NAi is the national area of type i biological production area (ha).
Data sources
Land use at 30 m resolution for the basin in 2015 was obtained from Tsinghua University Land Use Internet Database (http://data.ess.tsinghua.edu.cn/). The land-use data were then aggregated on the ArcGIS (10.2) Platform to six land-use types (Table S1). The annual NPP data at 1 km resolution from 2000 to 2010 of China are calculated by the GLM_PEM model and were downloaded from the Resource and Environmental Data Cloud Platform (http://www.resdc.cn/Default.aspx). Human population, crop productions, and other socioeconomic data at city unit are derived from associated provincial and agricultural statistical yearly book (2016), and the data were then aggregated to the basin based on area-weighted methods. The human population at 250 m resolution accessed through Resource Watch (http://www.resourcewatch.org). Forest productions and wood-based panels from 1990 to 2017 were obtained from China Forestry Statistical Yearbook and China statistical Yearbook. Land-use and socioeconomic data are two key input data for estimating CSs, EF, and biocapacity in this study. Main socioeconomic data are obtained in the year 2016 in this study. However, since land-use data cannot be obtained annually, we selected the land-use data in 2015 which is the nearest year available to calculate related index in this study. Although land use may change over time, especially at small spatial scales, the change for 1 year at about 1.8 million square kilometers (the area of the Yangtze River basin) is supposed to be negligible.
Results
Estimating HWP carbon sinks in the Yangtze River basin
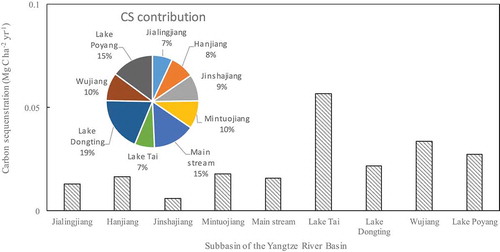
Based on timber production from the 19 regions in the Yangtze River basin, carbon sequestration of HWP was estimated at subbasin scales. In 2016, HWP in the Yangtze River basin is 2.99 Tg C/year, and there is great variety across different subbasins (). HWP in the Lake Dongting watershed contributed 19% of the total CS in the basin, ranking the largest contributed region. However, in terms of CS ability per area, Jialingjiang ranks the lowest, while Lake Tai ranks the highest. The two regions are located at upstream and downstream the basin. It is interesting to find that from upstream to downstream, CS per area is decreasing, indicating that forest protection measures are more strict in upstream regions.
Figure 2. Carbon sequestration of HWP across different subbasins and their contributions in the Yangtze River basin in 2016.
Calculating YF and EQF of the Yangtze River basin
Based on multiple-year average of NPP (Table S2), YFs and EQFs for the Yangtze River basin were estimated by comparing regional NPP to national NPP (Table S3). On average, the YFs of cropland, pasture, and fishing ground in the basin are higher than 1.0, indicating that productivities of these land uses in the basin are higher than averages of China (). However, the YFs for different productive land used vary from each other. Pasture has the highest YF value, while forest has the lowest. Besides, the YFs vary greatly across different subbasins, and the YFs in the upstream subbasins generally are smaller than the downstream subbasins because a large area of snow and ice land use locating in the Tibet and Qinghai plateau (Figure S1). Different from the traditional method of estimating the YF for built-up land which assumed that built-up land is entirely derived from cropland, the YFs of built-up lands are estimated from actual land-use conversion. Therefore, the YFs of built-up lands in the subbasins are not the same as cropland.
Table 1. YFs for different regions in the Yangtze River basin.
The EQFs are estimated from actual NPP of China that averages over the 2000s and the land use in 2015. The EQFs of cropland, forest, pasture, fishing ground, and built-up land in the basin are 1.15, 1.83, 0.31, 0.77, and 1.20, respectively. The results of EQFs estimated in this study are different from some studies (Liu and Li Citation2009) in which the EQF of cropland is 1.74, and the difference is from the estimated NPP for cropland. In this study, NPP for the cropland is calculated as 499 g C m−2 year−1, while it was calculated as 741 g C m−2 year−1 in the reference. Since only 1 year (2001) of NPP was used in the reference, the interannual variety is overlooked which may bring uncertainty in the calculation. Our estimated NPP for the cropland is similar to the result based on averages of 2001–2010 which is 412 g C m−2 year−1(Wang, Shi, and Wang et al. Citation2017), indicating that multiple-year average is important for estimating EQF by the NPP method.
Biological carrying capacity of the Yangtze River basin
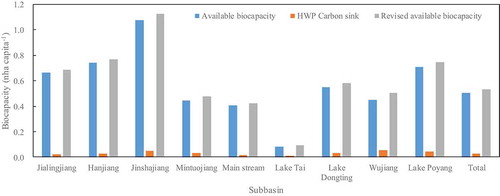
Based on the actual land use in 2015, biocapacity for the Yangtze River basin is estimated as 0.5759 nha per capita (). The BCs across subbasins diversify substantially due to the difference in land use and human density. Jinshajiang enjoys the largest biocapacity (1.225), while Lake Tai ranks the least (0.091). Apart from differences in land use across the subbasins, population density can well explain the distribution of biocapacity among subbasins (Figure S3). In the Lake Tai watershed, human population density is 1706 capita per km2, ranking the highest across the subbasins. By contrast, in Jinshajiang, there is only 50 capita per km2. Forest contributed the most biocapacity in the basin, making up 65.1% of the total for the whole Yangtze River basin. However, the percent of forest varies a lot across the watershed, ranging from 24.3% to 74.3%, and only in Lake Tai, the cropland outnumbered the forest. Since a certain proportion of biological carrying capacity has to be reserved for protecting biodiversity, the accessible biocapacity is only 88% of the total biocapacity (). Incorporating CS in the biocapacity, the revised biocapacity for the whole basin increased from 0.5068 nha per capita to 0.5338 nha per capita, increasing by 5.3%. For different subbasins, the proportion of CSs to accessible biocapacity varies from 3.3% to 16.7%. In Lake Tai and Wujiang, incorporating HWP in the CSs can increase their biocapacity by more than 10%, indicating the importance of CSs in carrying capacity assessment.
Figure 3. Total existing biocapacity for different subbasins in the Yangtze River basin in 2015.
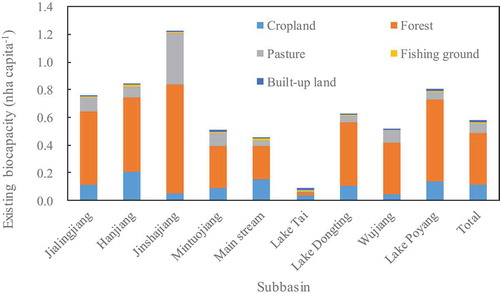
Figure 4. Available biocapacity and its revised form from carbon sink in the Yangtze River basin.
Discussion
Comparison of EF between conventional and revised models
Based on food and energy consumption in the basin, EF was estimated for the whole basin and its subbasins (). The EF of the Yangtze River basin is 5.598 nha per capita, and it ranges from 3.904 to 9.337 nha capita−1. Compared to the biocapacity, EF in the basin is much larger than the BC. If CSs are not considered, the RE is 11.0, indicating that EF is 10 times overshoot of the BC. The largest overshoot is found in Lake Tai basin, the population of which is mostly dense in the basin. Although the RE of Lake Poyang basin is the smallest, it is still in heavily overshoot status. When HWP CSs are considered, the revised RE is smaller than the original values due to the significant increase in BC (). The ratio of EF to BC decreases from 11.0 to 10.5 for the whole basin, and the ratios range from 3.2% to 14.3% across different watersheds.
Figure 5. Components of ecological footprint in the Yangtze River basin in 2015.
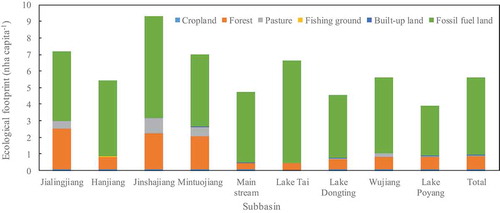
Figure 6. Comparison of ecological footprint and biocapacity between traditional and revised methods.
Figure 7. Carbon sequestration of HWP and forest and pasture across different subbasins in the Yangtze River basin.
Estimated HWP and total carbon sinks in the Yangtze River basin
To invest the role of HWP in the whole terrestrial ecosystem CS, the carbon sequestration in the Yangtze River basin is calculated by the regression model from 1 -km resolution NPP (Fang, Guo, and Piao et al. Citation2007) (Figure S2). The results showed that CS in the whole basin is 0.125 Mg C/ha/year (). Considering the area in the basin that can take up carbon, the total amount of CS in the basin is 29.30 Tg C/year. The terrestrial CS in China is about 96.1–106.1 Tg/year (Fang, Guo, and Piao et al. Citation2007). CS in the Yangtze River basin accounts for about 27.6–30.5% of China. According to land use in 2015, forest and pasture in the Yangtze River basin make up 30.7% and 13.0% of China, respectively. The CS in this study is well consistent with the spatial distribution of land uses. However, there is great uncertainty in CS calculation in China, and some land use may shift between sinks and sources of carbon (Piao, Fang, and Huang Citation2010). Carbon sequestration varies a lot across different subbasins. Based on CS ability per area, Jialingjiang ranks the lowest, while Wujiang ranks the highest (). Although CS is well correlated to NPP, their relationship is nonlinear. Therefore, it is difficult to explain the distribution of CS merely from NPP. The lowest NPP in the subbasins is located in Jinshajiang watershed (296 g C m−2 year−1) and the highest is in Lake Poyang (958 g C m−2 yr−1), but they both are not the extremes of CSs. It is interesting to find that no significant linear correlation is observed between carbon sequestration from that of HWP and that of forest and pasture (p > 0.1). The CS estimated from HWP makes up 18% of forest and pasture and varies from 5% to 45% across subbasins, leaving more than 50% uncalculated CSs. Although great uncertainty exists in the CS calculation of forest and pasture (Fang, Guo, and Piao et al. Citation2007), other potential CSs need to be investigated and assessed in the future.
Limitation of this study
In this study, only HWP are considered as new CSs, but other CSs such as pasture and soil sinks may also act as significant CSs (Sarmiento and Gruber Citation2002; Fang, Guo, and Piao et al. Citation2007; Mccauley, Robles, and Woolley et al. Citation2019), and it is important to incorporate other CSs in the EF calculation when data are available. Traditional EF calculation assumes that biologically productive areas are mutually exclusive (Wackernagel, Onisto, and Bello et al. Citation1999), based on which carbon dioxide absorption is excluded from the functions of forest and pasture. Since it is difficult to extract firework from the total areas due to lack of data, the BC results in this study may be overestimated. The YFs and EQFs are key factors influencing EF calculation, and they are calculated from NPP. The NPP may vary significantly across different years (Zhu, Zhao, and Zhu et al. Citation2017), but only a short period (11 years) in this study is used, which may bring uncertainty to the estimation. The YFs and EQFs derived from NPP are different from other methods (Venetoulis and Talberth Citation2008; Barrahmoune, Lahboub, and El Ghmari Citation2019) and are not even consistent with the results from NPP due to diverse calculation methods of NPP and land-use classification (Liu and Li Citation2009), implying that the NPP-based YF and EQF estimation is still challenging. CS estimation based on NPP can only be used within a small range of NPP values, and it is of great need to develop a reliable approach for estimating CS at various scales.
Conclusions
Biologically productive space for sequestrating CO2 is one of the most essential components of EF for a region, usually ranking the biggest contributor. The classic approach of the EF accounting system assumes that biologically productive land uses are mutually exclusive and forest is excluded from CS calculation, leading to underestimation of carrying capacity. In this study, a new calculating framework incorporating HWP CSs to biocapacity was established and was applied to the Yangtze River basin. Results showed that incorporating carbon sinks can significantly improve the biocapacity of the basin, and in some subbasins, CSs are enhanced by 10% compared to their original calculated biocapacity. Therefore, the role of CSs from HWP on EF accounting needs to be fully considered. The model established in this study supplies a primary method to incorporate CSs from HWP in EF accounting, which proved to be very important in intense forestry production areas. To accurately estimate the impact of CSs on biocapacity, more efforts should be done on developing a reliable approach to estimate various CSs at regional scales and to tackle the problem of exclusive assumption of biologically productive areas in EF.
Author contributions
Conceptualization, W.G.; Data curation, G.C.; Formal analysis, G.C. and C.L.; Original draft preparation, W.G.; and Review and editing of final manuscript, W.G. and C.L.
Acknowledgments
This work was supported by the National Natural Science Foundation of China (No. 41701631; 31660169), Natural Foundation for Youth Scholars of Yunnan Province of China (Y0120160068), Joint Grant of Yunnan Provincial Science and Technology Department – Yunnan University Major Project (2018FY001-007), and Yunnan Science and Technology Major Project (2018BC002).
Disclosure statement
The authors declare no conflict of interest.
Supplementary materials
Figures and tables of detailed information on the calculation of EF to this article can be found in the Supplementary material here.
Additional information
Funding
References
- Barrahmoune, A., Y. Lahboub, and A. El Ghmari. 2019. “Ecological Footprint Accounting: A Multi-scale Approach Based on Net Primary Productivity.” Environmental Impact Assessment 77: 136–10. doi:10.1016/j.eiar.2018.12.003.
- Beynon, M. J., and M. Munday. 2008. “Considering the Effects of Imprecision and Uncertainty in Ecological Footprint Estimation: An Approach in a Fuzzy Environment.” Ecological Economics 67 (3): 373–383. doi:10.1016/j.ecolecon.2008.07.005.
- Bonilla, S. H., F. Papalardo, C. A. Tassinari, J. B. Sacomano, and F. R. de Carvalho. 2019. “Contribution of the Paraconsistent Tri-Annotated Logic to Emergy Accounting and Decision Making”. Ecological Modelling 393: 98–106. doi:10.1016/j.ecolmodel.2018.12.015.
- Castellani, V., and S. Sala. 2012. “Ecological Footprint and Life Cycle Assessment in the Sustainability Assessment of Tourism Activities.” Ecological Indicators 16: 135–147. doi:10.1016/j.ecolind.2011.08.002.
- Cheng, J., J. M. Cheng, J. X. Wu, and Y. T. Xu. 2017. “Changes of Land Use and Ecosystem Service Functions in Yangtze River Basin from 2000 to 2010.” Resources and Environment in the Yangtze Basin 26 (6): 894–901. in Chinese.
- Fang, J. Y., Z. D. Guo, S. L. Piao, and A. P. Chen. 2007. “Terrestrial Vegetation Carbon Sinks in China, 1981-2000.” Science in China 50 (9): 1341–1350. DOI:10.1007/s11430-007-0049-1.
- Fischer‐Kowalski, M., and H. Haberl. 1998. “Sustainable Development: Socio-economic Metabolism and Colonization of Nature.” International Social Science Journal 50 (158): 573. doi:10.1111/1468-2451.00169.
- Ji, C., H. Yang, Y. Nie, and Y. Hong. 2013. “Carbon Sequestration and Carbon Flow in Harvested Wood Products for China[J].” International Forestry Review 15 (2): 160–168. DOI:10.1505/146554813806948530.
- Jmo, S., and D. O. Hall. 2010. “The Global Carbon Sink: A Grassland Perspective.” Global Change Biology 4 (2): 229–233.
- Lenzen, M., and S. A. Murray. 2001. “A Modified Ecological Footprint Method and Its Application to Australia.” Ecological Economics 37 (2): 229–255. doi:10.1016/S0921-8009(00)00275-5.
- Li, J., X. Zhang, X. Chang, and W. Gao. 2018. “Revising Yield and Equivalence Factors of Ecological Footprints Based on Land-Use Conversion.” Sustainability-Basel 10:410711.
- Lin, D., L. Hanscom, A. Murthy, A. Galli, M. Evans, E. Neill, M. Mancini et al. 2018. “Ecological Footprint Accounting for Countries: Updates and Results of the National Footprint Accounts, 2012–2018.” Resources 7 (3): 58. DOI:10.3390/resources7030058.
- Liu, M. C., and W. H. Li. 2009. “The Calculation of China’s Equivalence Factor under Ecological Footprint Mode Based on Net Primary Production.” Journal of Natural Resources 24 (9), in Chinese: 1550–1559.
- Liu, W., X. Wang, B. Liu, Y. Luo, F. Lu, and Z. Ouyang. 2018. “Full Accounting of the Greenhouse Gas Budget in the Forestry of China[J].” Mitigation and Adaptation Strategies for Global Change 23 (5): 643–666. DOI:10.1007/s11027-017-9753-0.
- Liu, X., A. H. W. Beusen, L. P. H. Van Beek, J. M. Mogollon, X. B. Ran, and A.F. Bouwman. 2018. “Exploring Spatiotemporal Changes of the Yangtze River (Changjiang) Nitrogen and Phosphorus Sources, Retention and Export to the East China Sea and Yellow Sea”. Water Research 142: 246–255. doi:10.1016/j.watres.2018.06.006.
- Liu, X., J. Fu, D. Jiang, J. W. Luo, C. X. Sun, H. M. Liu, R. H. Wen, and X. F. Wang. 2019. “Improvement of Ecological Footprint Model in National Nature Reserve Based on Net Primary Production (NPP).” Sustainability-Basel 11:21.
- Liu, Y., S. Piao, T. Gasser, P. Ciais, H. Yang, H. Wang, T. F. Keenan, M. T. Huang, S. Q. Wan, J. Song, et al. 2019. “Field-experiment Constraints on the Enhancement of the Terrestrial Carbon Sink by CO2 Fertilization.” Nature Geoscience. doi:10.1038/s41561-019-0436-1.
- Mccauley, L. A., M. D. Robles, T. Woolley, R. M. Marshall, A. Kretchun, and D. F. Gori. 2019. “Large-scale Forest Restoration Stabilizes Carbon under Climate Change in Southwest United States.” Ecological Applications, 29 (8): e01970.
- Mostafa, M. M. 2010. “A Bayesian Approach to Analyzing the Ecological Footprint of 140 Nations.” Ecological Indicators 10 (4): 808–817. doi:10.1016/j.ecolind.2010.01.002.
- Piao, S. L., J. Y. Fang, and Y. Huang. 2010. “Carbon Balance of Terrestrial Ecosystems in China.” China Basic Science 2: 20–22. in Chinese.
- Pugh, T. A. M., M. Lindeskog, B. Smith, B. Poulter, A. Arneth, V. Haverd, and L. Calle. 2019. “Role of Forest Regrowth in Global Carbon Sink Dynamics.” Proceedings of the National Academy of Sciences of the United States of America 116 (10): 4382–4387. DOI:10.1073/pnas.1810512116.
- Rees, W. E. 1992. “Ecological Footprints and Appropriated Carrying Capacity: What Urban Economics Leaves Out.” Environment & Urbanization 4 (2): 121–130. doi:10.1177/095624789200400212.
- Rockstrom, J., W. Steffen, K. Noone, Å. Persson, F. S. Chapin, E. F. Lambin, T. M. Lenton et al. 2009. “A Safe Operating Space for Humanity.” Nature 461 (7263): 472–475. DOI:10.1038/461472a.
- Sarmiento, J. L., and N. Gruber. 2002. “Sinks for Anthropogenic Carbon.” Physics Today 55 (8): 30–36. doi:10.1063/1.1510279.
- Venetoulis, J., and J. Talberth. 2008. “Refining the Ecological Footprint.” Environment, Development and Sustainability 10 (4): 441–469. doi:10.1007/s10668-006-9074-z.
- Vitousek, P. M., P. R. Ehrlich, A. H. Ehrlich, and P. A. Matson. 1986. “Human Appropriation of the Products of Photosynthesis”. Bioscience 36: 368–373. doi:10.2307/1310258.
- Wackernagel, M., L. Onisto, P. Bello, A. C. Linares, I. S. L. Falfan, J. M. Garcia, A. I. S. Guerrero, and C. S. Guerrero. 1999. “National Natural Capital Accounting with the Ecological Footprint Concept.” Ecol. Econ 29 (3): 375–390. DOI:10.1016/S0921-8009(98)90063-5.
- Wackernagel, M., N. B. Schulz, D. Deumling, A. C. Linares, M. Jenkins, V. Kapos, C. Monfreda, J. Loh, N. Myers, R. Norgaard, and J. Randers. 2002. “Tracking the Ecological Overshoot of the Human Economy.” Proceedings of the National Academy of Sciences of the United States of America 99 (14): 9266–9271. DOI:10.1073/pnas.142033699.
- Wang, L., and H. Liu. 2019. “Quantitative Evaluation of Tibet’s Resource and Environmental Carrying Capacity.” Journal of Mountain Science 16 (7): 1702–1714. doi:10.1007/s11629-018-5148-2.
- Wang, Y. H., X. Z. Shi, M. Y. Wang, and Y. C. Zhao. 2017. “Spatio-temporal Variation of NPP in Cropland Ecosystem of China during the Years from 2001 to 2010.” Acta Pedologica Sinica 54 (2): 319–330. in Chinese.
- Wang, Z., L. Yang, J. Yin, and B. Zhang. 2018. “Assessment and Prediction of Environmental Sustainability in China Based on a Modified Ecological Footprint Model”. Resources, Conservation and Recycling 132: 301–313. doi:10.1016/j.resconrec.2017.05.003.
- Yang, H. Q., C. Y. Ji, H. Yang, Y. Nie, and X. L. Chen. 2013. “Global Climate Change and China’s Contribution to Carbon Reduction: Based on Carbon Storage Accounting of Chinese Harvested Wood Products.” Journal of Natural Resources 28 (12): 2023–2033. in Chinese.
- Yang, Y. Z., Y. D. Ma, H. Jiang, Q. A. Zhu, J. X. Liu, and C. H. Peng. 2016. “Evaluating the Carbon Budget Pattern of Chinese Terrestrial Ecosystem from 1960 to 2006 Using Integrated Biosphere Simulator.” Acta Ecological Sinica 36 (13): 3911–3922. in Chinese.
- Yilanci, V., M. S. Gorus, and M. Aydin. 2019. “Are Shocks to Ecological Footprint in OECD Countries Permanent or Temporary?” Journal of Cleaner Production 212: 270–301. doi:10.1016/j.jclepro.2018.11.299.
- Zhu, Q., J. Zhao, Z. Zhu, H. Y. Zhang, Z. X. Zhang, X. Y. Guo, Y. Z. Bi, and L. Sun. 2017. “Remotely Sensed Estimation of Net Primary Productivity (NPP) and Its Spatial and Temporal Variations in the Greater Khingan Mountain Region, China.” Sustainability-Basel 9:12137.