
 ?Mathematical formulae have been encoded as MathML and are displayed in this HTML version using MathJax in order to improve their display. Uncheck the box to turn MathJax off. This feature requires Javascript. Click on a formula to zoom.
ABSTRACT
Taking two typical grain producing areas of southern (Dongting Lake Region) and northern China (Shandong Province) as examples, this study used fault tree analysis and parametric estimation to provide a comparative analysis for environmental risks of intensive arable land use. The results show that (1) in the risks of eutrophication, toxicity, soil structure, greenhouse effect and air pollution, the greenhouse effect was the most prominent with the highest discharge; (2) the Dongting Lake Region discharged less pollutants annually than did Shandong Province, while surpassing Shandong in cumulative pollutant discharge in 2007-2018; (3) the spatial distribution of environmental risk in the Dongting Lake Region was mostly concentrated in the northern area, whereas that in Shandong Province displayed a scattered pattern; (4) in the Dongting Lake Region, Yueyang, Changde, and Yiyang were high environmental risk cities in 2007-2018, whereas in Shandong Province, Zaozhuang, Heze, Liaocheng, and Dezhou exhibited higher comprehensive environmental risk indexes in 2007-2008, while Rizhao replaced them in 2018. The results indicated that ago-production material use must be controlled, reasonable zoning for areas posing environmental risks must be employed and cities with high environmental risk must be dynamically monitored to prevent the intensification of environmental risks of arable land use.
Introduction
As China’s urbanization has entered a period of rapid growth, the China State Council has implemented effective urbanization policies, aimed at moving 60% and 70% of its population into urban areas by 2020 and 2025, respectively (China State Council Citation2014). With more than 100 million people flocking into cities in the coming decades (Kuang et al., Citation2020), urbanization will place greater pressures on arable land use. In China, 67.5% of construction land was transformed from arable land from 2010 to 2015 (Liu, Ning, and Kuang Citation2018). Moreover, national arable land per capita was recorded at 0.09 hm2 and has been persistently lower than the global average (0.19 hm2) (Ministry of Land Resources of PRC Citation2016). In addition, diet changes have been identified as a nonnegligible factor for arable land use. It has been suggested that if Western high-protein diets are adopted globally, arable land resources will not be able to supply food to the world’s entire population by 2050 (Odegard et al., Citation2014) (Beghin, Meade, and Rosen Citation2017). In the near future, as the consumption habits of the Chinese population continue to change, more meat and protein consumption will generate greater demand for livestock, which may intensify pressures on arable land resources (Tilman, Balzer, and Hill Citation2011).
With pressures to generate more production from less arable land, a shift toward intensive arable land use patterns has occurred in China. In pursuit of high yields, more and more farmers are using more production materials per unit area of arable land, including fertilizers, pesticides, mulching films, agro-machinery, etc. (Muhammed, Coleman, and Wu Citation2018). Agricultural inputs have been reported to be excessive in many areas (Margoum, Morin, and Mazzella Citation2015; Rahman et al., Citation2018). For example, from 2007 to 2015, production material inputs to arable land in Shandong Province and the Dongting Lake Region’s grain producing areas increased by 34.59% and 12.65%, respectively (Yin, Lin, and Jiang Citation2019). The intensive application of production material to arable land may give rise to environmental risks with undesirable long-term effects on human health, including the degradation of water quality, forests, soils, and food chains (Power Citation2010) (Pereira, Souza, and Bernardes Citation2015).
In terms of the application of fertilizers to arable land, Shen proposed that under a precise intensive arable land use system, crop yields could be increased by at least 10% even when the use of nitrogen fertilizer is reduced by 10–30% while partial factor productivityFootnote1 could be increased by 10–15% relative to conventional farming practices (Shen, Cui, and Miao Citation2013). A later study by Chen supports these findings by showing that without any increase in fertilizer use, yields of rice, wheat, and maize could be increased from 7.2 t ha−1, 7.2 t ha−1 and 10.5 t ha−1 to 8.5 t ha−1, 8.9 t ha−1 and 14.2 t ha−1, respectively, and that if such yields could be maintained over 80% of national cropland, China’s arable land area could support food production needs by 2030 (Chen, Cui, and Fan Citation2014).
In terms of pesticide use on arable land, issues relating to pesticide residue and its toxic effects have been widely discussed. Over 80% of the soil samples collected from 11 European Member States and 6 major cropping systems were found to contain pesticide residues, of which 58% included mixtures of two or more pesticide residues (Silva, Mol, and Zomer Citation2019). A study of southern Nepal found 93% of eggplant and 100% of tomato and chili samples to contain pesticide residues, with 4% (eggplant), 19% (chili) and 44% (tomato) of samples exceeding the maximum residue limit set by the European Union (Bhandari, Zomer, and Atreya Citation2019). The highest concentrations of DDT (dichlorodiphenyltrichloroethane), a pesticide widely used in China, were measured at 132.3 µg/kg, 54.59 ng/L, and 1.874 ng/m3 in soil, water, and air, respectively, which are much higher than levels found in Europe and America (Shi Citation2017). It has been proposed that climate (storm and rainfall event frequency) and soil properties (sorption and degradation) are the main factors that influence pesticide residue levels (McGrath, Rao, and Mellander Citation2019). Moreover, it has been demonstrated that farmers’ attitudes toward environmental issues greater affect their pesticide use and that farmers with more cropland tend to be better educated about reasonable pesticide use (Abadi Citation2018). In terms of experimental monitoring, improved sampling methods are in high demand to broaden the range of contaminants that can be analyzed, including organic (herbicides, insecticides, and fungicides) and inorganic (metals) pesticides (Margoum, Morin, and Mazzella Citation2015). As the collection and analysis of samples are time-consuming and laborious, it has been an ongoing focus of studies on the large-scale real-time monitoring of pesticide residues in the environment.
Regarding mulching film use, statistical data show that 1.44 million tons of mulching films are applied to 18.66 million hm2 of arable land in China annually and that application levels have increased over the past decade (China’s Bureau of Statistics Citation2018). As mulching film degrades slowly, mulching film residue can remain in the soil for hundreds of years. The accumulation of this residue hardens the soil, decreasing soil permeability and fertility levels and gradually affecting crop yields and environmental sustainability (Jiang, Liu, and Wang Citation2017). When mulching film residues in the soil reach 58.5 kg hm−2 (75% of the film remains in the upper 10 cm soil layer), wheat, maize, and rice yields decrease by 14.6–59.2%, 9–16%, and 11–23%, respectively (Hui, Xu-rong, and Chang-rong Citation2008). Over the long run, under wind erosion and rainfall, mulching films are often broken into pieces, making them more difficult to collect and disposing of (Qi, Yang, and Pelaez Citation2018). Plastic mulching film residues in the soil are likely to break down into nanoplastics, which may then be more easily transferred into and accumulated in plants (Lwanga, Thapa, and Yang Citation2018). While numerous studies have been devoted to developing biodegradable mulching films (Bandopadhyay, Martin-Closas, and Pelacho Citation2018), due to the high cost of the extraction of natural polymers (e.g., alginate extracted from brown algae), the widescale use of biodegradable mulching film is still far from reality (Brodhagen, Goldberger, and Hayes Citation2017).
In terms of machinery use, contaminant emissions of agro-machinery have been widely discussed in recent years. More than 40%, 52%, and 84% of global carbon dioxide, methane, and nitrous oxide are discharged by agricultural production, among which agro-machinery fuel use accounts for roughly 5% of global energy use, rendering it an important source of agricultural pollution (Smith, Martino, and Cai Citation2008). It has been shown that based on the different engine speeds of agricultural machines, maximum emissions of CO2, NOX, and CO can reach up to 1338 g/kWh, 10.2 g/kWh, 33.64 kg/t, and 4.79 kg/t, respectively (Lu, Huang, and Hu Citation2017) (Lovarelli, Fiala, and Larsson Citation2018). While the possibility of mitigating pollutant discharge by agro-machinery was proved (Pan, Xu, and Smith Citation2010) (Kulak, Graves, and Chatterton Citation2013), energy dedicated to agro-machinery use in China increased from 117.499 million kWh to 987.873 million kWh over the past three decades (State Statistics Bureau of China Citation2018), rendering agro-machinery emissions a considerable source of environmental risk.
Previous studies draw a common conclusion, i.e., though agro-environmental risk resulting from excessive fertilizer, pesticide, mulching film, and agro-machinery use has increased in recent years, the large-scale real-time monitoring of the agro-environment is still difficult to realize in large regions. As a result, it is necessary to assess agro-environmental risk from a holistic perspective, which is the main goal of this study.
Currently, environmental risk is typically assessed via life cycle assessment (LCA), environmental impact assessment (EIA), and ecosystem service valuation (ESV). LCA involves evaluating environmental impacts across the production life cycle (i.e., “from the cradle to the grave”), including processes of raw material acquisition, production, use, and disposal. However, while effective, the LCA method requires the use of detailed data spanning long time periods, making it difficult to obtain basic data (Yang, Ngiam, and Ong Citation2015). EIA involves assessing possible environmental impacts of human activities (including construction projects, resource development, regional development, policy development, legislation, regulation, etc.) and normally involves the following stages: screening, scoping, reporting, reviewing, decision-making, and monitoring (Convention on Biological Diversity, UN Citation2019). An EIA can be intuitively expressed and illustrated by quantitative environmental impact indicators obtained by analyzing the dates of products or systems and can judge degrees of environmental impact. Unlike EIA, ESV typically measures environmental costs and benefits in monetary units (US$). Expressing environmental impacts in monetary terms helps balance environmental and financial benefits and costs within the same unit of measurement, and the monetary unit used for ES always follows inherent laws of the pollutant emission structure and effects on the environment. No specific standards or guidelines for agro-environmental risk assessment have been developed. This lack of specific guidelines may lead to various approaches to the quantification of agro-environmental risk and to variations between agro-environmental risk research results. As a result, a one-size-fits-all approach to ago-environmental risk assessment is difficult to obtain. Furthermore, current studies on environmental risk assessment present certain limitations. First, due to the complexities of agro-environments, most studies have focused on single environmental risks (e.g., pesticide surplus, mulching film residue, etc.) affecting areas of arable land while few have evaluated overall agro-environmental risks based on a suite of pollutants. In addition, due to differences between local planting systems and dietary structures, it is important to conduct comparative research to develop region-specific policies for arable land management. Few comparative results of different local environmental risk evaluations have been reported, especially for major national grain producing areas (Pereira, Souza, and Bernardes Citation2015).
From this perspective, the identification and evaluation of holistic environmental risks resulting from arable land use are a realistic goal in need of further study and comprehensive solutions. Therefore, the following three questions are addressed in this study:
How can potential agro-environmental risks of intensive arable land use be identified?
How can environmental risk be evaluated from a holistic perspective?
What spatial-temporal differences in environmental risks are found between different grain producing areas with different intensive arable land use characteristics?
In addressing these questions, this work establishes an evaluation model of holistic agro-environmental risks of intensive arable land use and is organized as follows. Section 2 introduces the methods, data, and study areas employed. Section 3 presents the main results on the long-term evolution of and spatial differences in environmental risk resulting from intensive arable land use in the two study areas. Section 4 discusses implications of our results, limitations of this study, and policy recommendations. Section 5 summarizes the conclusions of the key findings, policy implications, and avenues for future research.
Materials & methods
Identification and classification of environmental risks
A fault tree analysis (FTA) is conducted to identify potential environmental risks resulting from intensive arable land use processes. FTA is a deductive failure analysis method applied to security systems. Based on a possible fault event, FTA uses Boolean logic to identify direct and indirect causes of the fault in a top-down direction until all basic causes are found (Wikipedia Citation2018). The FTA method uses reversed tree-shaped diagrams or fault tree diagrams. By using event symbols and logic gates, a fault tree diagram can clearly express logical causal relationships between causes and a fault. Basic events lead to intermediate events, which then result in the final fault event. Logic gates are used to express logical relationships between these events and usually include “and,” “or” or “exclusive or.” This approach has been used to identify risk factors in many fields, including aerospace, nuclear power, chemical engineering, software programing, and social services (Center for Chemical Process Safety Citation1999, Citation2008).
In this study, the top layer of the fault tree diagram is defined as the fault event, i.e., environmental risk resulting from intensive arable land use (). In the lowest layer of the diagram, possible basic events resulting from intensive arable land use process are listed. Each basic event aggravates the emissions or discharge of corresponding contaminants, further resulting in the final fault event. For instance, the excessive use of chemical fertilizers (basic event) contributes to nitrogen and phosphorus surpluses gathered by runoff, rainfall, and irrigation (intermediate event), which then leads to eutrophication (intermediate event) and higher levels of environmental risk (fault event). In taking all possible basic events into consideration, five types of environmental risk that contribute to total environmental risk are classified: eutrophication, toxic pollution, GHG effect, air pollution, and soil structure damage risks. From this diagram, comprehensive environmental risk is evaluated based on these five individual forms of environmental risk.
Figure 1. Fault tree diagram of environmental risks resulting from intensive arable land use.
Evaluation model of comprehensive environmental risk
Contaminant discharge calculation methods
Based on section 2.1, the emissions of corresponding contaminants of the five types of environmental risk were calculated by parametric estimation. Following a review, we selected references focused on planting systems and geographic locations similar to those found in the studied areas. Parameters used for calculations were gathered from the results of these latest published field trials. The following formula was used:
and
denote surpluses of nitrogen and phosphorus fertilizers (kg), respectively.
is the effective fertilizer utilization percentage, which on average is equal to 30% and 40% in China for nitrogen and phosphorus fertilizers, respectively (Chen, Cui, and Fan Citation2014).
and
refer to application rates of nitrogen and phosphorus fertilizers (kg), respectively. i = 1 and 2 for nitrogen and phosphorus fertilizers, respectively.
refers to the surplus of pesticide.
is the application rate of pesticide (kg).
refers to the effective utilization percentage of pesticide, which values as 30% (Shi Citation2017).
is the surplus of mulching film (kg).
is the surplus rate of mulching film, which is valued at 50% according to field results (Zhang et al., Citation2016).
is the application rate of mulching film (kg).
,
and
denote emissions of SO2, NOX, and PM2.5 from agro-machinery fuel use, respectively.
are the emission coefficients of SO2, NOX, and PM2.5 per ton of fuel, respectively, which are valued at 9.02 kg/t, 10.53 kg/t and 1.89 kg/t, respectively (Ministry of Ecology and Environment of the People’s Republic of China Citation2018).
refers to the usage of agro-machinery fuel.
are emissions of SO2, NOx, NMVOC, CO, NH3, CO2, CH4, and PM2.5 generated from burning of crop residues, respectively.
denotes emission coefficients of SO2, NOx, NMVOC, CO, NH3, CO2, CH4, and PM2.5 per ton of crop residue burned, are valued at 0.56, 3.37, 8.17, 4.49, 0.78, 1445, 3.5, and 20.27 kg/t, respectively.
denotes crop residue left per ton of rice, wheat, corn, beans, tubers, oil crops, and fiber crops, which are valued at 0.9, 1.1, 1.2, 1.6, 1, 2, and 1.75 t/t, respectively.
= 66%, which refers to the proportion of crop residues burned in a field (Mehmood, Chang, and Yu Citation2018).
is the crop yield.
for rice, wheat, corn, beans, tubers, oil crops, and fiber crops, respectively.
The holistic environmental risk index
First, the studied pollutants were divided into five categories based on their effects: eutrophication (sum of nitrogen and phosphorus fertilizer surplus), toxic damage (sum of pesticide surplus), greenhouse gas effects (sum of CO2 and CH4 emissions), air pollution (sum of SO2, NOx, NMVOC, CO, NH3, and PM2.5), and soil structure damage (sum of mulching film surplus). Second, the pollutant emission data were then normalized into a unified range of [0,1] to account for different data magnitudes according to the following:
where is the normalized value of
,
.
and
are the maximum and minimum
, respectively. i = 1,2, … 5, representing risks of eutrophication, toxic damage, greenhouse gas effects, air pollution, and soil structure damage, respectively.
Third, the variation coefficient method was used to calculate the weights of . The variation coefficient method assumes that the larger an indicator’s internal variation coefficient, the more influence it will have on final results (Liao, Deng, and Li Citation2018). For instance, if the variation coefficient for eutrophication pollutants discharged from different cities has a larger variation coefficient than other risks, eutrophication risks can be regarded as a major indicator that affects environmental risk distribution. As a result, it should be given a larger weight. The variation coefficients of the five environmental risks were calculated as follows:
is the variation coefficient of the ith environmental risk,
is the standard deviation of the ith risk among the cities, and
is the mean value of the ith environmental risk.
Fourth, the weights for the five environmental risks were calculated as follows:
is the weight of the ith environmental risk, and
is the sum of variation coefficients of the five environmental risks.
Finally, comprehensive environmental risk index RI is calculated with Equationequation (9)(9)
(9) , and a higher RI indicates more potential environmental risk in an area:
Study areas and data sources
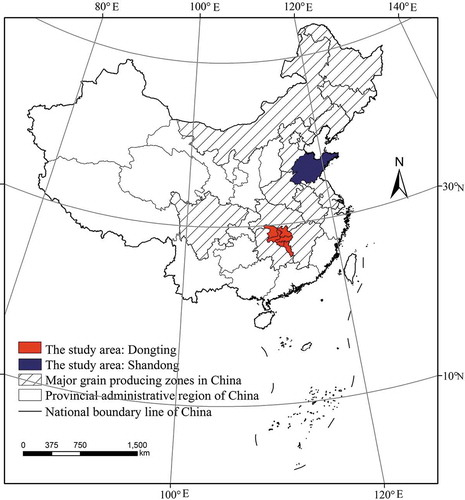
Separated by the Yangtze River, Shandong Province and the Dongting Lake Region are located in northern and southern China, respectively (). As major grain producing areas in China, Shandong Province and the Dongting Lake Region play an important role in national food supply, and both areas include considerable amounts of arable land loss due to construction land expansion resulting from rapid urbanization (Fig. S1–S4 of the Supplemental Material). Due to their different geographic locations, climatic conditions and cropping systems, which in turn result in different intensive arable land use patterns, the two areas are suitable examples for observing differences in environmental risks that affect major grain producing regions in China. Moreover, as the two areas differ spatial scale, Shandong Province and the Dongting Lake Region serve as a good case for observing environmental effects of intensive arable land use at different scales.
Primary arable land use data (e.g., arable land area, fertilizer use, pesticide use, etc.) were obtained from local statistical yearbooks (Hunan Provincial Bureau Of Statistics Citation2019; Shandong Provincial Bureau Of Statistics Citation2019). Administrative maps of the studied areas were obtained from Resource and Environment Data Platform of the Chinese Academy of Science.
Figure 2. The locations of the study areas – – Shandong Province and the Dongting Lake Region.
Results
Long-term changes in contaminant emissions
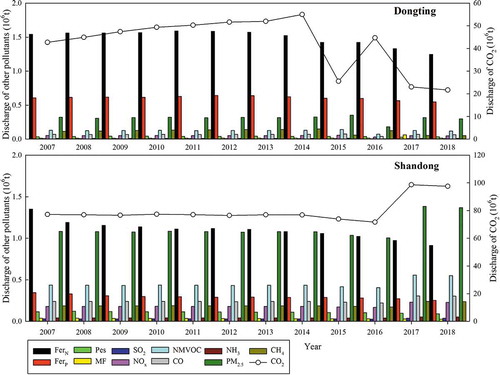
Long-term changes in contaminant emissions from 2007 to 2018 show that other than the observed decrease in nitrogen and phosphorous surpluses, levels of most air pollutants increased in the studied area with fluctuations in CO2 discharge (). Annual average values of N surplus, P surplus, pesticide surplus, mulching film surplus, SO2, NOX, NWVOC, CO, NH3, PM2.5, CO2, and CH4 in the Dongting Lake Region were 1.493, 0.610, 0.040, 0.020, 0.009, 0.051, 0.124, 0.068, 0.012, 0.309, 50.719, and 0.135 million tons, respectively. Correspondingly, yearly average discharge levels in Shandong Province reached 1.102, 0.296, 0.110, 0.033, 0.031, 0.186, 0.451, 0.248, 0.043, 1.119, 79.779, and 0.193 million tons, respectively. With the exception of nitrogen and phosphorous surpluses, most discharges of pollutants in the Dongting Lake Region were lower than those in Shandong Province. A previous study shows that Shandong Province reduced fertilizer, pesticide, mulching film inputs during this period while the Dongting Lake Region continued to increase the use of production materials, constituting a major cause of its opposing pollutant discharge trend (Yin, Lin, and Jiang Citation2019). In addition, CO2 became the most prominent contaminant, accounting for the largest proportion of total pollutant discharge (83.02% for the Dongting Lake Region and 94.5% for Shandong Province). Fluctuations in CO2 emissions in Dongting are mainly attributable to planting system changes. In the Dongting Lake Region, wheat growth usually occurs during the rainy season, and corresponding cloudy and rainy conditions often lead to serious scab development and decrease crop yields and quality. After 2014, the wheat planting area decreases, reducing crop residue levels and crop residue burning emissions. Moreover, among the air pollutants studied, emissions of PM2.5 were continuously higher than those of NMVOC, CO, and NH3. Due to crop residue burning and agro-machinery fuel use, local air quality continued to deteriorate in the Dongting Lake Region.
Figure 3. Pollutant discharge from arable land use in the Dongting Lake Region and Shandong Province.
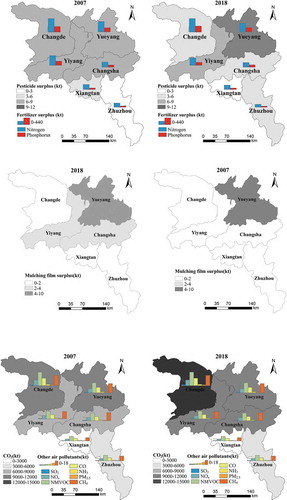
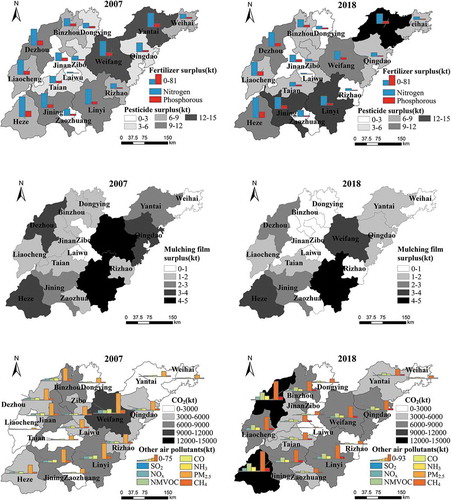
Spatial distribution of pollutant discharge among cities
To better observe changes in pollutant emissions in 2007 and 2018, pollutant emission levels are graded at equal intervals in . The results show that from 2007 to 2018, levels of each pollutant increased to varying degrees in different cities where the northern area of the Dongting Lake Region experienced higher levels of contaminant discharge than the southern region (). Pollutant discharge increments in the northern cities of Yueyang and Changde during were more significant than those in other cities, indicating an uneven spatial development of long-term environmental risk. For the different pollutants, spatial heterogeneity is observed between cities in the Dongting Lake Zone. The highest pesticide and mulching film surpluses were discharged in Yueyang. The highest nitrogen and phosphorus surpluses and CO2 emissions appeared in Changde. The southeastern cities of Zhuzhou and Xiangtan exhibited the lowest discharge of pollutants. The low emissions found in Zhuzhou and Xiangtan are mainly attributable to the presence of hilly topography and the fragmentation of cultivated land, making it difficult for the local area to increase arable land use levels with large-scale planting and production material application.
Figure 4. Distribution of pollutants in the Dongting Lake Region in 2007 and 2018.
Twelve years of pollutant accumulation in the Dongting Lake Region are reflected in . In terms of cumulative total emissions for 2007–2018, on average, one city discharged 2987, 1220, 80, 41, 18, 107, 260, 143, 25, 101,438, 275 and 644 thousand tons of ,
, Pes, MF, SO2, NOX, NWVOC, CO, NH3, PM2.5, CO2, and CH4, respectively. The cumulative sum of pollutants generated from 2007 to 2018 varied in Changsha, Zhuzhou, Xiangtan, Yueyang, Changde, and Yiyang. The highest levels of cumulative pollutant discharge appeared in Changde while the lowest levels appeared in Xiangtan, which presented a large max-min range for pollutant emissions and especially for CO2. Yueyang, Changde, and Yiyang showed much higher cumulative nitrogen and phosphorus surpluses (
&
) than the other cities. The cumulative surplus of pesticide and mulching film was highest in Yueyang, and the cumulative sum of other air pollutants was highest in Changde. On the whole, potential agro-environmental risks were more concentrated in the northern area of the Dongting Lake Region.
Table 3. Cumulative discharges for cities of the Dongting Lake Region from 2007 to 2018 (unit: 103 t).
Different from the concentrated distribution pattern of pollutant discharge found in the Dongting Lake Region, contaminant emissions in Shandong Province show a dispersed distribution pattern (). The coastal cities Yangtai and Weifang show higher pesticide surpluses. As an undeveloped agricultural city, Heze presents the highest levels of nitrogen surplus discharge. As the most populous city in Shandong Province, Linyi shows significantly higher pesticide, nitrogen fertilizer and mulching film surplus and CO2 levels. As the largest vegetable production base in China, Weifang has benefitted from the scaled management of arable land, showing slight decreases in pesticide and fertilizer surplus, mulching film residue and air pollutant discharge values. In general, pollutant discharge levels increased from 2007 to 2018 trend where the cities of Heze, Dezhou, Linyi, and Weifang show the highest degrees of environmental risk. As the most developed city studied here and the capital city of Shandong Province, Qingdao, and Jinan, respectively, show lower levels of pollutant discharge than surrounding cities in the same period.
Figure 5. Distribution of pollutants in Shandong Province in 2007 and 2018.
The sum of cumulative pollutant discharge for cities in Shandong Province from 2007 to 2018 differs considerably from those in the Dongting Lake Region (comparing and ). The highest twelve-year nitrogen and phosphorous surpluses appear in Heze, whereas the highest levels of cumulative air pollutants are found in Linyi. Yantai and Weifang exhibited the highest cumulative pesticide and mulching film surpluses from 2007 to 2018, respectively. Regarding mean values of long-term cumulative discharge generated by the cities, cities in Dongting discharged nearly six times more nitrogen surplus, four times more pesticide surplus, twice the mulching film surplus, and twice the CO2 and CH4 levels as cities in Shandong. While most annual pollutant emissions levels generated in the Dongting Lake Region were lower than those generated in Shandong Province (section 3.1), long-term cumulative discharge in the cities followed the reverse trend. Over time, the Dongting Lake Region surpassed Shandong Province in terms of cumulative pollutant discharge due to continual increases.
Table 4. Cumulative discharge in cities of Shandong from 2007 to 2018 (unit: 103 t).
Changes in environmental risk in the Dongting Lake Region and Shandong Province
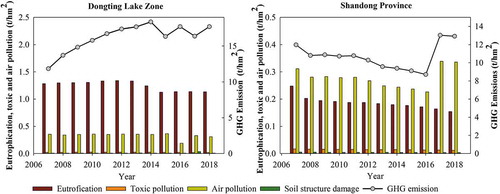
Taking differences in arable land areas of the Dongting Lake Region and Shandong Province into account, environmental risks are illustrated per unit area of arable land in . The Dongting Lake Region shows a fluctuating but increasing trend for the five forms of environmental risks, whereas Shandong Province shows decreasing trends for all environmental risks. In the Dongting Lake Region, pollutant emissions due to eutrophication, toxic pollution, GHG, air pollution, and soil structure damage risks in 2007 reached 1.28 t/hm2, 0.02 t/hm2, 0.36 t/hm2, 0.01 t/hm2 and 11.83 t/hm2, respectively, and were 1.14 t/hm2, 0.02 t/hm2, 0.31 t/hm2, 0.01 t/hm2 and 17.70 t/hm2 in 2018, respectively. In Shandong Province, total emissions attributable to eutrophication, toxic pollution, GHG, air pollution, and soil structure damage risks in 2007 reached 0.25 t/hm2, 0.02 t/hm2, 0.31 t/hm2, 0.006 t/hm2, and 11.97 t/hm2, respectively, and were 0.15t/hm2, 0.01 t/hm2, 0.34 t/hm2, 0.004 t/hm2 and 12.92 t/hm2 in 2018, respectively. In 2018, the Dongting Lake Region exhibited seven times the eutrophication risk, twice the toxic pollution risk, and three times the soil structure damage risk as Shandong Province. Per unit area of arable land, the Dongting Lake Region generally shows higher levels of environmental risk than Shandong Province ().
Figure 6. Pollutants discharged per unit of arable land area attributable to five forms of environmental risk.
Based on the evaluation model shown in section 2.2, the five kinds of environmental risk tested in each city of the Dongting Lake Region are illustrated in line charts in , and comprehensive environmental risk indexes are shown in bar graphs. The cities show common fluctuations and general decreases in comprehensive environmental risk index values where Xiangtan, Yueyang, Changde, and Yiyang present much higher comprehensive environmental risk indexes than Changsha and Zhuzhou. In terms of variations in GHG risk, Changsha and Zhuzhou experienced a steady increase in CO2 emissions with slight fluctuations after 2016 while other cities experienced a decrease in CO2 emissions in 2016, which increased rapidly after 2017. Regarding eutrophication risk, Changsha and Zhuzhou experienced a continuous decrease in eutrophication from 2007 to 2018 while other cities showed initially increasing and then decreasing levels. Air pollution, toxic, and soil structure damage risk levels were relatively constant and low among these cities.
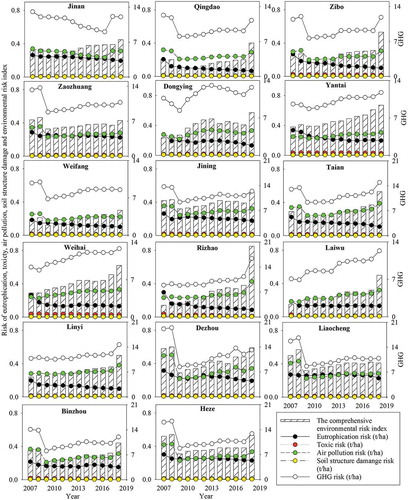
In Shandong Province (), except in the case of Zaozhuang and Liaocheng, most cities in Shandong Province showed an increase in comprehensive environmental risk from 2007 to 2018. Zaozhuang, Heze, Liaocheng, and Dezhou showed higher comprehensive environmental risk indexes from 2007 to 2008 while in 2018, Rizhao presented the most environmental risk. This shows that environmental risk resulting from intensive arable land use worsened with time in Shandong Province. Contrary to trends observed in Dongting Lake, GHG risks in cities of Shandong Province first fell and then rose. Similarly, air pollution risks first decreased and then increased in most cities. In addition, eutrophication risks continuously decreased, whereas soil structure damage and toxic risks remain constant in most cities of Shandong. Overall, the distribution of environmental risks among cities was unstable and changed over time, stressing the importance of frequently identifying cities exposed to more environmental risk.
Figure 7. Long-term changes in environmental risk among cities in the Dongting Lake Region.
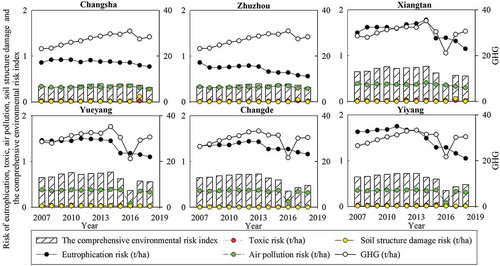
Figure 8. Long-term changes in environmental risk among cities in Shandong Province.
Discussion
Arable land use zoning based on production & environment
Considering both production and environmental risk control in arable land use zoning is critical in agro-environment management. In the Dongting Lake Region, high levels of environmental risk appeared in Yueyang and Changde. Both cities are characterized by ideal climate conditions and levels of soil productivity but are also the most ecologically vulnerable due to their proximity to Dongting Lake (Yin, Liu, and Jiang Citation2017), thus requiring more buffer space surrounding the lake and reducing arable land use intensity in these areas. In Shandong Province, while pollutant discharge levels were higher in Yantai, Weifang, Dezhou, Heze, and Linyi, the largest total environmental risk index appeared in Rizhao due to differences in arable land area. By 2018, Yantai, Weifang, Dezhou, Heze, and Linyi included 444,539 hm2, 790,137 hm2, 642,405 hm2, 826,918 hm2, and 833,769 hm2, respectively, which are 2–3 times greater than the area in Rizhao. In terms of environmental risk indexes per unit area of arable land, Rizhao faces more environmental risk, demonstrating the importance of detecting environmental risks per unit of area. Due to scattered pollutant distributions in Shandong Province, land management policies targeting specific environmental risks must be set at the city level. For instance, for Yantai and Weifang, it is imperative to set environmental protection policies that control the use of pesticides while for Heze, nitrogen fertilizer use must be controlled. In contrast, Linyi’s main focuses will involve managing mulching film use and crop residue burning.
From the results of this study, future approaches to arable land use zoning based on production and environmental conditions can be proposed. While many production-based agricultural zoning projects have been implemented in China, including in Beijing, Sichuan, Shandong, Hainan Province, etc. (Guo, Yao, and Yang Citation2010; Lian et al., Citation2011; Liu, Rong, and Lu Citation2006), production-environment-based arable land use zoning has not been effectively implemented. Some countries have managed to conduct environmentally based spatial studies of agriculture. One GIS-based study mapped pollutant emissions generated from agricultural land use in Alberta, Canada and found decreasing distributions of N2O and CH4 from northern to southern Alberta (Dimitrov et al., Citation2019). Using spatial data with a resolution of 40 m, a study of the Prairie Pothole Region in Canada mapped an eastern centralized distribution of pesticide surplus risk based on an overlay analysis of spatial parameters, including wetland density, precipitation, and properties of active ingredients of pesticides (Malaj, Liber, and Morrissey Citation2020). Based on water footprint (WF) index geostatistics, a Brazilian study identified 57 municipalities with high-water-footprint soybean planting land concentrated in the Cerrado area between Caatinga and the Amazon (Severo Santos et al., Citation2020).
The above discussion shows that effective and reasonable arable land use zoning based on agricultural production and environmental risk could be realized. According to the long-term plans of the State Council, Shandong Province and the Changsha-Zhuzhou-Xiangtan city cluster in the Dongting Lake Region are included among national preferential urbanization regions (Development planning division Citation2013; The State Council of China Citation2011). Given challenges surrounding the use of limited land resources during urbanization, spatial zoning must commit to addressing the above local differences between agro-environments by applying both strict (for environmental control) and lax policies (to stimulate agricultural production) in cities or at smaller scales.
Moderate and intensive arable land use
Our results show varying levels of environmental risk in the study areas. Dongting Lake suffered 7 times the degree of eutrophication risk, twice the degree of toxic pollution risk and 3 times the degree of soil structure damage risk per unit area than Shandong Province until 2018. The high levels of environmental risk found in the Dongting Lake Region are consistent with continuously increasing inputs of fertilizers, pesticides, and mulching films per unit of arable land area. It is widely accepted that the application of production materials to arable land exceeds crop demand, which is true both in China and abroad (Rahman and Zhang Citation2018a). As a result, it is urgently necessary to transform arable land use patterns from highly to moderately intensive to achieve sustainable agro-environment development. Realizing moderately intensive arable land use can involve set upper limits on the use of production materials based on crop demand. Second, it has been proved that intensifying agro-mechanical use can offset reductions in chemical production material inputs while maintaining moderate yields (Liu, Kuang, and Zhang Citation2014). Therefore, agro-mechanization over the crop growth lifecycle could also be increased to achieve moderately intensive arable land use. Third, moderately intensive arable land use not only applies an upper limit on production material usage but is also highly related to farm size. A study of the Nala Watershed in the southern subtropics shows that total N and P loss increases more than two-fold with every 300% increase in farm size (N loss increases from 9.91 kg/hm2 to 36.6 kg/hm2, P loss increases from 3.84 kg/hm2 to 14.2 kg/hm2) (Li, Tang, and Huang Citation2020). Given the major role of smallholders in arable land use in China (farmers), achieving moderately intensive arable land use should involve more discussions about reasonable farm size among rural households.
It is important to note that moderately intensive arable land use is an important issue in need of further examination. No standard guidelines on moderate arable land use have been set. However, the use of optimized agricultural practices (e.g., the use of slow release and organic fertilizers) has demonstrated that it is possible to increase crop yields while limiting fertilizer use and that groundwater quality can worsen due to pollution generated through organic fertilizer use (Fabiani, Vanino, and Napoli Citation2020). As a result, moderately intensive arable land use should maintain a better balance between short-term crop production and long-term environmental protection, which will require long-term field research and new agro-technology development.
Research reliability and uncertainties
The comprehensive environmental assessment of a complex system has been conducted before. Since 1994, indicators have been measured to evaluate sustainable agricultural practices used across 17 arable farms in the Rhine Plain along the border between France and Germany (Girardin, Bockstaller, and Van der Werf Citation2000). An assessment of residential land environments was carried out in Slovenia by examining 12 indicators related to residential environments in terms of environmental, sociological, functional, and cultural factors (Skalicky et al., Citation2019). In the present study, pollutant indicators were used to evaluate agro-environmental risk in major grain producing areas of China. An overall evaluation can be effectively used to study agro-environments, which must be explored in the future.
In terms of data quality, previous studies show that effective utilization efficiencies of nitrogen fertilizers in wheat-corn systems are generally less than 49% (Duan, Xu, and Gao Citation2014), corroborating the parameters used in this study. It is worth noting that the low effective utility of chemical fertilizers is a major problem in rice production due to related flooding conditions (Sun, Hu, and Zhang Citation2019). Hence, the nitrogen and phosphorus loads of paddy-based planting systems of the Dongting Lake Region may exceed the levels evaluated in this paper. Furthermore, the general effective utilization rate of pesticides in China is less than 38.8%. A field test conducted in Iran showed that 77–85% of pesticides are removed by rainfall in the summer and fall (Firouzsalari, Shakerkhatibi, and Pourakbar Citation2019). For sprayed pesticides, previous research shows that more than 98% can reach untargeted locations (Hong, Zhao, and Zhao Citation2018), meaning that pesticide surpluses may exceed the levels evaluated in this study. Similarly, NOX emissions can range from 7.1 to 10.2 g/kWh (Lovarelli, Fiala, and Larsson Citation2018), CO emissions can range from 10.94 to 33.64 kg/t and PM2.5 discharge levels can vary from 1.65 to 4.79 kg/t when using agro-machinery (Lu, Huang, and Hu Citation2017). Thus, based on parameters of pollutant discharge used in the latest related field research, the results of the present study are generally reliable. Methods and conclusions presented in this work can thus be extrapolated to other grain producing areas, and new studies should discuss the environmental risks of different cases.
In addition, environmental risk uncertainties result from differences between developed and underdeveloped cities. For instance, Qingdao and Jinan are typical developed cities in Shandong Province that face fewer environmental risks and showing greater reductions in environmental risk indexes than other cities. Similarly, Changsha, Zhuzhou, and Xiangtan are located in the developed city cluster of the Dongting Lake Region with lower pollutant discharge levels and showing smaller increases in comprehensive environmental risk than other cities in this region. This highlights the importance of balancing local socioeconomic conditions and corresponding arable land use patterns in different cities. While rapid urbanization and non-agricultural construction in developed cities may reduce arable land use intensity and agro-environmental risks, agricultural production is merely transferred to surrounding underdeveloped cities. As a result, underdeveloped cities in major grain producing areas may present uncertainties with unknown environmental consequences, requiring the stricter control of chemical production material use and more support for technological instruments to develop these cities into sustainable intensive arable land use districts.
Conclusion
Via fault tree analysis and parametric estimation, this study assessed and mapped environmental risks resulting from intensive arable land use in two typical national grain producing areas of China. For the period of 2007–2018, the results evaluate five environmental risks resulting from intensive arable land use, including eutrophication, toxic pollution, soil structure damage, greenhouse gas effects, and air pollution, among which greenhouse gases have generated the highest emissions per unit area of arable land. Second, while annual discharges of most pollutants in the Dongting Lake Region were lower than those in Shandong Province, environmental risks per unit area of arable land in Dongting Lake Region exceeded those of Shandong Province. Third, the discharge of pollutants in cities of the Dongting Lake Region showed a north-concentrated pattern, whereas cities of Shandong Province showed a scattered distribution of pollutant emissions. Based on comprehensive environmental risk indexes for 2007–2018, cities with high levels of environmental risk in the Dongting Lake Region did not change (Yueyang, Changde, and Yiyang); however, in Shandong Province, Zaozhuang, Heze, Liaocheng, and Dezhou showed the highest levels of environmental risk from 2007 to 2008, while in 2018, Rizhao showed the highest levels of environmental risk.
To control environmental risks related intensive arable land use, policies may be developed according to the following recommendations. First, government agencies should use agricultural production zoning approaches based on environmental risks of intensive arable land use. Rather than blindly pursuing food production, balancing arable land use intensity with its environmental effects should be prioritized. Second, farmers should be given guidance on how much production materials to apply to maintain a moderately intensive arable land use pattern. Finally, underdeveloped cities should be given higher priority in terms of controlling environmental risks due to their more intensive agricultural production tasks relative to those of developed cities.
Acknowledgments
This research was supported by the National Natural Science Foundation of China (Project No. 41701590), the Shandong Provincial Natural Science Foundation of China (Project No. ZR2017BD004), the Humanities and Social Science Fund of Ministry of Education of China (Project No. 17YJCZH228), and a project funded by the China Postdoctoral Science Foundation (Project No. 2017M612340). Support from the China Scholarship Council to complete 6 months of visit at North Dakota State University in the United States is gratefully acknowledged. Thanks Professor Zhulu Lin of North Dakota State University for his helpful advice on this study.
Supplementary material
Supplemental data for this article can be accessed here.
Additional information
Funding
Notes
1 Partial factor productivity (PFP) refers to crop yields produced by inputs of fertilizer. PFP = Y/F where Y refers to crop yields and F refers to fertilizer application rates.
References
- Abadi, B. 2018. “The Determinants of Cucumber Farmers’ Pesticide Use Behavior in Central Iran: Implications for the Pesticide Use Management.” Journal of Cleaner Production 205: 1069–16. doi:10.1016/j.jclepro.2018.09.147.
- Bandopadhyay, S., L. Martin-Closas, and A. M. Pelacho. 2018. “Biodegradable Plastic Mulch Films: Impacts on Soil Microbial Communities and Ecosystem Functions.” Frontiers in Microbiology 9: 819. doi:10.3389/fmicb.2018.00819.
- Beghin, J., B. Meade, and S. Rosen. 2017. “A Food Demand Framework for International Food Security Assessment.” Journal of Policy Modeling 39 (5): 827–842. doi:10.1016/j.jpolmod.2017.06.001.
- Bhandari, G., P. Zomer, and K. Atreya. 2019. “Pesticide Residues in Nepalese Vegetables and Potential Health Risks.” Environmental Research 172: 511–521. doi:10.1016/j.envres.2019.03.002.
- Brodhagen, M., J. R. Goldberger, and D. G. Hayes. 2017. “Policy Considerations for Limiting Unintended Residual Plastic in Agricultural Soils.” Environmental Science & Policy 69: 81–84. doi:10.1016/j.envsci.2016.12.014.
- Center for Chemical Process Safety. 1999. Guidelines for Chemical Process Quantitative Risk Analysis 2nd, 1–5. New York: American Institute of Chemical Engineers.
- Center for Chemical Process Safety. 2008. Guidelines for Hazard Evaluation Procedures, 1–10. New York: Wiley.
- Chen, X., Z. Cui, and M. Fan. 2014. “Producing More Grain with Lower Environmental Costs.” Nature 7523 (514): 486–489. doi:10.1038/nature13609.
- China State Council. 2014. National New Urbanization Plan (2014–2020), 1–10. Beijing: China State Council.
- China’s Bureau of Statistics. 2018. “China Rural Statistical Yearbook.” 1–200.
- Convention on Biological Diversity, UN. 2019. “What Is Impact Assessment?” Convention on Biological Diversity https://www.cbd.int/impact/
- Development planning division. 2013. “Main Functional Area Planning of Shandong Province.” 1–10. http://ghs.ndrc.gov.cn/ghwb/ztgngh/201304/P020130402348634888430.pdf
- Dimitrov, D. D., and J. Wang. 2019. “Geographic Inventory Framework for Estimating Spatial Pattern of Methane and Nitrous Oxide Emissions from Agriculture in Alberta, Canada.” Environmental Development 32: 100461. doi:10.1016/j.envdev.2019.100461.
- Duan, Y., M. Xu, and S. Gao. 2014. “Nitrogen Use Efficiency in a Wheat–corn Cropping System from 15 Years of Manure and Fertilizer Applications.” Field Crops Research 157: 47–56. doi:10.1016/j.fcr.2013.12.012.
- Fabiani, S., S. Vanino, and R. Napoli. 2020. “Water Energy Food Nexus Approach for Sustainability Assessment at Farm Level: An Experience from an Intensive Agricultural Area in Central Italy.” Environmental Science & Policy 104: 1–12. doi:10.1016/j.envsci.2019.10.008.
- Firouzsalari, N. Z., M. Shakerkhatibi, and M. Pourakbar. 2019. “Pyrethroid Pesticide Residues in a Municipal Wastewater Treatment Plant: Occurrence, Removal Efficiency, and Risk Assessment Using a Modified Index.” Journal of Water Process Engineering 29: 1–7. doi:10.1016/j.jwpe.2019.100793.
- Girardin, P., C. Bockstaller, and H. Van der Werf. 2000. “Assessment of Potential Impacts of Agricultural Practices on the Environment: The AGRO*ECO Method.” Environmental Impact Assessment Review 2 (20): 227–239. doi:10.1016/S0195-9255(99)00036-0.
- Guo, H., H. Yao, and L. Yang. 2010. “Studies on Agricultural Function Zoning of Shandong Province.” Chinese Journal of Agricultural Resources and Regional Planning 2 (31): 81–86.
- Hong, S., L. Zhao, and L. Zhao. 2018. “SAAS, a Computer Program for Estimating Pesticide Spray Efficiency and Drif of Air-assisted Pesticide Applications.” Computers and Electronics in Agriculture 155: 58–68. doi:10.1016/j.compag.2018.09.031.
- Hui, M. A., M. E. I. Xu-rong, and Y. A. N. Chang-rong. 2008. “The Residue of Mulching Plastic Film of Cotton Field in North China.” Journal of Agro-Environment Science 20:570-537.
- Hunan Provincial Bureau Of Statistics. 2019. Hunan Statistical Yearbook. Changsha: China Statistics Press.
- Jiang, X. J., W. Liu, and E. Wang. 2017. “Residual Plastic Mulch Fragments Effects on Soil Physical Properties and Water Flow Behavior in the Minqin Oasis, Northwestern China.” Soil & Tillage Research X 166: 100–107. doi:10.1016/j.still.2016.10.011.
- Kuang B., Lu X. H., Han J., et al. 2020. “How Urbanization Influence Urban Land Consumption Intensity: Evidence from China” Habitat International 100:102103. doi:10.1016/j.habitatint.2019.102103
- Kulak, M., A. Graves, and J. Chatterton. 2013. “Reducing Greenhouse Gas Emissions with Urban Agriculture: A Life Cycle Assessment Perspective.” Landscape and Urban Planning 111: 68–78. doi:10.1016/j.landurbplan.2012.11.007.
- Li, Y., C. Tang, and Z. Huang. 2020. “Increase in Farm Size Significantly Accelerated Stream Channel Erosion and Associated Nutrient Losses from an Intensive Agricultural Watershed.” Agriculture, Ecosystems & Environment 295: 106900. doi:10.1016/j.agee.2020.106900.
- Lian, B., and S. Wang. 2011. “Regional Division of Hainan Agricultural Function.” Chinese Journal of Agricultural Resources and Regional Planning 3 (32): 75–80.
- Liao, W., H. Deng, and R. Li. 2018. “Spatial Patterns of Ecosystem Hydrological Regulation Services and Factors Affecting Them in the Yangtze River Basin: Sub-watershed Scale Analysis.” Acta Ecological Sinica 2 (38): 412–420. doi:10.5846/stxb201701080065.
- Liu, J., J. Ning, and W. Kuang. 2018. “Spatio-temporal Patterns and Characteristics of Land-use Change in China during 2010–2015.” Acta Geographica Sinica 5 (73): 789–802. doi:10.11821/dlxb201805001.
- Liu, J., W. Kuang, and Z. Zhang. 2014. “Spatiotemporal Characteristics, Patterns, and Causes of Land-use Changes in China since the Late 1980s.” Journal of Geographical Sciences 2 (24): 195–210. doi:10.1007/s11442-014-1082-6.
- Liu, J., W. Rong, and H. Lu. 2006. “Studies on Regional Planning of Agricultural Function in Beijing.” Chinese Journal of Agricultural Resources and Regional Planning 5 (27): 49–54.
- Lovarelli, D., M. Fiala, and G. Larsson. 2018. “Fuel Consumption and Exhaust Emissions during On-field Tractor Activity: A Possible Improving Strategy for the Environmental Load of Agricultural Mechanisation.” Computers and Electronics in Agriculture 151: 238–248. doi:10.1016/j.compag.2018.06.018.
- Lu, J., C. Huang, and Q. Hu. 2017. “Air Pollutant Emission Inventory of Non-road Machineries in Typical Cities in Eastern China.” Environmental Science 38 (7): 2738–2746. doi:10.13227/j.hjkx.201612185.
- Lwanga, E. H., B. Thapa, and X. Yang. 2018. “Decay of Low-density Polyethylene by Bacteria Extracted from Earthworm’s Guts: A Potential for Soil Restoration.” Science of the Total Environment 624: 753–757. doi:10.1016/j.scitotenv.2017.12.144.
- Malaj, E., K. Liber, and C. A. Morrissey. 2020. “Spatial Distribution of Agricultural Pesticide Use and Predicted Wetland Exposure in the Canadian Prairie Pothole Region.” Science of the Total Environment 718: 134765. doi:10.1016/j.scitotenv.2019.134765.
- Margoum, C., S. Morin, and N. Mazzella. 2015. “Potential Toxicity of Pesticides in Freshwater Environments: Passive Sampling, Exposure and Impacts on Biofilms: The PoToMAC Project.” Environmental Science and Pollution Research 6 (22): 3985–3987. doi:10.1007/s11356-014-3291-z.
- McGrath, G., P. S. C. Rao, and P. Mellander. 2019. “Real-time Forecasting of Pesticide Concentrations in Soil.” Science of the Total Environment 663: 709–717. doi:10.1016/j.scitotenv.2019.01.401.
- Mehmood, K., S. Chang, and S. Yu. 2018. “Spatial and Temporal Distributions of Air Pollutant Emissions from Open Crop Straw and Biomass Burnings in China from 2002 to 2016.” Environmental Chemistry Letters 1 (16): 301–309. doi:10.1007/s10311-017-0675-6.
- Ministry of Ecology and Environment of the People’s Republic of China. 2018. “China Vehicle Environmental Management Annual Report.” http://dqhj.mee.gov.cn/jdchjgl/zhgldt/201806/P020180604354753261746.pdf
- Ministry of Land Resources of PRC. 2016. “National Land Resources Bulletin.” 1–10.
- Muhammed, S. E., K. Coleman, and L. Wu. 2018. “Impact of Two Centuries of Intensive Agriculture on Soil Carbon, Nitrogen and Phosphorus Cycling in the UK.” Science of the Total Environment 634: 1486–1504. doi:10.1016/j.scitotenv.2018.03.378.
- Odegard, I. Y. R., and E. V. D. Voet. 2014. “The Future of Food—Scenarios and the Effect on Natural Resource Use in Agriculture in 2050.” Ecological Economics 97: 51–59. doi:10.1016/j.ecolecon.2013.10.005.
- Pan, G., X. Xu, and P. Smith. 2010. “An Increase in Topsoil SOC Stock of China’s Croplands between 1985 and 2006 Revealed by Soil Monitoring.” Agriculture, Ecosystems & Environment 1–2 (136): 133–138. doi:10.1016/j.agee.2009.12.011.
- Pereira, L. C., A. O. D. Souza, and M. F. F. Bernardes. 2015. “A Perspective on the Potential Risks of Emerging Contaminants to Human and Environmental Health.” Environmental Science and Pollution Research 18 (22): 13800–13823. doi:10.1007/s11356-015-4896-6.
- Power, A. G. 2010. “Ecosystem Services and Agriculture: Tradeoffs and Synergies.” Philosophical Transactions of the Royal Society B: Biological Sciences 1554 (365): 2959–2971. doi:10.1098/rstb.2010.0143.
- Qi, Y., X. Yang, and A. M. Pelaez. 2018. “Macro- and Micro- Plastics in Soil-plant System: Effects of Plastic Mulch Film Residues on Wheat (Triticum Aestivum) Growth.” Science of the Total Environment 645: 1048–1056. doi:10.1016/j.scitotenv.2018.07.229.
- Rahman, K. A., and D. Zhang. 2018a. “Effects of Fertilizer Broadcasting on the Excessive Use of Inorganic Fertilizers and Environmental Sustainability.” Sustainability 10: 759–769. doi:10.3390/su10030759.
- Severo Santos, J. F., and L. P. Naval. 2020. “Spatial and Temporal Dynamics of Water Footprint for Soybean Production in Areas of Recent Agricultural Expansion of the Brazilian Savannah (Cerrado).” Journal of Cleaner Production 251: 119482. doi:10.1016/j.jclepro.2019.119482.
- Shandong Provincial Bureau Of Statistics. 2019. Shandong Statistical Yearbook. Jinan: China Statistics Press.
- Shen, J., Z. Cui, and Y. Miao. 2013. “Transforming Agriculture in China: From Solely High Yield to Both High Yield and High Resource Use Efficiency.” Global Food Security 1 (2): 1–8. doi:10.1016/j.gfs.2012.12.004.
- Shi, Z. 2017. “Pesticide Pollution in China.” Centria University of Applied Sciences 1–28. https://www.theseus.fi/bitstream/handle/10024/139893/Zhenning_Shi.pdf?sequence=1&isAllowed=y
- Silva, V., H. G. J. Mol, and P. Zomer. 2019. “Pesticide Residues in European Agricultural Soils – A Hidden Reality Unfolded.” Science of the Total Environment 653: 1532–1545. doi:10.1016/j.scitotenv.2018.10.441.
- Skalicky, V., and I. Čerpes. 2019. “Comprehensive Assessment Methodology for Liveable Residential Environment.” Cities 94: 44–54. doi:10.1016/j.cities.2019.05.020.
- Smith, P., D. Martino, and Z. Cai. 2008. “Greenhouse Gas Mitigation in Agriculture.” Philosophical Transactions Biological Sciences 1492 (363): 789–813. doi:10.1098/rstb.2007.2184.
- State Statistics Bureau of China. 2018. “China Statistical Yearbook.” 12200.
- Sun, Y., R. Hu, and C. Zhang. 2019. “Does the Adoption of Complex Fertilizers Contribute to Fertilizer Overuse? Evidence from Rice Production in China.” Journal of Cleaner Production 219: 677–685. doi:10.1016/j.jclepro.2019.02.118.
- The State Council of China. 2011. “The Notice on the Plan for National Development Priority Zones Issued by the State Council.” 1–30. http://www.gov.cn/zwgk/2011-06/08/content_1879180.htm
- Tilman, D., C. Balzer, and J. Hill. 2011. “Global Food Demand and the Sustainable Intensification of Agriculture.” Proceedings of the National Academy of Sciences 50 (108): 20260–20264. doi:10.1073/pnas.1116437108.
- Wikipedia. 2018. “Fault Tree Analysis.” 1.
- Yang, S. S., H. Y. Ngiam, and S. K. Ong. 2015. “The Impact of Automotive Product Remanufacturing on Environmental Performance.” Procedia CIRP 29: 774–779. doi:10.1016/j.procir.2015.01.017.
- Yin, G., L. Liu, and X. Jiang. 2017. “The Sustainable Arable Land Use Pattern under the Tradeoff of Agricultural Production, Economic Development, and Ecological Protection—an Analysis of Dongting Lake Basin, China.” Environmental Science and Pollution Research 32 (24): 25329–25345. doi:10.1007/s11356-017-0132-x.
- Yin, G., Z. Lin, and X. Jiang. 2019. “Spatiotemporal Differentiations of Arable Land Use Intensity—A Comparative Study of Two Typical Grain Producing Regions in Northern and Southern China.” Journal of Cleaner Production 208: 1159–1170. doi:10.1016/j.jclepro.2018.10.143.
- Zhang, D., and H. Liu. 2016. “The Status and Distribution Characteristics of Residual Mulching Film in Xinjiang, China.” Journal of Integrative Agriculture 11 (15): 2639–2646. doi:10.1016/s2095-3119(15)61240-0.