
 ?Mathematical formulae have been encoded as MathML and are displayed in this HTML version using MathJax in order to improve their display. Uncheck the box to turn MathJax off. This feature requires Javascript. Click on a formula to zoom.
ABSTRACT
Introduction
The development of coal power base (CPB) poses a severe challenge to the soil. We conducted a soil survey in Xilinhot CPB, to evaluate and analyze the pollution characteristics, potential ecological risk, and sources of six heavy metals (As, Pb, Cu, Zn, Mn, and Cd) in soil by using Geo-accumulation index, revised Nemerow integrated pollution index (RNIPI), and potential ecological risk index (RI).Outcomes/other: The results showed that the pollution of Cd and As were dramatic. The mean of Cd and As were 1.11 mg·kg-1 and 25.13 mg·kg-1, which were 42.55 times and 4.41 times higher than its local background value. The Geo-accumulation indices showed the contamination degree of Cd was strong and As was moderate, and the status of Cu, Pb, Zn, and Mn were uncontaminated. Xilinhot was strongly contaminated based on its RNIPI and RI values.Discussion: The accumulations of As, Pb, and Cd were mainly associated with anthropogenic sources, including coal mining and combustion, and industrial exhaust emissions. Cu, Mn, and Zn were primarily originated from the parent material (natural sources).Conclusion: This study provides scientific basis and effective countermeasures for the prevention and control of soil pollution in surrounding areas of CPB.
Introduction
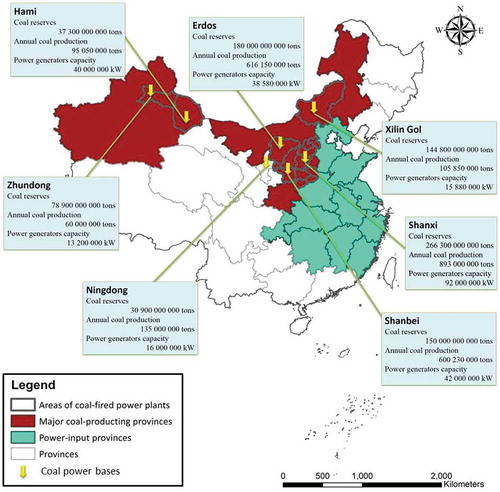
The industry chain of coal is one of the fundamental bases of economy in China, and has played an important strategic role in the rapid development in the last two decades. A coal power base (CPB) refers to a group of coal mines and coal-fired power plants according to the reserve and output of coal in an industrial region for the purpose of power generation and outward transmission (Huang Citation2012). Since 2005, the state has developed seven national large-scale CPBs () in order to achieve the ultimate goal of national energy sustainability, which also tremendously promoted regional economy and energy efficiency (Wang Citation2013).
Figure 1. The location of the seven national large-scale CPBs.
A series of ecological problems have been brought out during the development of CPBs. A large amount of wastewater, gangues, and other waste residues discharged in the production processes of coal mining, as well as the waste emissions and dust discharged in the processes of coal-fired power generation can eventually lead to the accumulation of heavy metals in the soil (Bo et al. Citation2019; Shao et al. Citation2019). Easy to accumulate and conceal, high toxicity and persistence, and non-degradability are the characteristics of heavy metal pollutants (Chen et al. Citation2016b). Past studies have revealed that heavy metals recycled through the ecological system may be transferred into human bodies and accumulated in organisms by ways of ingestion, inhalation, dermal contact, or through the food chain (Wu et al. Citation2014; Fan Citation2015). The continuous accumulation of heavy metals in soil caused by industrial activities in last two decades has posed a serious threat to human health in China (Wang Citation2014; Huang et al. Citation2018).
Heavy metal pollution caused by mining activities has been highly concerned in China, and most of the previous studies are focused on soil (Yang et al. Citation2016; Zhang et al. Citation2016; Guo et al. Citation2018), waste tailings (Wu et al. Citation2014; Yue et al. Citation2017), gangue piles (Yang, Chen, and Wang Citation2008; Jiang et al. Citation2014), wasteland reclamation (Yao, Meng, and Zhang Citation2010; Wu et al. Citation2018), farmland pollution (Chen et al. Citation2016a; Wang, Peng, and Chen Citation2016), and urban pollution (Gu and Gao Citation2017). A number of studies have also confirmed that atmospheric deposition from industrial emissions is regarded as one of the major sources of heavy metal contamination in urbanized areas (Du et al. Citation2010; Bo et al. Citation2019). CPBs were developed so fast in the last 15 years in China that the research on heavy metal pollution brought by CPB development lagged behind. Therefore, more studies are needed to elucidate the environmental impacts associated with the rapid development of CPBs in order to understand the ecological impacts, analyze the main problems, and provide scientific suggestions to the government.
Under this background, a typical CPB in Xilinhot of Inner Mongolia, northern China, was selected as the research object. The objectives of this study were to (1) assess the concentrations of heavy metals in soil around the CPB, (2) evaluate the degree of pollution and potential ecological risk, (3) identify the sources of heavy metals by multivariate analysis, and (4) provide scientific suggestions for the future management of CPBs.
Materials and methods
Study area
Figure 2. The location and distribution of Xilin Gol CPB.
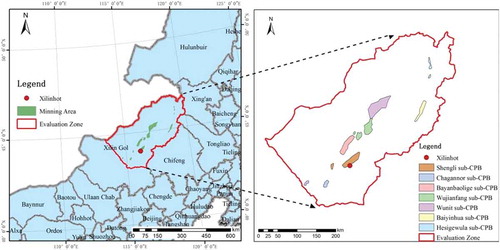
Xilin Gol League (43°02′~44°52′N, 115°13′~117°06′E) is located in the middle of Inner Mongolia Autonomous Region in northern China (). With 144.8 billion tons of coal reserves, Xilin Gol possesses the richest lignite coal resources in China. The CPB of Xilin Gol is one of the seven national large-scale CPBs with the main purpose of outward power transmission. In 2018, the coal production of Xilin Gol CPB was 105.85 million tons, and the power generation capacity was 31.67 billion kWh. Xilin Gol CPB is consisted of seven sub-CPBs that include many coal mines and power plants (). Among these sub-CPBs, Xilinhot (Shengli) sub-CPB was developed at the earliest stage since it is close to Xilinhot City, and eventually it led an accumulative environmental impact to the city. In this paper, a major coal mine and a typical power plant of Xilinhot sub-CPB are selected as the research objects: The Shengli open pit mine is located in the northwest of Xilinhot, about 5 km away from the west boundary of the city. Shengli open pit mine started operation in 2004 and its current coal production capacity is approximately 20 million tons of lignite per year. The Xilin thermal power plant is located in the western suburb of Xilinhot. It ran into production in 2007 with the annual power generation capacity of over 3 billion kWh and heating capacity of over 300 GJ.
The city of Xilinhot (43°02′~44°52′N, 115°18′~117°06′E) is the capital of Xilin Gol League, surrounded with Xilin Gol typical steppe. The climate of this area is temperate semi-arid continental with cold and dry winters, and warm and humid summers. The yearly average temperature is 0 ~ 3°C and the annual average total precipitation is 295 mm (Tong, Liu, and Wu Citation2016). The soil is alkaline and mainly composed of eolian sandy soil, chestnut soil, and chernozem. The nutrient level of the soil is low in phosphorus, moderate in nitrogen and potassium, and has sufficient organic matter (Gu, Zhang, and Bai Citation1995).
Sampling, detection, and analysis methods
Figure 3. The locations of sampling sites in Xilinhot CPB.
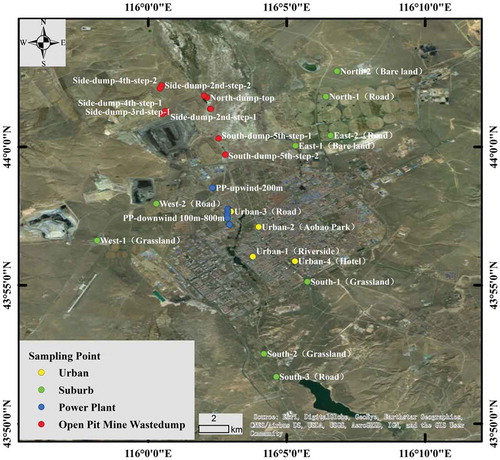
The study area was divided into four sub-areas: Open pit mine waste dump (12 samples), Suburb (9 samples), Urban (4 samples), and Power plant (9 samples). A total of 34 samples of surface soil (0–20 cm) were collected ( and S1 for sampling distribution).
Each of the soil samples was consisted of 5 sub-samples collected by five-point sampling method in a 5 m × 5 m grid from the sampling point (Zeng et al. Citation2015). During sampling, every sub-sample was collected with 5 times drilling, mixed evenly and put into a plastic bag. All analyses were completed in the Experimental Center of Chinese Academy of Sciences, a research institute that passed the national metrology authentication of China. The soil samples were air-dried naturally and passed through a 0.075 mm sieve, prepared to be analyzed. The content of heavy metal elements As, Pb, Cu, Zn, Mn, and Cd were determined by using inductively coupled plasma mass spectrometry (ICP-MS, Aglient 7500a, USA), and the pH value was determined by using SJ-4A pH meter (Kim et al. Citation2012). The recovery rates for heavy metals were between 96.3% and 105%. The detection limits for As, Pb, Cu, Zn, Mn, and Cd were 0.6, 2, 1, 2, 10, and 0.01 mg/kg, respectively.
Descriptive statistics, including the range, median, mean, standard deviation (SD), and coefficient of variation (CV) were computed in Excel. SPSS 20.0 was used for performing factor analysis (FA), Pearson correlation analysis, and cluster analysis (CA). K-S test showed that all heavy metal elements conformed to normal distribution (Sig. > 0.05).
Methods of heavy metal pollution assessment
Geo-accumulation Index () was proposed to assess the pollution levels of sediments by Muller (Citation1969), which has been applied to assess the contamination levels of heavy metals in many fields by researchers (Hoaghia et al. Citation2017).
is computed as follows:
where Ci is the content of heavy metal i in soil, is the background value, K is the factor compensating the background content due to lithogenic effects that is normally 1.5.
The is normally classified into five grades, as shown in . The background concentrations of heavy metals in soil of Xilin Gol League (Gu, Zhang, and Bai Citation1995) were used for
analysis in this study.
Table 1. The classification of contamination levels based on Geo-accumulation index ().
Because the Geo-accumulation index can only assess the contamination degree of individual heavy metals, a revised Nemerow integrated pollution index (RNIPI) proposed by Liu et al. (Citation2009) was applied to evaluate the comprehensive degree of multiple heavy metal contaminations at each sampling site. The RNIPI is defined as follows:
where is the average
value of each sampling site, and
is the maximum
value of each sampling site.
The RNIPI is classified into eight levels ().
Table 2. The classes of revised Nemerow integrated pollution index (RNIPI).
The potential ecological risk index (RI) method was proposed by Hakanson (Citation1980) based on sedimentology to assess the levels of heavy metal contaminations in soil and water sediments. The advantage of RI is that it not only indicates where contamination studies should be prioritized but also considers the toxicity to organisms caused by different heavy metals (Douay et al. Citation2013). The RI is defined as follows:
where is the contamination factor,
is the content of heavy metal i in soil, and
is the background concentration of heavy metal in soil of Xilin Gol League.
is the toxic response factor, representing the potential hazard of the heavy metal and the environmental sensitivity to its contamination, and is determined for TCd = 30 > TAs = 10 > TCu = TPb = 5 > TZn = TMn = 1 (Hakanson Citation1980).
is the potential ecological risk factor of monomial heavy metal, and RI is the potential ecological risk index of integrated six heavy metals.
The revised classification of and RI are classified into five and four levels, respectively ().
Table 3. The classifications of potential ecological risk factor () and potential ecological risk index (RI).
The coefficient of variation (CV) has been used to reflect the degree of variation of heavy metal concentrations between different sites (Zhou et al. Citation2015b). Factor analysis (FA) has been used to measure the degree of correlation between heavy metal sources and pathways (Maanan et al. Citation2015; Pejman et al. Citation2015). We used KMO and Bartlett tests to examine the suitability of data for FA, and then performed FA for the six heavy metal elements and pH value (totally 7 variables) to identify the factors affecting each variable. Pearson’s correlation analysis and cluster analysis (CA) were conducted to further examine the relationships between variables (six heavy metals and pH) (Chen et al. Citation2019).
Results and discussion
Characteristics of heavy metal concentrations in the soils
Among the six heavy metals, there were prominent accumulations of Cd, As, and Cu in the soil compared with the background value of Xilin Gol League (Gu, Zhang, and Bai Citation1995) (). Cd of all samples exceeded the background value significantly, and the mean of Cd was 1.11 mg·kg−1, which was 42.55 times higher than the Xilin Gol background value of 0.026 mg·kg−1. Arsenic was higher than the background value in 97.06% of the samples, and its mean was 25.13 mg·kg−1, which was 4.41 times higher than the background value of 5.70 mg·kg−1. The maximum values of Cd and As both appeared at S33 – downwind 700 m of power plant that were 2.20 mg·kg−1 and 47 mg·kg−1, which were 84.62 and 8.25 times higher than the background values, respectively. Furthermore, 76.47% of Cu samples exceeded the background value, with its mean of 12.42 mg·kg−1, slightly higher than the background value of 10.18 mg·kg−1. On the other hand, the means of Mn, Zn, and Pb were lower than the background values, with a relatively small portion of Mn and Zn samples exceeded the background values and none of Pb samples exceeded its background value. This indicated that there was no prominent accumulation of Pb, Mn, and Zn in the soil. Moreover, the contents of heavy metal elements did not exceed the risk screening values of the latest national standard in all the samples. This meant that the heavy metals in the study area had not posed a direct harm to the human body yet.
Table 4. The statistical analysis of heavy metals in soil samples.
Based on the classifications of coefficient of variation (CV) by Wilding (Citation1985), Mn (24.9%), Cu (30.1%), and Zn (33.4%) were at medium variation (15% < CV < 36%). Pb (51%), As (45.8%), and Cd (41.6%) were at high variation (CV > 36%). It indicated that the accumulations of Pb, As, and Cd were strongly related to human activities in this area.
Heavy metal pollution assessment
The degrees of pollution of the six heavy metals based on were ranked as Cd > As > Cu > Mn > Zn > Pb (). Among the six heavy metal elements, Cd possessed the highest degree 4.65 – strongly contaminated and the degree of As was 1.38 – moderately contaminated. Cu, Pb, Zn, and Mn were generally in safe status – uncontaminated. Nevertheless, it was worth noting that 11.76% samples of Cu were slightly contaminated, which shall also be concerned in the future operation and management.
Table 5. Geo-accumulation index values and potential ecological risk factor values of the six heavy metals.
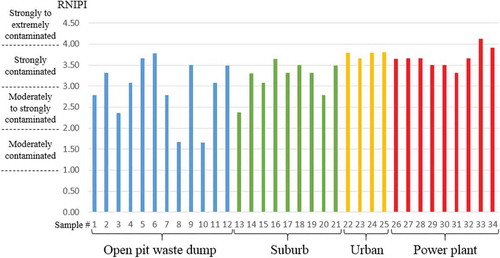
According to the results of RNIPI ( and ), the mean RNIPI of the entire study site was 3.30 – strongly contaminated. Among the four sub areas, the mean RNIPI of Urban was the highest 3.76, followed by Power plant (3.67) and Suburb (3.20). The pollution levels of the three areas above were strongly contaminated. Moreover, the pollution level of Open pit mine waste dump (2.93) was relatively lower – moderately to strongly contaminated. The maximum value of RNIPI among all sample points appeared at S33 – downwind 700 m of power plant, which was 4.13 – strongly to extremely contaminated, indicating that the concentration of heavy metal pollution of this point was most prominent.
Table 6. Characteristics of spatial distribution and potential ecological risk of heavy metals.
Based on potential ecological risk factors , Cd had the highest value (1276.43), which was extremely high risk, followed by As (44.09) at moderate risk; the other four heavy metals Pb, Cu, Zn, and Mn were at slight risk (). This suggested that Cd and As were the heavy metals with high potential ecological risk and need to be highly concerned in the study site.
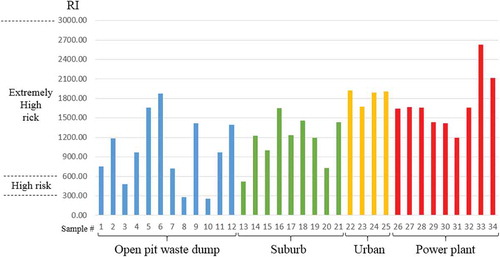
Figure 4. RNIPI values of all the 34 samples.
The overall potential ecological risk of the study site was 1329.9, which was at extremely high risk. According to the analysis of regional distribution ( and ), all of the four sub areas were at extremely high risk. To be specific, Urban had the highest RI of 1847.5, followed by Power plant (1712.7); the RI of Suburb (1160.1) and Open pit waste dump (997.6) were relatively lower. The highest risk value in all samples was 2628.4 at S33 – downwind 700 m of power plant, indicating that the potential ecological risk caused by the atmospheric deposition of emissions from the power plant was extremely high.
Figure 5. RI values of all the 34 samples.
The heavy metal contaminations in soil around coal mines were widespread in the world. Tavakoli, Hojjati, and Kooch (Citation2019) found that Cd presented moderate pollution in the forest soil around coal mine in north Iran according to its Nemerow integrated pollution index (NIPI). Furthermore, based on the statistical analysis of soil contaminations around coal mines in 39 cities of 14 countries, Sahoo, Equeenuddin, and Powell (Citation2016) concluded that Cd and As were the second and third most severe heavy metals in potential ecological risk among the nine trace elements. Based on the RI values, soil from Xuzhou (China), Tibagi River (Brazil), Smolnica coal mines (Poland), and Oltu (Turkey) showed a very high risk of contamination, due to the high concentrations of Cd and As.
Analysis of heavy metal pollution sources
The result of KMO was 0.75 and the significance level of Bartlett was 0 (less than 0.05), which indicated compatibility of data for FA. Two factors with eigenvalues greater than 1 were extracted that explained 66.33% of the total variance ().
Table 7. The results of factor analysis after rotation for the maximum variance.
Factor 1 accounted for 46.22% of the total variance and had strong positive loadings on Mn, Cu, Zn, and pH. The biggest loading element of Factor 1 was Mn (0.865). Mn is generally considered to be mainly derived from the parent soil (Liu et al. Citation2016; Yang et al. Citation2016). Besides, there was no obvious enrichment phenomenon of this group of heavy metals compared with the background value of Xilin Gol League. Therefore, factor 1 could be inferred as “natural factor.”
Factor 2 included Cd, Pb, and As, which accounted for 20.11% of the total variance. Cd accounted for the largest load, 0.943. In the study of urban soil pollution, fossil fuel combustion and automobile transportation are considered as main sources of Cd (Li et al. Citation2015; Chen et al. Citation2019). On the other hand, As often exists in sulfide ores and can be identified as a representative element for metal smelting and coal combustion (Guo et al. Citation2012; Islam et al. Citation2015). Xilinhot is a typical “energy-based” city, meaning that its economy largely depends on energy industry. With the aggressive development and construction of CPBs in Xilinhot, the volume of coal consumption and automobile vehicles has increased year by year. In addition, the winter of Xilinhot is dramatically cold and long as the heating season lasts seven months from October 1st to April 30th of the second year, causing a giant volume of coal consumption that resulted in the accumulation of Cd and As in soil. From this point of view, factor 2 could be interpreted as “anthropogenic factor.”
Based on Pearson’s correlation analysis, a positive correlation was observed between As and Pb, while Mn, Cu, and pH were also positively correlated at the 99% confidence level (). Moreover, Pb and Cd, as well as Zn and Mn were positively correlated at the 96% confidence level.
Figure 6. Cluster analysis of six heavy metals and pH.
Table 8. Pearson’s correlation analysis of six heavy metals and pH.
CA identified two main groups of spatial similarities: one formed by anthropogenic sources and another of natural origin (). Cluster 1 contained As, Pb, and Cd, which were primarily derived from anthropogenic sources, including coal mining and combustion, industrial waste discharge, and transportation. Cluster 2 included Cu, Mn, Zn, and pH, which could mostly be originated from the natural source that was the parent soil.
The severe enrichment of As and Cd in soil of Xilinhot was derived primarily from anthropogenic sources. This finding was in accordance with previous studies (Yang et al. Citation2016; Yue et al. Citation2017). Based on the review of 112 studies on soil heavy metal pollution in most areas of China in last two decades, Chen et al. (Citation2019) found that industrial pollution, traffic emissions, and atmospheric deposition were the main sources of heavy metals accumulation in urban soil of northern China, and the enrichment of As and Cd were mainly affected by industrial activities such as coal combustion and metal smelting, which was also consistent with the analysis in this study that the aggressive development of CPBs had an obvious impact on the heavy metal accumulation in soil of Xilinhot.
Regional pollution analysis and countermeasures
Figure 7. The release mechanism of heavy metals in the production process of CPB.
The release of heavy metal elements in the production process of CPB includes coal mining and processing, coal transportation, and coal-fired power generation (). The environment could be polluted by heavy metal pollutants from the dust, drainage water, mine water produced in the process of coal mining and processing; the dust and acid water produced by the weathering and leaching of coal gangues; the dust produced in the process of coal handling and transportation; the ash flushing water and industrial waste gas discharged during the coal-fired power generation process by power plants.
Based on the pollution assessment and source analysis in this study, the sub area Power plant has notably severe pollution degree, and anthropogenic activities are the main reason for the accumulation of As and Cd. It can be inferred that the emissions discharged from the power plant could be a major source of heavy metal pollution in the urban soil. Heavy metals pollutants from the emissions enter the atmosphere, migrate and diffuse with the help of wind force, accumulate in the soil and water through dry and wet deposition, and eventually enter into the food chain and harm human health (Miclean et al. Citation2018; Yang et al. Citation2020).
The total amount of heavy metals released by coal-fired power plant depends on internal factors and external factors. The internal factors refer to the physical and chemical properties, content and occurrence state of heavy metals in coal. Lignite is the main coal resource in Xilin Gol League, which has the lowest degree of coalification among coal varieties. In the experiment of different coal varieties, lignite has the highest release rates of As and Cd, bituminous coal has the second and anthracite has the lowest (Li et al. Citation2007; Zhou et al. Citation2015a). In the process of oxygen enriched combustion of lignite, As and Cd are easily released at 800–1200°C (Xu, Cheng, and Zeng Citation2004; Roy, Choo, and Bhattacharya Citation2013). The external factors refer to the government’s emission control regulations, the discharged standard of coal-fired boilers, waste gas purification technology, and the maintenance status of equipment in power plants, etc. At present, the latest Emission Standard of Air Pollutants for Thermal Power Plants (GB 13223–2011) issued by Ministry of Environmental Protection of China only covers the emission limits of smoke, SO2, NOx, and Hg. Other heavy metals released in the process of coal combustion such as Cd and As are not stipulated. As a result, the purification technology in the power plant is primarily aimed at reducing SO2, NOx, and Hg. Therefore, improvement needs to be done to prevent the heavy metal pollution caused by emissions in the process of thermal power generation in China.
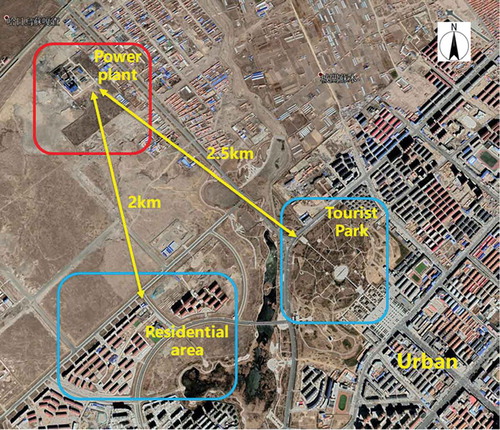
In this study, the selected Xilin thermal power plant is located at the upwind direction of Xilinhot city, and the height of its chimney is 100 m. The local wind is mainly north wind with a monthly speed of 4.9 m/s. It can be inferred through the Gaussian model (Pasquill Citation1974) that the air quality in the range of downwind 100 m to 3000 m of the power plant is affected by its industrial waste gas. Meanwhile, the maximum of RNIPI calculated previously appeared at S33 – downwind 700 m of power plant, which also proved that the heavy metals pollution in soil caused by the emission of power plant was significantly intensive. Furthermore, the power plant is close to urban areas (). It is only 2 km away from the nearest residential area and 2.5 km away from the famous Beizimiao tourist park. The heavy metals pollutions caused by the power plant’s emissions have definitely posed a threat to people’s daily life.
Figure 8. The location of a power plant, residential area, and tourist park in the study area.
Based on the above analysis and field investigation, the following countermeasures are proposed:
(1) In the future urban planning of Xilinhot, the enterprises with large volume of pollutants discharge should be considered and moved into an integrated industrial district. The location of the industrial district is supposed to be in the downwind direction of the city, at least 5 km away from the residential area, and far away from water source, agricultural land and other ecological functional areas, in order to protect urban residents from the industrial pollutants.
(2) The government of China shall establish further standards for heavy metal discharging including As and Cd from coal-fired enterprises, combined with the environmental protection tax to motivate the enterprises legally and economically, so as to better protect people’s ecological security.
Conclusion
The development of CPBs has negative ecological impacts on the soil of surrounding city, especially the accumulation of heavy metals. Taking Xilinhot CPB as an example:
The pollution of Cd and As were dramatic. The mean of Cd was 1.11 mg·kg−1 that was 42.55 times higher than the local background value, and the mean of As was 25.13 mg·kg−1, which was 4.41 times higher than the background value. There is slight accumulation of Cu, and no obvious accumulation of Pb, Mn, and Zn.
Based on the geo-accumulation index values, the pollution degrees of the six heavy metals in soil were ranked as Cd > As > Cu > Mn > Zn > Pb. Cd was strongly contaminated, and As was moderately contaminated. Cu, Pb, Zn, and Mn were uncontaminated.
Among the six heavy metals, the highest potential ecological risk factor
was Cd – at extremely high risk, followed by As was at moderate risk; the other four heavy metals Pb, Cu, Zn, and Mn were at slight risk.
From the spatial distribution perspective, the RNIPI of Urban was the highest, followed by Power plant and Suburb, all of above three were strongly contaminated; the RNIPI of Open pit mine waste dump was relatively low, but still at moderately to strongly contaminated. The potential ecological risks of all regions were extremely high.
Arsenic, Pb, and Cd were primarily derived from anthropogenic sources including mining, coal combustion, industrial exhaust emissions, etc. Cu, Mn, and Zn were homologous, mainly from the parent material (natural sources).
Disclosure statement
No potential conflict of interest was reported by the authors.
Additional information
Funding
References
- Bo, X., F. Tian, W. Tang, Y. Li, X. Du, X. Lei, S. Li, X. Zhao, H. Sun, and B. Zhou. 2019. “Influence of Air Pollutants Transport from Key Coal and Electricity Production Bases on Beijing-Tianjin-Hebei Region.” China Environmental Science 39: 514–12.
- Chen, M., T. Yang, D. Li, L. Zhao, and H. Xu. 2016a. “Pollution Characteristics and Ecological Risk Assessment of Heavy Metals in Rice Field Soils around a Tungsten Mine in Gannan of Jiangxi.” Nonferrous Metals Engineering 6: 89–95.
- Chen, T., Q. Chang, J. Liu, J. G. P. W. Clevers, and L. Kooistra. 2016b. “Identification of Soil Heavy Metal Sources and Improvement in Spatial Mapping Based on Soil Spectral Information: A Case Study in Northwest China.” Science of the Total Environment 565: 155–164. doi:10.1016/j.scitotenv.2016.04.163.
- Chen, Y., L. Weng, J. Ma, X. Wu, and Y. Li. 2019. “Review on the Last Ten Years of Research on Source Identification of Heavy Metal Pollution in Soils.” Journal of Agro?Environment Science 38: 2219–2238.
- Douay, F., A. Pelfrene, J. Planque, H. Fourrier, A. Richard, H. Roussel, and B. Girondelot. 2013. “Assessment of Potential Health Risk for Inhabitants Living near a Former Lead Smelter. Part 1: Metal Concentrations in Soils, Agricultural Crops, and Homegrown Vegetables.” Environmental Monitoring Assessment 185: 3665–3680. doi:10.1007/s10661-012-2818-3.
- Du, X., Y. Ma, Y. Wu, M. Guo, and X. Mao. 2010. “Study on Determination Method of Hazardous Elements in Fuel Coal and Other Solid By-products in Thermal Power Plants, Their Migration Rules during Combustion, and Their Influence upon Environment.” Thermal Power Generation 39: 16–21+40.
- Fan, Q. 2015. “Pollution and Health Risk Assessment of Heavy Metal in Soil Neighborhoods around A Smelter in Changqing Town of Baoji City.” Environmental Pollution & Control 37: 46–54.
- Gu, Y., and F. Gao. 2017. “Spatial Distribution and Health Risk Assessment of Heavy Metals in Provincial Capital Cities, China.” Environmental Chemistry 36: 62–71.
- Gu, Y., T. Zhang, and H. Bai. 1995. “Qualitative Classification of Soil Background Value in Inner Mongolia.” Inner Mongolia Environmental Protection 7: 6–9.
- Guo, G., F. Wu, F. Xie, and R. Zhang. 2012. “Spatial Distribution and Pollution Assessment of Heavy Metals in Urban Soils from Southwest China.” Journal of Environmental Sciences 24: 410–418. doi:10.1016/S1001-0742(11)60762-6.
- Guo, X., Y. Wang, B. Zhang, J. Liao, and Z. Han. 2018. “Soil Properties and Pollution Assessment of Heavy Metals in a Lead-zinc Mining Area of Semiarid Grassland in Inner Mongolia.” Environmental Chemistry 37: 851–859.
- Hakanson, L. 1980. “An Ecological Risk Index for Aquatic Pollution Control.a Sedimentological Approach.” Water Research 14: 975–1001. doi:10.1016/0043-1354(80)90143-8.
- Hoaghia, M.-A., E.-A. Levei, O. Cadar, M. Senila, and G.-G. Hognogi. 2017. “Assessment Of Metal Contamination And Ecological Risk In Urban Soils Situated Near A Metallurgical Complex.” Environmental Engineering & Management Journal (EEMJ) 16: 1623–1630. doi:10.30638/eemj.2017.175.
- Huang, S., G. Shao, L. Wang, L. Wang, and L. Tang. 2018. “Distribution and Health Risk Assessment of Trace Metals in Soils in the Golden Triangle of Southern Fujian Province, China.” International Journal of Environmental Research and Public Health 16: 97. doi:10.3390/ijerph16010097.
- Huang, Z. 2012. “Coal-fired Power Bases Construction on the Local Economic and Environmental Impact Studies in the Context of Inter-regional Transmission.” Thesis for the Master Degree, North China Electric Power University.
- Islam, S., K. Ahmed, A. L. M. Habibullah, and S. Masunaga. 2015. “Potential Ecological Risk of Hazardous Elements in Different Land-use Urban Soils of Bangladesh.” Science of the Total Environment 512–513: 94–102. doi:10.1016/j.scitotenv.2014.12.100.
- Jiang, X., W. X. Lu, H. Q. Zhao, Q. C. Yang, and Z. P. Yang. 2014. “Potential Ecological Risk Assessment and Prediction of Soil Heavy-metal Pollution around Coal Gangue Dump.” Natural Hazards and Earth System Sciences 14: 1599–1610. doi:10.5194/nhess-14-1599-2014.
- Kim, S., J. E. Yang, D. Kim, Y. Cheong, J. Skousen, and Y. Jung. 2012. “Screening of Extraction Methods for Cd and as Bioavailability Prediction in Rhizospheric Soil Using Multivariate Analyses.” Environmental Earth Sciences 66: 327–335. doi:10.1007/s12665-011-1242-2.
- Li, Y., J. Ma, D. Liu, Y. Sun, and Y. Chen. 2015. “Assessment of Heavy Metal Pollution and Potential Ecological Risks of Urban Soils in Kaifeng City, China.” Environmental Science 36: 1037–1044.
- Li, Y., J. Zhang, Y. Zhao, Y. Wu, J. Gao, and C. Zheng. 2007. “Influence of Pyrolysis Conditions on Volatility of Trace Elements in Coals.” Journal of Engineering Thermophysics 28: 189–192.
- Liu, Y., Z. Ma, J. Lv, and J. Bi. 2016. “Identifying Sources and Hazardous Risks of Heavy Metals in Topsoils of Rapidly Urbanizing East China.” Journal of Geographical Sciences 26: 735–749. doi:10.1007/s11442-016-1296-x.
- Liu, Y., Q. Tang, Z. Bai, X. Zhang, and B. Zhang. 2009. “The Resarch of Heavy Metals Pollution in Soil Based on the Connection of Geoaccumulation Index and Nemero Index.” Chinese Agricultural Science Bulletin 25: 174–178.
- Maanan, M., M. Saddik, M. Maanan, M. Chaibi, O. Assobhei, and B. Zourarah. 2015. “Environmental and Ecological Risk Assessment of Heavy Metals in Sediments of Nador Lagoon, Morocco.” Ecological Indicators 48: 616–626. doi:10.1016/j.ecolind.2014.09.034.
- Miclean, M., O. Cadar, L. Levei, L. Senila, and A. Ozunu. 2018. “Metal Contents and Potential Health Risk Assessment of Crops Grown in a Former Mining District (Romania).” Journal of Environmental Science and Health, Part B 53: 595–601. doi:10.1080/03601234.2018.1473966.
- Muller, G. 1969. “Index of Geoaccumulation in Sediments of the Rhine Rivers.” Geological Journals 2: 108–118.
- Pasquill, F. 1974. Atmospheric Diffusion, 2nd ed., John Wiley & Sons, New York.
- Pejman, A. H., G. N. Bidhendi, M. Ardestani, M. Saeedi, and A. Baghvand. 2015. “A New Index for Assessing Heavy Metals Contamination in Sediments: A Case Study.” Ecological Indicators 58: 365–373. doi:10.1016/j.ecolind.2015.06.012.
- Roy, B., W. Choo, and S. Bhattacharya. 2013. “Prediction of Distribution of Trace Elements under Oxy-fuel Combustion Condition Using Victorian Brown Coals.” Fuel 114: 135–142. doi:10.1016/j.fuel.2012.09.080.
- Sahoo, P. K., S. M. Equeenuddin, and M. A. Powell. 2016. “Trace Elements in Soils around Coal Mines: Current Scenario, Impact and Available Techniques for Management.” Current Pollution Reports 2: 1–14. doi:10.1007/s40726-016-0025-5.
- Shao, Y., Y. Wang, Y. Li, H. Zhang, Z. Wu, and J. Liu. 2019. “Spatial-temporal Response and Comprehensive Evaluation of Ecological Environment of Prairie Coal-electricity Base Development.” Journal of China Coal Society 44: 3874–3886.
- Tavakoli, M., S. Hojjati, and Y. Kooch. 2019. “Lead and Cadmium Spatial Pattern and Risk Assessment around Coal Mine in Hyrcanian Forest, North Iran.” International Journal of Environmental and Ecological Engineering 13: 205–208.
- Tong, S., G. Liu, and N. Wu. 2016. “Temporal-spatial Changes of Temperature and Precipitation in Xilingol League from 1961 to 2010.” Bulletin of Soil and Water Conservation 36: 340–345+351.
- Wang, L. 2013. “Research on Evaluation of Circular Economy Development Power in Coal Enterprises.” Thesis for the Doctor Degree, China University of Geosciences.
- Wang, M., C. Peng, and W. Chen. 2016. “Impacts of Industrial Zone in Arid Area in Ningxia Province on the Accumulation of Heavy Metals in Agricultural Soils.” Environmental Science 37: 3532–3539.
- Wang, P. 2014. “Investigation and Risk Assessment of Heavy Metals Pollution in Soil on Both Side of Some Roads in Beijing.” Thesis for Master Degree, Beijing University of Civil Engineering and Architecture.
- Wilding, L. G. 1985. “Soil Spatial Variability: Its Documentation, Accommodation and Implication to Soil Surveys.”
- Wu, J., M. Wang, H. Zhang, Y. Huang, Z. Xu, Q. Li, H. Chen, and S. Huang. 2018. “Heavy Metal Pollution and Potential Ecological Risk of Soil from Reclaimed Industrial Sites and Surrounding River Sediments.” Environmental Science 39: 5620–5627.
- Wu, L., X. Mo, D. Zeng, H. Lv, and C. Su. 2014. “Health Risk Assessment of Heavy Metal Pollution of Abandoned Lead-zinc Smelting Plant.” Asian Journal of Ecotoxicology 9: 603–608.
- Xu, L., J. Cheng, and H. Zeng. 2004. “Experimental Investigation of the Release Characteristics of Trace Elements As, Cd and Cr during the Combustion of Coal.” Journal Of Engineering For Thermal Energy And Power 19: 478–482+547–548.
- Yang, J., J. Chen, and X. Wang. 2008. “Spatial Distribution of Heavy Metals in Soils around the Coal Waste Rock Pile and Their Environmental Pollution Assessment.” Journal of Agro-Environment Science 27: 873–878.
- Yang, Y., A. Liu, L. Chao, Y. Shan, N. Wu, H. Chen, and M. Wang. 2016. “Spatial Distribution of Soil Heavy Metals of Opencut Coal Mining in Inner Mongolia Xilingol Typical Steppe.” Ecology and Environmental Sciences 25: 885–892.
- Yang, Z., R. Xiao, Y. Chen, Y. Deng, C. Han, C. Liu, Z. Gao, S. Huang, and W. Dai. 2020. “Heavy Metal Distribution, Risk Assessment and Source Analysis of Soil around a Typical Coal-fired Power Plant in South China.” Acta Ecologica Sinica 40: 1–13.
- Yao, D.-X., J. Meng, and Z.-G. Zhang. 2010. “Heavy Metal Pollution and Potential Ecological Risk in Reclaimed Soils in Huainan Mining Area.” Journal of Coal Science and Engineering (China) 16: 316–319. doi:10.1007/s12404-010-0319-y.
- Yue, Z., R. Zhang, J. Wang, T. Gao, and H. Yang. 2017. “Research on the Characteristics of Soil Heavy Metal Pollution and Ecological Restoration in Grassland Mining Area of Sunite County.” Forest Resources Management 6: 124–130.
- Zeng, Z., K. Wang, X. Liu, F. Zeng, T. Song, W. Peng, H. Zhang, and H. Du. 2015. “Stoichiometric Characteristics of Plants, Litter and Soils in Karst Plant Communities of Northwest Guangxi.” Chinese Journal of Plant Ecology 39: 682–693.
- Zhang, L., H. Li, X. Huang, Y. Li, K. Jiao, P. Sun, and W. Wang. 2016. “Soil Heavy Metal Spatial Distribution and Source Analysis around an Aluminum Plant in Baotou.” Environmental Science 37: 1139–1146.
- Zhou, C., S. Hu, J. Guo, J. Xiang, S. Su, L. Sun, B. Xu, R. Yang, and H. Chi. 2015a. “Trace Elements Migration Transformation Rule of As/Cd/Pb/Zn during Typical Coal Pyrolysis and Gasification under High Temperature.” Journal of Combustion Science and Technology 21: 554–560.
- Zhou, Y., J. Wang, H. Zeng, and Y. Zhu. 2015b. “Spatial Characteristics of Soil Heavy Metal Pollution in Inner Mongolia, China.” Ecology and Environmental Sciences 24: 1381–1387.