
 ?Mathematical formulae have been encoded as MathML and are displayed in this HTML version using MathJax in order to improve their display. Uncheck the box to turn MathJax off. This feature requires Javascript. Click on a formula to zoom.
ABSTRACT
Assessing the temporal and spatial characteristics of cultivated land fragmentation is necessary to identify management practices that can reduce negative environmental effects. Thus, the purpose of this study was to use principal component analysis and spatial autocorrelation to analyze the dynamic characteristics of cultivated land fragmentation in different landform areas in Liaoning Province, China, in terms of time and space. An additional objective was to match the changes with the natural and social environment to support the sustainable development of fragmented cultivated land. The results indicated that the evolutionary trends of cultivated land fragmentation in the central plain area showed a weakening trend, contrary to those observed in the western hilly and eastern mountainous areas. Moreover, the spatial distribution characteristics of cultivated land fragmentation in the western hilly area were generally “external low, internal high,” primarily because of the edge density of cultivated land patches. The spatial distribution characteristics of cultivated land fragmentation in the central plain area were generally “external high, internal low,” primarily because of the number and division of cultivated land patches. The spatial distribution characteristics of cultivated land fragmentation in the eastern mountainous area were generally “south low, north high” because of the division of cultivated land patches. These results can provide guidelines for planners, managers, decision-makers and others to formulate regulatory policies, identify land remediation areas, and promote the sustainable development of cultivated land.
Introduction
Cultivated land is a precious resource that provides the environment for biological activities and the basis for agricultural production (Wang et al. Citation2019). With the implementation of qualitative and quantitative equality principles of inheritance and land reform processes (Ntihinyurwa et al. Citation2019), direct and indirect anthropogenic interventions in cultivated land use activities have transformed cultivated land from a continuous zonal distribution to a discontinuous mixed patch mosaic distribution (Li et al. Citation2016), which we call cultivated land fragmentation. Such a transformation has dual impacts. On the one hand, cultivated land fragmentation supports food quality, food sustainability, food security, and the non-agricultural labor supply and mitigates agricultural production risks by enriching production diversity in different locations (Ciaian et al. Citation2018; Lu, Xie, and Yao Citation2019; Ntihinyurwa et al. Citation2019). On the other hand, it hinders the exchange of genes between organisms and the application of modern technologies, resulting in the loss of biodiversity (Enaruvbe and Atafo Citation2019; Kuipers et al. Citation2019; Penas et al. Citation2011), detrimental effects on productivity and efficiency (Li, Ou, and Ma Citation2011; Liu et al. Citation2018; Rahman and Rahman Citation2009; Manjunatha et al. Citation2013), negative impacts on household income in rural areas (Tran and Vu Citation2019), and an attendant increase in fragmentation, which accelerates the conversion of farmland to urban uses (Qiu et al. Citation2015).
Cultivated land fragmentation is a common feature in both transition economies and developing countries (Liu et al. Citation2019). Some studies have defined the fragmentation of cultivated land through multiple strategies: (1) dividing the land based on the same or different ownership; (2) distinguishing between use rights and ownership; (3) considering the utilization type and structure of adjacent cultivated land as the basis for fragmentation; and (4) considering the number, size, shape, and distribution of patches and the distance between patches (Ntihinyurwa et al. Citation2019; Postek, Leń, and Stręk Citation2019). Meanwhile, current research on cultivated land fragmentation has changed from qualitative to quantitative analyzes with the characterization of methods that have been developed into the landscape configuration index. This is because more gross changes might only result in a limited net change while being associated with a much larger change in the landscape pattern (Yu et al. Citation2018). Furthermore, some studies have combined the factors that drive the occurrence of cultivated land fragmentation or its impact (i.e., socioeconomic policies, agricultural policies, and the natural environment) (Cheng et al. Citation2015; Ciaian et al. Citation2018; Falco et al. Citation2010; Liu et al. Citation2019; Tan, Heerink, and Qu Citation2006) to explore strategies for coping with cultivated land fragmentation such as ownership interchange or land consolidation. Nonetheless, several remaining shortcomings must be addressed. First, large differences in elevation for some areas lead to nonsignificant effects of land remediation measures (Wen et al. Citation2016). Land consolidation is appropriately applied in most homogeneous areas with less variability in agro-ecological, climatic, socioeconomic, and physical conditions (Ntihinyurwa et al. Citation2019). Thus, it is necessary to understand the distribution characteristics of cultivated land fragmentation in different landform areas. Second, cultivated land fragmentation caused by the long-term effects of socioeconomic systems and the natural environment must be assessed on a long time series (Ciaian et al. Citation2018; Liu et al. Citation2019). Third, most previous research on cultivated land fragmentation has primarily been conducted at household (Tran and Vu Citation2019), regional (Ciaian et al. Citation2018; Liu et al. Citation2019), farm (Ntihinyurwa et al. Citation2019), county (Chen et al. Citation2016), and watershed (Su et al. Citation2014) scales. Such studies require the identification of the areas of cultivated land fragmentation to implement land consolidation and to reflect the internal regional changes.
As a result, the aims of this study were to evaluate the spatiotemporal evolution characteristics of cultivated land fragmentation in different landform areas on 10 × 10 km grid as the basic unit and to analyze the matching degree between cultivated land fragmentation and the natural-social environment. These objectives were achieved by testing the following hypotheses: (1) cultivated land fragmentation is dominated by the physical structure, and (2) different landform areas have obvious regional differentiation in the characteristics of cultivated land fragmentation because of the interaction between natural, social, economy, and institutional factors. It is expected that the findings of this study will provide theoretical and methodological guidelines for addressing cultivated land fragmentation to support the sustainable development of cultivated land from the perspective of different landform areas.
Materials and methods
Study area
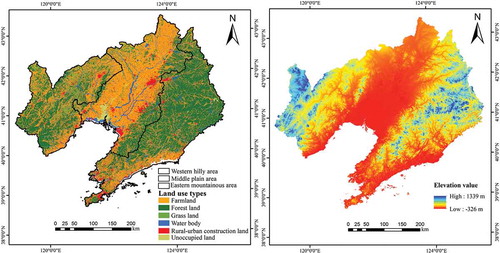
Liaoning Province is the principal grain-producing region of Northeast China and is located at 38°43′18″N–43°29′26″N, 118°50′16″E–125°41′16″E. The total cultivated land area of 6.41 million hectare (M ha) accounts for 43.8% of the total area of Liaoning Province and produces 20.0 million Mg of grains per year. The major proportion of cultivated land resources is located in the hilly area of western Liaoning and the plain area of central Liaoning. The mountainous area of eastern Liaoning is dominated by forestland and has a relatively smaller amount of cultivated land. The climate is the temperate continental monsoon type, with a mean annual precipitation range of 400–1150 mm and an annual mean temperature range of 5–11°C. The terrain of Liaoning Province slopes from the south to the north and from the east and west to the middle (Pu et al. Citation2019). The average elevations of the hilly area of western Liaoning, the plain area of central Liaoning, and the mountainous area of eastern Liaoning are 800 m, 500 m, and 200 m, respectively (). Thus, the abundant cultivated land resources and distinctive landform features in Liaoning Province are ideal for the discrimination of the characteristics of cultivated land fragmentation in different regions. The appropriate and efficient utilization of cultivated land resources is also critical to foster the sustainable development of Liaoning Province.
Figure 1. Status of land use in Liaoning Province in 2015 and elevation.
Data sources
This dynamic study on cultivated land fragmentation was implemented based on the availability of multivariate data. The socioeconomic data at the county level (i.e., grain yields, agricultural employees, and total power used for agricultural machinery) were derived from the Liaoning Yearbook, the Liaoning Rural Statistical Yearbook, the Liaoning Statistical Yearbook, the China Statistical Yearbook (Township), and the China Rural Statistical Yearbook (1996, 2006, and 2016) as well as from some local yearbooks. Regression equations were established by using Statistical Product and Service Solutions (SPSS) software to determine the coefficients to completely achieve spatial statistical data for the 10 × 10 km grid (). In the process of extracting slope data, the GDEMV2 digital elevation model (DEM) with a spatial resolution of 30 m was used on the basis of the geospatial data cloud platform (http://www.gscloud.cn). The normalized difference vegetation index (NDVI) data of cultivated land were obtained from the Data Center for Resource and Environmental Sciences, Chinese Academy of Sciences (RESDC) (http://www.resdc.cn). Additionally, the indexes of landscape configuration were measured with a geographic information system (GIS) segmentation tool and the selection of class level metrics in the Fragstats4.2 software platform, which involves the selection of the grid scale when vector data are converted to raster data. Based on the analysis of the particle size and the loss of cultivated area, a cell size of 25 × 25 m was chosen. The data on cultivated land information were taken from Landsat 4–5TM (30 m) and Landsat 8OLI(15 m) remote sensing images, which were derived from image preprocessing methods such as band synthesis, image mosaic, and image cropping, and then combined with the standard land use classification system published in 2007 (GB/T 21010–2007) for image supervised classification through the support vector machine classification tools of the ENVI5.1 software. The land use types were classified into six categories: farmland, forestland, grassland, water area, construction land, and unoccupied land. Subsequently, random dynamic patches were extracted and combined with existing land use maps and field surveys for use as verification criteria. After the confusion matrix test, the accuracy was more than 85%, and the Kappa coefficient was greater than 0.8 in 1995, 2005, and 2015, which is in line with the study standard. Therefore, the cultivated land information could be extracted by the GIS identification tool for each grid.
Table 1. Indicator system and calculation results of principal component analysis in Liaoning Province.
Table 2. Regression results of statistical data in different landform areas.
Methods
Index of evaluation system for cultivated land fragmentation
The present study constructed an evaluation index system covering 4 criteria and 8 indicator layers to summarize the landscape pattern information and reflect the characteristics of the structural composition and spatial configuration. The specific indicators shown in include the following. (1) The number of cultivated land patches, which determine the spatial distribution characteristics of various species and their secondary species in the landscape, change the interactions among species and the stability of synergistic symbiosis, and its value is positively correlated with the fragmentation of the landscape configuration. (2) The sizes of the cultivated land patches directly reflect the cultivated land fragmentation based on the average patch area and patch density (e.g., a landscape with a smaller average patch area is generally more fragmentary than a landscape with a larger average patch area). (3) The shape of the cultivated land patches, the boundary density index, and the average shape index indicate the degree of irregularity of the landscape based on the boundary or the shape of the patches and can mirror the waste of production materials. (4) The spatial distribution of cultivated land patches can be summarized as the distances between plots and their uses or locations. The more scattered the patches of cultivated land are, the greater the fragmentation of cultivated land.
Comprehensive evaluation of cultivated land fragmentation
The values of the fragmentation indicators of cultivated land have different connotation properties and dimensions. Direct analysis may weaken the indicator values with lower numerical values, causing deviations in the results of the comprehensive analysis. Therefore, the maximum difference normalization method was used to standardize the indicators, as shown in 1.
where Yij is the standardized value, Xij is the actual value of the j-th index in the i-th year, Xjmax is the maximum value in the index, and Xjmin is the minimum value in the index.
Since there is a strong correlation among the landscape indexes used to measure the cultivated land fragmentation, principal component analysis was used to reduce the dimension and data redundancy by dividing the data in the load matrix by the square root of the eigenvalue corresponding to the principal component to obtain the corresponding coefficients of the original indicators in each principal component. The process of dimension reduction was implemented in SPSS23.0, and the results are shown in . It can be seen that the cumulative contribution of the first principal component is much larger than 85%, and the first principal component can be used to comprehensively measure the fragmentation of cultivated land.
In addition to the evaluation of cultivated land fragmentation, this study also estimated the rate of change of cultivated land fragmentation in different grids, as shown in 2.
where Cu is the index value of the cultivated land fragmentation at the beginning of the period, Cv is the index value of the cultivated land fragmentation at the end of the period, and T indicates the duration of the study period.
Spatial autocorrelation of cultivated land fragmentation
The spatial heterogeneity of cultivated land fragmentation requires the analysis of the spatial distribution characteristics to develop targeted improvement plans. Therefore, the global spatial autocorrelation analysis method was used to obtain the overall spatial dependence in the study area. The local Moran’s I method subdivides the global Moran’s I method into the local space and reveals the similarity between spatial units to reflect the spatial heterogeneity. The mathematical formula is shown below in 3.
where xi, and xj are the fragmentation values of the cultivated land of grids i and j, respectively; n is the number of grids; is the average; and Wij is a spatial weight matrix. The creation of a weight matrix based on the threshold distance often leads to unbalanced connection structures between points. Hence, the K-nearest neighbors method was chosen.
Some researchers have reported that little attention has been paid to the effects of the K-nearest neighbor spatial distribution, utilization, and natural properties of cultivated land resources based on fragmentation, especially in the context of spatial scales (Ciaian et al. Citation2018; Liu et al. Citation2019). Thus, the bivariate spatial autocorrelation was introduced to analyze the degree of matching of cultivated land fragmentation with the natural or social environment. The equations are as follows.
where IiUL represents the bivariate local spatial autocorrelation coefficient of grid i; XiU represents the observation value of the U-th cultivated land fragmentation of grid i; XjL represents the observation value of the L-th natural or social environment of grid j; and
represent the average cultivated land fragmentation values of items U and L, respectively; σ is the variance; Z(I) represents the test value; E(I) represents the mathematical expectation; Var(I) represents the variance; and the other variables are the same as above. The above autocorrelation analysis results were tested using the z value and the p value in Geoda, and the significance criteria are listed in .
Table 3. The significance criteria of spatial autocorrelation analysis.
Results
Evolution and spatial characteristics of cultivated land fragmentation
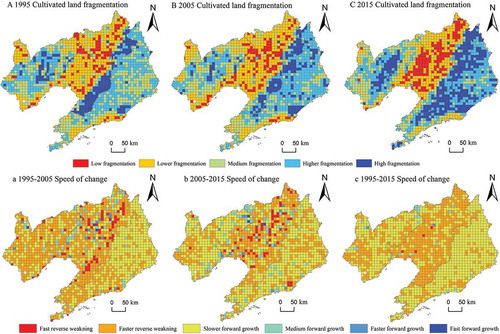
The quantities, utilization patterns, and agricultural activities of cultivated land in in the western hilly area, the central plain area, and the eastern mountainous area of Liaoning Province had regional characteristics. The spatial distribution characteristics of cultivated land fragmentation in these landform areas varied widely. The evolution of cultivated land fragmentation in the western hilly area indicated that the overall fragmentation of cultivated land increased from 1995 to 2015, but the growth rate was relatively low. The enhanced area was mainly concentrated in the central and northern parts of western Liaoning () and ()). Compared to that in the period of 1995 to 2005, the growth rate of cultivated land fragmentation changes was higher from 2005 to 2015 () and ()). Between 2005 and 2015, the area of cultivated land fragmentation in the western hilly area increased by 1.43 M ha, accounting for 74.4% of the western hilly area, while the annual average degree of fragmentation increased by 0.009. Approximately 70.5% of the grid cells experienced a wide range of growth trends, similar to the edge density index. From 1995 to 2005, the declining trend of cultivated land fragmentation was more obvious in the western hilly area, and it decreased by 1.11 M ha, accounting for 55.4% of the western hilly area. The annual average degree of fragmentation decreased by 0.002, which was positively correlated with the shape regularity of cultivated land patches. The evolution of cultivated land fragmentation in the central plain area indicated that the overall fragmentation of cultivated land continued to weaken, and the pattern changed from a scattered distribution to an agglomeration distribution in the central plain area from 1995 to 2015 ( and ()). The rate of change of cultivated land fragmentation decreased significantly from 1995 to 2005 compared to that from 2005 to 2015, and the annual average degree of fragmentation in the central plain decelerated by 0.004 and 0.003, respectively () and ()). From 1995 to 2005, the area of cultivated land fragmentation decreased by 2.01 M ha, accounting for 59.2% of the area in this region, while the trend of cultivated land fragmentation decreased significantly. From 2005 to 2015, the number of grid cells with decreases in cultivated land fragmentation was 372, accounting for 60.6% of the total grid cell area, which was 5.4% less than that from 1995 to 2005. Overall, the background conditions of cultivated land resources in central Liaoning had advantages in both quantity and quality, and the average values of the cultivated land fragmentation indexes were smaller than those in the western hilly area and the eastern mountainous area of Liaoning. The evolution of cultivated land fragmentation in the eastern mountainous area indicated that between 1995 and 2015, the area of cultivated land fragmentation increased by 1.32 M ha, accounting for 81.6% of the total land area () and ()), and the increasing trend was notably faster than that of the western hilly area and the eastern mountainous area of Liaoning () and ()). From 1995 to 2005, the area of cultivated land fragmentation in the eastern mountainous area increased by 1.01 M ha, accounting for 62.4% of the total area. From 2005 to 2015, the area of cultivated land fragmentation in the eastern mountainous area increased by 1.25 M ha, accounting for 75.1% of the total area. The fragmentation degree of cultivated land in the eastern mountainous area was overall higher because eastern Liaoning Province was dominated by forestland, and the landscape division index was significantly larger than that in the western hilly area and the central plain area of Liaoning.
Figure 2. Spatial distribution and evolution rate of cultivated land fragmentation in different landform areas.
Spatial agglomeration features of cultivated land fragmentation
The cultivated land fragmentation had significant spatial heterogeneity. The specific performance can be divided into four spatial relationship types, namely, HH, LL, HL and LH, and spatial randomness. HH (LL) characterizes the regional diffusion phenomenon when high values (low values) are surrounded by high values (low values). HL (LH) characterizes the polarization phenomenon that occurs when high values (low values) of a region are surrounded by low values (high values). As presented in , the Global Moran’s I values for different landform areas in 1995, 2005, and 2015 were calculated in Geoda and were all significantly positive at the 1% level of probability. This trend indicated that the cultivated land fragmentation in different landform areas of Liaoning Province had visible agglomeration features, accompanied by diffusion phenomenon, but there were differences in the degree of agglomeration. The specific agglomeration degree could be arranged as follows: the central plain area > the western hilly area > the eastern mountainous area of Liaoning. From the perspective of spatial agglomeration, the Global Moran’s I values in the western hilly area and the central plain area were less variable, with values of approximately 0.6 and 0.7, respectively, indicating that the spatial distribution characteristics of these regions were relatively stable. In the eastern mountainous area, the degree of spatial agglomeration increased notably from 1995 to 2005 and decreased slightly from 2005 to 2015.
Table 4. Univariate Global Moran’s I index of cultivated land fragmentation in different landform areas.
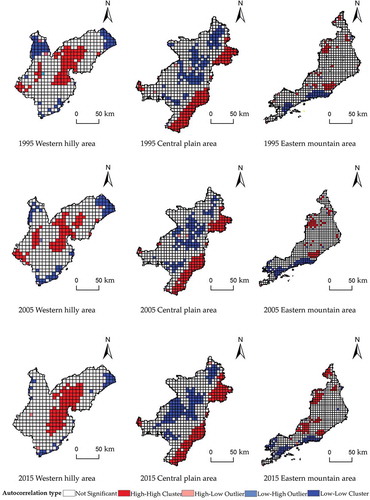
To further describe the spatial distribution characteristics of cultivated land fragmentation in different landform areas of Liaoning Province, this study conducted local spatial autocorrelation analysis and obtained a clustering map (). The spatial distribution characteristics of cultivated land fragmentation in the western hilly area were generally “external low, internal high.” The HH agglomeration areas were mainly distributed in the central part of the western hilly area, and the distribution proportion decreased from 17.2% to 15.8% and then increased to 17.8%, demonstrating a spatial diffusion phenomenon. The LL agglomeration area regularly changed along the edge of the region. The spatial distribution characteristics of cultivated land fragmentation in the central plain area were generally “external high, internal low.” The HH agglomeration areas were primarily distributed in the southeastern part of the region due to the spatial distribution of forestland. The mean patch areas were small, and the distances between patches were relatively large. The LL agglomeration areas were mostly distributed in the central part of the central plain area, which was the main agricultural area, with a high aggregation of cultivated patches. The HL and LH types were scattered with no distribution regularities. The spatial distribution characteristics of cultivated land fragmentation were generally low in the southern regions and high in the northern regions in the eastern mountainous area. The numbers of HH and LL agglomeration areas continued to increase, but at least 73.8% of the area remained as nonsignificant areas.
Figure 3. Univariate Local Moran’s I clustering map of cultivated land fragmentation in different landform areas.
Spatial matching of cultivated land fragmentation
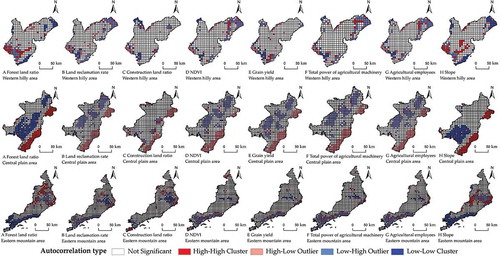
The cultivated land fragmentation and the natural social environment were matched by combining the fragmentation with the spatial distribution characteristics of the fragmentation to thoroughly understand the texture of the fragmentation. The relationship can be indicated by the Global Moran’s I, the HL or LH trade-off relationship, and the HH or LL synergistic relationship. This article took the spatial relationship in 2015 as an example. The Global Moran’s I values were calculated in Geoda and are depicted in , which shows that the cultivated land fragmentation in different landform areas had a synergistic relationship with the slope and forestland ratio at the 1% level of probability. These values also had a trade-off relationship with the land reclamation rate, construction land ratio, NDVI, grain yield, total power of agricultural machinery, and number of agricultural employees at the 1% level of probability. This trend indicated that cultivated land fragmentation mainly occurred in areas with high slopes or a main distribution of forestland, while it hardly occurred on cultivated land with a favorable quantity and quality. Abundant cultivated land resources were measured based on a high land reclamation rate, and the favorable natural quality conditions of cultivated land resources with the vigorous growth of plants were characterized by the NDVI. During cultivated land utilization, the fragmentation of cultivated land hindered the operation of agricultural machinery and affected the scale of management, which in turn had a negative impact on grain production. The spatial matching of cultivated land fragmentation is further illustrated in . In the western hilly area, the LH trade-off areas were distributed along the periphery, with a low spatial fragmentation, small terrain fluctuations, fertile soil, and favorable machinery conditions as well as modern agricultural development ()–()). The HH synergistic areas were scattered on both sides of the southwest and northeast regions. The number of HL trade-off areas was small, and these areas were distributed around the southwest regions. The LL synergistic areas were distributed in the northeast and south regions, accompanying adequate cultivated land resources () and ()). The spatial pattern of cultivated land fragmentation matching in the central plain area could be clearly divided into two parts along the northeast to southwest regions. Some of the regions in the northwest direction were dominated by LH trade-off distributions and LL synergistic distributions and had a flat topography, abundant cultivated land resources, a concentrated distribution, favorable natural quality conditions, convenient location conditions, and outstanding production and employment security functions of cultivated land ()–()). Other regions in the southeast direction were dominated by HL trade-off distributions and HH synergistic distributions, and the cultivated land resources were relatively poor. The advantage of cultivated land resources in the eastern mountainous area of Liaoning was weakened from the south to the north, with significant differences. Therefore, the eastern mountainous area of Liaoning should focus on implementing differentiated management and protecting regional advantages.
Table 5. Bivariate Global Moran’s I index of in different landform areas.
Figure 4. Bivariate Local Moran’s I clustering map in different landform areas.
Discussion
There were visible differences in the rate of evolution, spatial distribution, and spatial matching of cultivated land fragmentation in different landform areas. The results indicated that the number of agricultural employees was inversely related to the fragmentation of cultivated land. These results agreed with the results from a previous study showing that cultivated land fragmentation could disperse the labor intensity, reduce the number of agricultural employees through different field management strategies, and decrease the diversity of crops planted throughout the harvest season (Ji, Xiong, and Liu Citation2016). Additionally, the proportion of constructed land was inversely related to cultivated land fragmentation, which is different from the common understanding of urban expansion, which assumes that construction land encroaches on cultivated land, and the loss of cultivated land and increased fragmentation mainly occurred in areas with urban development (Yu et al. Citation2018). Therefore, we narrowed the scope and repeatedly executed bivariate autocorrelation analysis on parts of the grids in the central plain area and found that cultivated land fragmentation was positively correlated with the proportion of construction land. This indicated that the scope of the study area could affect the matching relationship between cultivated land fragmentation and the social environment. In different landform areas, taking the construction land of major towns in the central plain area as the boundary, the cultivated land fragmentation was greater in the eastward direction, where the proportion of construction land is lower, the distance from the towns is greater, the mountainous and forest areas are closer, and the amount of cultivated land is greater. In the opposite direction, the proportion of urban construction land was relatively low. The construction land was interspersed in the continuous cultivated land, hampering the integrity of the cultivated land and increasing the number of patches and the boundary density of the cultivated land, which resulted in increasing fragmentation of the cultivated land.
Overall, our results were the same as those of Yu et al., who showed an obvious trend of cultivated land fragmentation in Liaoning Province. The enhanced areas were mainly distributed in the western hilly area, while the weakened areas were mainly distributed in the southern parts of the eastern mountainous area (Yu et al. Citation2018). However, due to differences in our study unit and periods, the main change areas of cultivated land fragmentation that we obtained were not completely consistent. In our study, since the cultivated land resources in the middle plain area were relatively abundant, the areas of increased cultivated land fragmentation did not occupy a dominant position. Meanwhile, the classification method and research scale of this study area are also applicable to other regions, which encourages the use of appropriate grid size as the study scale based on the landform characteristics of each region to help managers or decision makers to manage cultivated land resources, and implement differentiated measures to improve or utilize the cultivated land fragmentation from the perspective of multi-scale and multi-balance considerations. Therefore, the focus of future research is further subdividing the study area and increasing the threshold of the fragmentation of cultivated land, which would lead to precise results for cultivated land protection.
Conclusions
Clarifying the spatial distribution and matching cultivated land fragmentation with the natural or social environment are appropriate to address cultivated land fragmentation. The hypothesis that different landform areas have obviously different regional cultivated land fragmentation characteristics when the fragmentation is dominated by the physical structure was proven by the comparative analysis of the western hilly area, the central plain area, and the eastern mountainous area. The data support the following conclusions.
In similar periods of time, there were differences in the direction and rate of evolution of cultivated land fragmentation, as reflected by the facts that the cultivated land fragmentation in the central plain area continued to weaken, that in the eastern mountainous area continued to increase, and that in the western hilly area was initially weak and then became strong. This points to the evolution trend of cultivated land fragmentation in the grid and supports the formulation of the next implementation plan by planners.
The spatial characteristics and causes of cultivated land fragmentation in different landform areas were distinct. The spatial distribution characteristics of cultivated land fragmentation in the western hilly area were generally “external low, internal high,” primarily because of the edge density of cultivated land patches. The spatial distribution characteristics of cultivated land fragmentation in the central plain area were generally “external high, internal low,” and the main reasons were the number and division of cultivated land patches. The spatial distribution characteristics of cultivated land fragmentation in the eastern mountainous area were generally “south low, north high,” and the main reason was the division of cultivated land patches. Hence, it is necessary to implement regional differentiated management from the perspective of the physical structure, which provides a direction for managing cultivated land fragmentation.
The results on matching the cultivated land fragmentation with the natural or social environment can be directed to the proper development of cultivated land fragmentation. Areas with small fragmentation and obvious advantages in cultivated land resources continue to satisfy social needs. Areas with moderately restrictive conditions and good levels of cultivated land should implement land consolidation. Areas with a large degree of fragmentation and obvious regional characteristics require protection of the regional advantages.
Disclosure statement
The authors declare that they have no conflicts of interest.
Additional information
Funding
References
- Chen, W., X. Feng, R. Ma, and Q. Hong. 2016. “Method of Cultivated Land Fragmentation Evaluation and Empirical Research: A Case of Ningbo City in Zhejiang Province.” China Land Sciences 30 (5): 80–11. doi:10.11994/zgtdkx.20160616.142815.
- Cheng, L., N. Xia, P. Jiang, L. Zhong, Y. Pian, Y. Duan, Q. Huang, M. Li. 2015. “Analysis of Farmland Fragmentation in China Modernization Demonstration Zone since “Reform and Openness”: A Case Study of South Jiangsu Province.” Scientific Reports 5: 11797. doi:10.1038/srep11797.
- Ciaian, P., F. Guri, M. Rajcaniova, D. Drabik, and S. G. Paloma. 2018. “Land Fragmentation and Production Diversification: A Case Study from Rural Albania.” Land Use Policy 76: 589–599. doi:10.1016/j.landusepol.2018.02.039.
- Enaruvbe, G. O., and O. P. Atafo. 2019. “Land Cover Transition and Fragmentation of River Ogba Catchment in Benin City, Nigeria.” Sustainable Cities and Society 45: 70–78. doi:10.1016/j.scs.2018.11.022.
- Falco, S. D., I. Penov, A. Aleksiev, and T. M. Rensburg. 2010. “Agrobiodiversity, Farm Profits and Land Fragmentation: Evidence from Bulgaria.” Land Use Policy 27 (3): 763–771. doi:10.1016/j.landusepol.2009.10.007.
- Ji, Y., X. Xiong, and H. Liu. 2016. “Land Fragmentation and the Transfer of Rural Labor.” China Population, Resources and Environment 26 (8): 105–115. doi:10.3969/j..1002-2104.2016.08.015.
- Kuipers, K. J. J., R. F. May, B. J. Graae, and F. Verones. 2019. “Reviewing the Potential for Including Habitat Fragmentation to Improve Life Cycle Impact Assessments for Land Use Impacts on Biodiversity.” The International Journal of Life Cycle Assessment 24 (12): 2206–2219. doi:10.1007/s11367-019-01647-1.
- Li, P., Y. Lü, C. Zhang, W. Yun, J. Yang, and D. Zhu. 2016. “Analysis of Cultivated Land Fragmentation in Beijing-Tianjin-Hebei Region Based on Kernel Density Estimation.” Transactions of the Chinese Society for Agricultural Machinery 47 (5): 281–287. doi:10.6041/j..1000-1298.2016.05.038.
- Li, X., M. Ou, and X. Ma. 2011. “Analysis on Impact of Fragmentation Based on Landscape Index to Cultivated Land Use efficiency——A Case on Lixiahe District in Yangzhou City.” Journal of Natural Resources 26 (10): 1758–1767. doi:10.11849/zrzyxb.2011.10.012.
- Liu, J., X. Jin, W. Xu, R. Sun, B. Han, X. Yang, Z. Xu, et al. 2019. “Influential Factors and Classification of Cultivated Land Fragmentation, and Implications for Future Land Consolidation: A Case Study of Jiangsu Province in Eastern China.” Land Use Policy 88: 104185. doi:10.1016/j.landusepol.2019.104185.
- Liu, Y., Q. Liu, X. Tang, Y. Ren, C. Sun, and L. Tang. 2018. “Effects of Fragmentation of Cultivated Land Unit on Mechanical Harvesting Efficiency of Wheat in Plain Area.” Transactions of the Chinese Society for Agricultural Machinery 49 (2): 225–231. doi:10.6041/j..1000-1298.2018.02.029.
- Lu, H., H. Xie, and G. Yao. 2019. “Impact of Land Fragmentation on Marginal Productivity of Agricultural Labor and Non-agricultural Labor Supply: A Case Study of Jiangsu, China.” Habitat International 83: 65–72. doi:10.1016/j.habitatint.2018.11.004.
- Manjunatha, A. V., A. R. Anik, S. Speelman, and E. A. Nuppenau. 2013. “Impact of Land Fragmentation, Farm Size, Land Ownership and Crop Diversity on Profit and Efficiency of Irrigated Farms in India.” Land Use Policy 31: 397–405. doi:10.1016/j.landusepol.2012.08.005.
- Ntihinyurwa, P. D., W. T. D. Vries, U. E. Chigbu, and P. A. Dukwiyimpuhwe. 2019. “The Positive Impacts of Farm Land Fragmentation in Rwanda.” Land Use Policy 81: 565–581. doi:10.1016/j.landusepol.2018.11.005.
- Penas, J., B. Benito, J. Lorite, M. Ballesteros, E. M. Canadas, and M. Martinez-Ortega. 2011. “Habitat Fragmentation in Arid Zones: A Case Study of Linaria Nigricans under Land Use Changes (SE Spain).” Environmental Management 48 (1): 168–176. doi:10.1007/s00267-011-9663-y.
- Postek, P., P. Leń, and Ż. Stręk. 2019. “The Proposed Indicator of Fragmentation of Agricultural Land.” Ecological Indicators 103: 581–588. doi:10.1016/j.ecolind.2019.04.023.
- Pu, L., S. Zhang, J. Yang, F. Yan, and L. Chang. 2019. “Assessment of High-standard Farmland Construction Effectiveness in Liaoning Province during 2011–2015.” Chinese Geographical Science 29 (4): 667–678. doi:10.1007/s11769-019-1061-z.
- Qiu, F., L. Laliberté, B. Swallow, and S. Jeffrey. 2015. “Impacts of Fragmentation and Neighbor Influences on Farmland Conversion: A Case Study of the Edmonton-Calgary Corridor, Canada.” Land Use Policy 48: 482–494. doi:10.1016/j.landusepol.2015.06.024.
- Rahman, S., and M. Rahman. 2009. “Impact of Land Fragmentation and Resource Ownership on Productivity and Efficiency: The Case of Rice Producers in Bangladesh.” Land Use Policy 26 (1): 95–103. doi:10.1016/j.landusepol.2008.01.003.
- Su, S., Y. N. Hu, F. Luo, G. Mai, and Y. Wang. 2014. “Farmland Fragmentation Due to Anthropogenic Activity in Rapidly Developing Region.” Agricultural Systems 131: 87–93. doi:10.1016/j.agsy.2014.08.005.
- Tan, S., N. Heerink, and F. Qu. 2006. “Land Fragmentation and Its Driving Forces in China.” Land Use Policy 23 (3): 272–285. doi:10.1016/j.landusepol.2004.12.001.
- Tran, T. Q., and H. V. Vu. 2019. “Land Fragmentation and Household Income: First Evidence from Rural Vietnam.” Land Use Policy 89: 104247. doi:10.1016/j.landusepol.2019.104247.
- Wang, L., H. Anna, L. Zhang, Y. Xiao, Y. Wang, Y. Xiao, J. Liu, and Z. Ouyang. 2019. “Spatial and Temporal Changes of Arable Land Driven by Urbanization and Ecological Restoration in China.” Chinese Geographical Science 29 (5): 809–819. doi:10.1007/s11769-018-0983-1.
- Wen, G., G. Yang, Y. Li, W. Zhao, and W. Wang. 2016. “The Governance Effect of Rural Land Consolidation on Cultivated Land Fragmentation and Its Causes: A Case Study on Jiangxia District, Xian’an District, Tongshan County in Hubei Province.” China Land Sciences 30 (9): 82–89. doi:10.11994/zgtdkx.20161011.140415.
- Yu, Q., Q. Hu, J. V. Vliet, P. H. Verburg, and W. Wu. 2018. “GlobeLand30 Shows Little Cropland Area Loss but Greater Fragmentation in China.” International Journal of Applied Earth Observation and Geoinformation 66: 37–45. doi:10.1016/j.jag.2017.11.002.