
 ?Mathematical formulae have been encoded as MathML and are displayed in this HTML version using MathJax in order to improve their display. Uncheck the box to turn MathJax off. This feature requires Javascript. Click on a formula to zoom.
ABSTRACT
Introduction: Over the past two decades, China has experienced rapid economic development, which has not only led to a rapid increase in the use of raw materials but has also created environmental problems. This research analyzes the environmental impacts of resource extraction in China at the provincial level, and fully considers the environmental impact of various resources extraction. In addition, it is the first time to quantitatively study the spatial pattern and evolution characteristics of the environmental impacts of China’s resource extraction from multiple perspectives by means of spatial visualization.
Outcomes: The results showed that the center of gravity of abiotic depletion potential (ADP) moved northwest, respiratory inorganics (RI) moved southwest and global warming potential (GWP) moved west. The results of the standard deviation ellipse showed that RI and GWP varied over time and space, while ADP showed a discrete trend. In addition, the distribution of the four in the northeast-southwest direction became more prominent.
Conclusion: To mitigate the environmental impacts of resource extraction, we recommend that regional governments implement measures to control environmental impacts in the provinces within the distributed ellipse and design targeted policies based on actual conditions.
Introduction
Because of the rapid development of China’s economy, a large number of raw materials (unprocessed resources) are being extracted (Krausmann et al. Citation2009; Schandl et al. Citation2018; Wang et al. Citation2019a). Approximately two-thirds of the world’s raw materials are extracted in China, and the proportion is still growing (UNEP-IRP Citation2019). Such extensive extraction activities produce a number of environmental impacts in China, such as air pollution (Fang et al. Citation2019; Sun et al. Citation2019; Yang et al. Citation2018), greenhouse gas emissions (Chen et al. Citation2020; Fang, Duan, and Chen Citation2020; Lin et al. Citation2020), mercury emissions (Chen et al. Citation2019; Qi et al. Citation2019), resource depletion (Chen and Shi Citation2012; Wang et al. Citation2019b), and other environmental issues (Liang et al. Citation2014; Lu et al. Citation2015). Research on the nature of the environmental impacts caused by raw material extraction can contribute to the design of policies for the management of resources and the environment.
Material flow analysis (MFA) with statistical data is the main method for characterizing the inputs of various materials and their expenditure in various aspects in a country or region (Eurostat Citation2018; Haberl et al. Citation2019; Wang et al. Citation2012). Estimating the quantities of raw materials by MFA is important for the study of environmental problems (Chen and Graedel Citation2015; Chen et al. Citation2016). MFA helps link the weight of resources to their environmental impact (Fischer-Kowalski et al. Citation2011; Wang et al. Citation2020). However, the relationship between weight and their environmental impacts is not always straightforward, as one unit of weight of different materials can have different impacts on the environment (Dente et al. Citation2018; Federal Office for the Environment Citation2018).
Life cycle assessment (LCA) is a common method for quantifying the environmental impacts of a specific product from cradle to gate (Yang et al. Citation2015). Different indicators have been specifically set up to estimate different environmental impacts, including global warming potential (GWP), abiotic depletion potential (ADP) and respiratory inorganics (RI) (Guinee et al. Citation2001; Jolliet et al. Citation2003; van Oers, Guinée, and Heijungs Citation2020). Currently, most of the estimated environmental impacts caused by resource extraction are based on LCA (Ding et al. Citation2019). For example, van der Voet et al. used the LCA method to estimate the important materials that contribute the most to environmental problems (van der Voet, van Oers, and Igor Citation2005). Previous studies have also examined the environmental impacts of domestic resource extraction in China (Zhao et al. Citation2019). However, few studies have examined the environmental impacts of resource extraction at the regional level in China. It is crucial to study the roles and positions of resource extraction in reducing environmental impacts and equitable environmental policies.
Moreover, most research on the environmental impacts of resource extraction has been conducted with a non-spatial perspective. Studies using spatial analytical methods can enhance our understanding of past and present spatial patterns (Hao et al. Citation2020; Song et al. Citation2020), aid the identification of factors that induce changes in distribution and even facilitate changes in spatial patterns based on the advantages and disadvantages of protecting the environment. Some researchers have used relevant spatial analysis to study PM2.5 emissions (Chen et al. Citation2018; Peng et al. Citation2016; Shi et al. Citation2018), carbon emissions (Cui et al. Citation2020; Kai Fang et al. Citation2019; Liu et al. Citation2019a) and resource use (Liu et al. Citation2019b; Zhang et al. Citation2015, Citation2016). To date, however, few spatial analysis has been conducted on multiple indicators of the environmental impacts caused by resource extraction on a regional scale within China.
To build on the previous research described above, this study combines MFA and LCA to characterize the environmental impacts of raw material extraction in Chinese provinces. Moreover, using two spatial analytical methods, the average center and the standard deviation ellipse, we quantify spatial patterns and temporal changes in the environmental impact of raw material extraction in China from 1995 to 2015. This study takes into account the spatial location information of the objects and makes full use of environmental impact data to analyze the temporal and spatial characteristics at China’s provincial level, which can provide support for exploring the mechanism of environmental impact transfer and designing policies of reducing environmental impacts.
The goal of this study was to analyze the environmental impacts of China’s resource extraction at the regional scale and fully consider the environmental impacts of all types of resource extraction. In addition, spatial patterns and temporal changes in the environmental impacts of resource extraction in China were quantitatively studied from various perspectives via spatial visualization. LCA, the standard deviation ellipse (SDE) and related data sources were also used. Next, we present domestic extraction (DE) of resources and their environmental impacts in China’s provinces from 1995 to 2015 and their spatial characteristics. Lastly, we discuss relevant insights and conclusions from this study.
Materials and methods
Research objects and system boundary
We estimated the environmental impacts of raw material extraction from 1995–2015 in Chinese provinces by integrating economy-wide material flow accounting (EW-MFA) and LCA. The environmental impacts of resource extraction in Chinese provinces were then studied via spatial visualization. In this study, raw materials are classified into three types: metallic minerals, nonmetallic minerals and fossil fuels. These materials are fundamental for the development of societies, and their DE is large and increasing in China. Following a previous study (Zhao et al. Citation2019), we also selected 49 types of materials for analysis, the extractions of which were substantial and provided comprehensive records from China from 1995–2015. shows the list of raw materials that were included in this study. We established an independent, year-based model to simulate the annual extraction of raw materials in China’s provinces. The functional unit of each model was defined as the extraction of raw materials in China within one year. The system boundary of metal is from ore mining to beneficiation, while nonmetallic minerals and fossil fuels were the only components of the mining process. Because of the lack of data from Tibet, Hong Kong, Macao and Taiwan, we focused our study on the other 31 provinces that had adequate data.
Table 1. List of raw materials included in this study
We defined the mining process of raw materials as the process from mining in nature to obtaining concentrate through beneficiation. One of the main reasons for including the mining process in our definition is that raw materials can be used to generate millions of final products. Thus, if the scope is defined as the process from extraction to production, consideration of all possible final products is difficult, and the balance in quality between raw materials and downstream products cannot be ensured without double counting.
LCA of resource extraction in China’s provinces
Considering the limitations of the LCA database and data collection, we focused on the environmental impacts of human behavior. We selected three representative environmental impact indicators using LCA methodology in the resources extraction process, all of which can be found on eFootprint, an LCA online system, which provides information on different environmental problems. RI (IMPACT2002) are a commonly used indicator for evaluating air quality and human health. The units of RI are PM2.5 equivalent, and RI are one of the major culprits underlying the problem of pollution and haze in China. The ADP (CML2002) is an important indicator for analyzing the scarcity of raw materials, as resource depletion is a major problem and hot topic in China (van Oers and Guinée Citation2016). The GWP (IPCC2013) is the most basic indicator for analyzing environmental problems and can thus also provide an important standard for assessing environmental quality and government decision-making.
The life cycle inventory and background data of a specific material were taken from the ecoinvent and the CLCD databases provided by eFootprint (Liu, Wang, and Chen Citation2010; Liu, Qin, and Hou Citation2010). All materials in the MFA method and LCA database were consistent. The environmental impacts of resource extraction in China’s provinces were calculated using the following equation:
where is the m-type environmental impact of resource extraction in the
th year.
is the DE of material j in the
th year and
is the m-type environmental impact of extraction per ton of material j. In this study, LCA data from eFootprint only provided 2014 as the reference year; hence, we did not distinguish the I with different years. In addition, most of the LCA data came from China’s CLCD database, which ensures that I provides a representation of China’s average level of technology.
Spatial data analysis
The SDE is based on the average center of a set of discrete points, and the calculation of the standard distance of other points away from the average center (De Smith, Goodchild, and Longley Citation2007; Peng et al. Citation2016; Wong and L. Citation2005). Thus, the SDE represents the spatial center, range, direction and shape through the long and short axes and azimuth angles. Among them, the average center (AC) refers to the “high-density” part of the distribution of spatial phenomena. The SDE represents the elements of the main distributional area, the long axis represents the degree of dispersion in geographical features in the main directional trend, the short axis represents the degree of dispersion in geographical features in the main directional trend and the azimuth is the angle between the north direction and the clockwise rotation of the long axis, which reflects the main directional trend. By comparing changes in the SDE in the time series, the entire spatial dynamic process can be described. The movement of the average center can reveal the overall evolution in the track of the elements, and the change of the dimensions of the major axis and minor axis of the ellipse represents the expansion or contraction of the specific spatial direction. The change in azimuth reflects the spatial rotation and the change in the whole element in a specific spatial direction.
The AC point can be determined by (Lee and Wong Citation2001):
where and
are the abscissa and ordinate of the mean center, respectively;
and
are the coordinates for feature i; n is equal to the total number of features; and
is the weight for feature i.
From the above, we can calculate the following three parameters of the SDE (Levine Citation2004; Scott and Janikas Citation2010):
where θ is the angle of rotation. and
represent the direction and range of the data distribution, respectively. In addition, the smaller the ratio of the short axis to the long axis, the more significant the directionality of the spatial distribution. The spatial calculations for this study were primarily conducted in ArcGIS 10.5.
Data sources
Historical data on the extraction of primary resources in China’s provinces were collected and estimated by MFA and EU material flow guidance manuals and other relevant references (Wang et al. Citation2018, Citation2019a). The main database included the China Land and Resources Yearbooks (Ministry of Land and Resources of China Citation2000–2016), which provides data on the extraction of metallic and nonmetallic minerals, and the China Energy Statistical Yearbooks (Editing Committee of China Energy Statistical Yearbook Citation1996–2016), which provides data on fossil fuel extraction.
The correlation coefficients and formulas used to adjust the amount of nonmetallic minerals were derived from the EU Material Flow Guidance Manual (Eurostat Citation2013). The environmental impact coefficients of metallic minerals, nonmetallic minerals and fossil fuels were primarily obtained through the ecoinvent and CLCD databases. These data came from the eFootprint online LCA system managed by E-Tech (Frischknecht et al. Citation2004; IKE Citation2017; Liu, Wang, and Chen Citation2010). Because the LCA data of a few nonmetallic minerals cannot be collected from the ecoinvent and CLCD databases, we used the environmental impact coefficients of limestone to replace dolomite and feldspar.
Results
Environmental impacts of overall resources extraction in Chinese provinces
Because of resource endowments and uneven economic development in various regions of China (Ma et al. Citation2018), the resource extraction and its environmental impacts also differed in regions(Miao et al. Citation2019). We used the EW-MFA method to calculate the domestic extraction of metal ores, nonmetallic minerals and fossil fuels in various Chinese provinces from 1995 to 2015 and then estimated the environmental impacts (RI, ADP and GWP) of resource extraction with LCA coefficients.
) and Fig. S1 show that the provinces of Jiangsu, Zhejiang, Shandong, Hebei, and Sichuan were the top five natural resource extractors and together contributed to approximately 40% of China’s DE. Shaanxi had the most rapid growth rate in resource extraction, increasing its DE by more than nine times from 0.1 billion tons in 1995 to 1.1 billion tons in 2015, with an average annual growth rate of more than 10%.
Figure 1. General trends in the environmental impacts of resource extraction in China. (a) Trends in domestic extraction (DE) of resources; (b) Trends in RI; (c) Trends in ADP; and (d) Trends in GWP
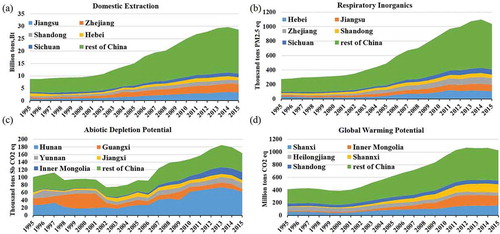
By comparison, the average annual growth rate of Hebei was less than 1% over two decades; however, resource extraction operations in Hebei remained at a much higher level throughout the study period. Hebei, Liaoning, Sichuan, Inner Mongolia and Shanxi, all located in the western and northern portions in China, were the top five metal extractors from 1995 to 2015, together contributing to more than 60% of metal extraction (Fig. S2a). Jiangsu, Zhejiang, Shandong, Guangdong and Sichuan were also the five major extractors of nonmetallic minerals, accounting for more than 40% of the total extraction of nonmetallic minerals (Fig. S3a). Shanxi, Inner Mongolia, Shaanxi, Shandong and Henan were the top five extractors of fossil fuels, accounting for approximately 60% of the total (Fig. S4a).
RI and DE showed similar trends (; Fig. S1). Hebei, Jiangsu, Zhejiang, Shandong and Sichuan were the five major RI producers and contributed to approximately 40% of China’s RI. Shaanxi experienced the most rapid growth rate in environmental impacts: its RI increased by more than eleven times from 3.9 thousand tons of PM2.5 eq in 1995 to 44.4 thousand tons of PM2.5 eq in 2015, with an average annual growth rate of more than 12%. The average annual growth rate in Heilongjiang was only 0.02% over two decades; however, its operations and environmental impact remained at a much higher level throughout the study period. Hebei, Liaoning, Sichuan, Inner Mongolia and Shanxi were the top five producers of RI, accounting for more than 60% of the total (Fig. S2b). Zhejiang, Jiangsu, Shandong, Guangdong and Sichuan were the top producers of RI caused by extraction of nonmetallic minerals, with a total of approximately 40% (see Figure S3b). Heilongjiang, Shaanxi, Xinjiang, Shandong and Shanxi were the top five producers of RI caused by fossil fuel extraction, accounting for approximately 50% of the total (see Fig. S4b).
The ADP caused by resource extraction in China fluctuated unstably during the study period (; Fig. S1). Hunan, Guangxi, Yunnan, Jiangxi and Inner Mongolia were the top five major ADP provinces, contributing to approximately 70% of China’s ADP. Tibet experienced the fastest growth rate in environmental impacts because of resource extraction, increasing its ADP by more than two thousand times from 1.2 tons of Sb eq in 1995 to 3228.8 tons of Sb eq in 2015, with an average annual growth rate of 48.2%. Although Liaoning, Guangdong, Guangxi, Guizhou, Shaanxi only declined by approximately 30% over the same two decades, the environmental impact via resource extraction remained at a much higher level throughout the study period. Hunan, Guangxi, Yunnan, Jiangxi and Inner Mongolia were the five provinces with the highest ADP as a consequence of metal extraction, accounting for more than 60% of the total (Fig. S2c). Yunnan, Jiangxi, Fujian, Zhejiang and Inner Mongolia were the five provinces with the highest ADP as a result of nonmetallic material extraction, with approximately 55% of the total (Fig. S3c). Shanxi, Heilongjiang, Fujian, Zhejiang and Inner Mongolia were the five provinces with the highest ADP as a result of fossil fuel extraction, accounting for more than 50% of the total (Fig. S4c).
GWP and DE showed similar trends (; Fig. S1). Shanxi, Inner Mongolia, Heilongjiang, Shaanxi, Shandong were the highest in GWP, contributing to approximately 50% of China’s GWP. Shaanxi had the fastest growth rate in its environmental impact from resource extraction, increasing its GWP by more than fourteen times from 9.2 million tons of CO2 eq in 1995 to 133.3 million tons of CO2 eq in 2015, with an average annual growth rate of more than 14%. However, Liaoning, Heilongjiang only declined by 2% and 26% over two decades but produced an overall higher level of environmental impact. Hebei, Liaoning, Sichuan, Inner Mongolia and Jiangxi were the top five provinces for GWP from metal extractions, accounting for more than 50% of the total (Fig. S2d). Jiangsu, Zhejiang, Shandong, Guangdong and Sichuan were the top five provinces for GWP from nonmetallic material extraction, accounting for more than 40% of the total (Fig. S3d). Shanxi, Inner Mongolia, Heilongjiang, Shaanxi and Shandong were the top five provinces for GWP from fossil fuel extraction, accounting for more than 55% of the total (Fig. S4d).
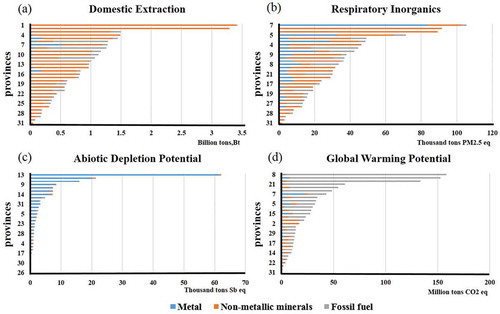
shows the descending order of the three types of resource extraction in China’s provinces in 2015. The DE of Jiangsu and Zhejiang was much higher than that of the other provinces, especially that arising from nonmetallic minerals (). Jiangsu and Zhejiang extracted 3.4 billion tons of and 3.2 billion tons of nonmetallic minerals, respectively, accounting for 29% of the total in China. Metallic minerals generated the highest RI in Hebei (). ADP in China’s provinces was primarily caused by metallic minerals (). Specifically, ADP in Hunan Province was much higher than that in other provinces. GWP in China was primarily caused by fossil fuels, especially in Shanxi, Inner Mongolia and Shaanxi, which had much higher values of ADP than other provinces ().
Figure 2. Environmental impact of resource extraction in provinces of China in 2015. (a) resource extraction in descending order; (b) RI in descending order; (c) ADP in descending order; (d) GWP in descending order. Note: The underlying information used to create this figure can be found in Table S1
Spatial analysis of the per capita environmental impacts of total resource extraction
shows the results of the spatial analysis of the environmental impacts of total resource extraction in China between 1995 and 2015. From the Northwest to the Southeast of China, per capita resource extraction showed an initial decline followed by growth across China from 1995 to 2015. The relative contributions of the per capita environmental impacts of RI and GWP also showed similar trends. However, the relative contributions of the per capita environmental impact of ADP gradually increased. Per capita resource extraction levels reflected an uneven distribution of natural resources across provinces. The variability in resource availability created a variable context for the change in environmental impacts across provinces.
Unlike in 1995, the spatial patterns of resource extraction in 2015 in the southeastern coastal areas declined compared with those in the central region, except for the Zhejiang and Jiangsu regions, which experienced large-scale developments in infrastructure and provide natural resources to Shanghai. During the study period, the average center of resource extraction of DE and RI moved southwest, ADP moved to the Northwest and GWP moved to the West. These observations reflect a rapid increase in resource extraction and environmental impacts in the western region. The focus of manufacturing has shifted during the last two decades from the Southeastern Coastal areas to Central China. This change has caused an increase in resource extraction and environmental impacts in Central China, such as in Shaanxi, Hunan, and Inner Mongolia.
In terms of DE’s SDE, both the major axis and the minor axis were shortened, and the contraction of the ellipse space indicated that the growth rate in DE in the SDE was more rapid in internal provinces than external provinces, such as in Shaanxi, Hubei and Jiangxi, where DE was more than seven times greater. The azimuth angle rotated clockwise from 74.2° in 1995 to 88.6° in 2015, indicating that the southeast region has had an increasing influence on the distribution and orientation of changes in DE. In addition, the distribution became less oblate, indicating that its directionality increased in significance.
The major and minor axes of ADP of the three types of materials increased from 1995 to 2015. The spatial expansion of the ellipse indicated that the growth rate of external provinces was more rapid than that of the internal provinces. For example, Tibet, Inner Mongolia and Chongqing had the largest growth rates, which were 1904, 15.7 and 7.7 times greater in 2015 than in 1995, respectively. The azimuth angle was rotated counterclockwise from 80.6° in 1995 to 88.5° in 2015, indicating that the northeastern regions have had an increasing influence on the distribution and orientation of changes in ADP. Indeed, the distribution became substantially less oblate, indicating that its directionality increased in significance.
Figure 3. Spatial analysis of the per capita environmental impacts of total resource extraction in China. (a) The per capita environmental impacts of resource extraction in 1995; (b) The per capita environmental impacts of resource extraction in 2015. Note: The detailed results of the spatial analysis are shown in Table S2
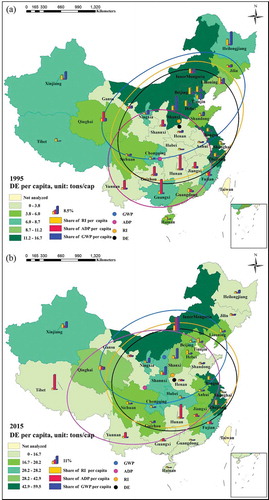
The major and minor axes of RI and GWP were smaller. Furthermore, the spatial contraction of the ellipse based on a comparison with external regions showed that these two types of environmental impacts increased more in the central region. For example, RI increased by 13.4, 6.9 and 5.8 times in Shaanxi, Hubei and Sichuan in 2015 relative to 1995. GWP increased by 13.4 and 10.7 times in Shaanxi and Inner Mongolia in 2015 relative to 1995. Their azimuths changed in a clockwise direction. The distribution of RI became less oblate, which increased the significance of the directionality; however, this same pattern was not observed in GWP.
Overall, the imbalance in natural resource use among regions of China in 2015 was much smaller compared with 1995. Thus, China appears to be becoming more regionally balanced in its economic development.
Spatial analysis of the per capita environmental impacts of metal extraction
Given the different resource endowments, the use of resources differed among regions in China (Ma et al. Citation2018). shows the spatial patterns of per capita environmental impacts and DE of metallic minerals. Per capita metallic mineral extraction in China showed a significant downward trend in production volumes from the Northwest to the Southeast in 1995. Per capita RI and GWP distributions were generally concentrated in the high-extraction provinces. However, high per capita ADP was concentrated in the Southwest and in Qinghai (). Compared with 1995, per capital metal extraction in Xinjiang, Inner Mongolia and Sichuan significantly increased in 2015. High per capita RI and GWP were still concentrated in high-extraction provinces. High per capita ADP was primarily distributed in Inner Mongolia, Tibet and Hunan. Tibet and Hunan were not high extractors ().
Figure 4. Spatial analysis of the per capita environmental impacts of metal extraction in China. (a) The per capita environmental impacts of metal extraction in 1995; (b) The per capita environmental impacts of metal extraction in 2015. Note: Detailed results of the spatial analysis are shown in Table S3
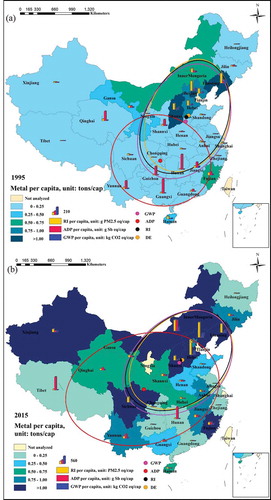
During the study period, the average center of DE, RI, ADP and GWP all moved northwest, indicating that the growth rate of DE and environmental impacts in the northwest regions were higher than those in the southeastern region. The extension of the major axis and the contraction of the short axis indicated that the rate of increase in DE from northeast to southwest was more rapid than that from northwest to southeast. The expansion of the space of the ellipse indicated that the growth rate of the outer provinces of the DE SDE was more rapid than the internal growth rate, such as in Tibet, Sichuan, and Xinjiang, which experienced up to 10 times more growth. The azimuth was rotated clockwise from 48.9° in 1995 to 71.2° in 2015, indicating that the eastern region had an increasing influence on the distribution and orientation of DE.
The increase in the major and minor axes of ADP from metals and the expansion of the space of the ellipse indicated that relative to the provinces inside the distribution ellipse, the provinces outside of the distribution ellipse had higher ADP growth rates, increasing their effect on the ADP distribution. The speed of extraction of metal in the West was rapid. Specifically, the per capita ADP in Tibet in 2015 was 2,000 times greater than that in 1995 (from 0.41 g Sb eq in 1995 to 996.3 g Sb eq in 2015) and was 172 times greater in Chongqing. This pattern made the spatial distribution discrete. As the distribution became less oblate, the directionality became more significant. Specifically, the azimuth angle changed from 99°counterclockwise in 1995 to 80.9° in 2015, indicating that the ADP spatial distribution from metal initially exhibited a north-south pattern. With the substantial increase in metal extraction in Inner Mongolia and decrease in Qinghai, the spatial distribution of ADP began to show a northeast-southwest pattern.
Indeed, the range of the ellipse was relatively small (). That is, the spatial distribution of RI and GWP affected by metal extraction was stable. The extension of the major axis and the contraction of the minor axis of RI and GWP indicate that the environmental impacts on the northeast-southwest axis increased more rapidly than that for the northwest-southeast axis. The expansion of the space of the ellipse indicated that the provinces outside of the distribution ellipse grew faster than those inside the distribution ellipse, thereby making their spatial distributions more discrete. For example, RI was primarily concentrated in Tibet, Sichuan and Heilongjiang and showed maximum increases of 291 and 11 times in 2015 compared with 1995. GWP increased mainly in Tibet, Heilongjiang, and Xinjiang, with 361, 18 and 10 times greater values in 2015 relative to 1995, respectively. The SDE became less oblate, indicating that the northeast-southwest direction was more important. The azimuth angles of these two types of environmental impacts changed in a clockwise direction, indicating that the southeast region had an increasing influence on the distribution and orientation of changes in RI and GWP.
Spatial analysis of the per capita environmental impacts of nonmetallic minerals
All of the high per-capita DE areas for nonmetallic minerals were concentrated in the southeastern coast, where infrastructure construction has increased considerably (). In addition, these areas tend to be more developed and the urbanization rate higher compared with the rest of China. By contrast, regions in the West and North had much lower levels of infrastructure construction and were still relatively underdeveloped with low levels of urbanization. High per capita RI and GWP were primarily distributed in the northern regions. High per capita ADP was primarily distributed in marginal provinces of the map. Per capita nonmetallic extraction in China’s provinces has increased significantly from 1995 to 2015. Hebei, Inner Mongolia and Liaoning had higher per capita RI and GWP, while ADP in Hunan and Tibet showed significant increases from 1995 to 2015.
Based on the SDE, the average centers of DE and RI moved southwest, indicating that nonmetallic extraction and RI increased rapidly in the southwest regions. The average center of ADP moved northeast, indicating that there has been rapid growth in nonmetallic extraction in the northeast. The center of gravity of GWP moved northward, indicating that the GWP in the north is growing rapidly. The extension of the major axis for DE and the contraction of its minor axis indicated that the growth rate of the major axis DE was more rapid than that of the minor axis. The spatial contraction of the ellipse showed that the increase in DE was more pronounced in the central area compared with external areas, such as Jiangxi, Hubei, and Hunan, which increased by twelve, eight and seven times, respectively, from 1995 to 2015. The azimuth angle changed in a clockwise direction from 75° in 1995 to 89° in 2015, indicating that the southeast region had an increasing influence on the distribution and orientation of DE changes. The distribution in DE became less oblate, indicating that the directionality of the distribution became more significant.
Figure 5. Spatial analysis of the per capita environmental impacts of nonmetallic mineral extraction in China. (a) The per capita environmental impacts of nonmetallic mineral extraction in 1995; (b) The per capita environmental impacts of nonmetallic mineral extraction in 2015. Note: Detailed results of spatial analysis are shown in Table S4
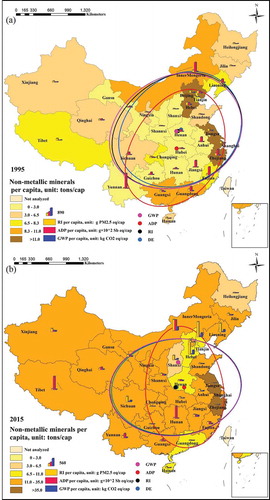
The major and minor axes of ADP were reduced, and the distribution of ADP became more oblate. Thus, the directionality of the ADP distribution was not clear, and the aggregation trend in the major axis direction became more significant. For example, Hainan, Chongqing and Hunan increased the most, by 18, 13 and 4 times, respectively, between 1995 and 2015. The azimuth angle rotated counterclockwise from 49.8° in 1995 to 0.05° in 2015, indicating that the northeast region had a greater orientation and influence on ADP. Both the major and minor axes of RI and GWP shortened, and their distributions became less oblate. The directionality of their spatial distributions became more significant. Thus, the aggregation trend in the direction of the minor axis also became more significant. For example, RI primarily increased in Jiangxi, Hubei and Shaanxi. GWP growth was primarily concentrated in Jiangxi, Hubei and Shaanxi, which showed the largest increases. The azimuth angles of these two types of environmental impact changed in a clockwise direction, indicating that the southeast regions had an increasing influence on the distribution and orientation of RI and GWP.
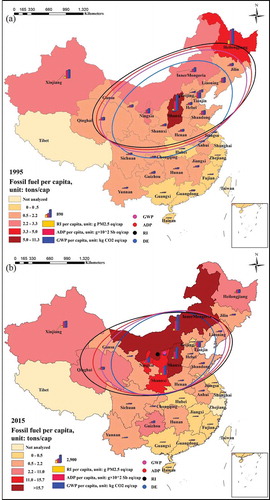
Spatial analysis of per capita environmental impacts of fossil fuels
The map of fossil fuel extraction showed a concentration of reserves and extraction activity in the northern portion of the country, which is China’s main coal-producing area (). The main fossil fuel that China extracts is coal (Tian et al. Citation2012), as it accounts for approximately 90% of total fossil fuel extraction. The high environmental impacts of fossil fuel extraction were also concentrated in the North. During the study period, the center of gravity of DE moved northwest, and the center of gravity of RI, ADP and GWP moved southwest, indicating that the extraction of fossil fuels in the northwest regions, as well as the environmental impacts in the southwest regions, have intensified.
The major and minor axes of DE decreased, and the spatial contraction of the ellipse indicated that DE had a greater increase in central rather than in peripheral areas. The azimuth angle changed in a clockwise direction from 73.9° in 1995 to 79.1° in 2015, indicating that the southeast regions, especially Hainan, experienced an increasing influence on the distribution and orientation of DE. The distribution became slightly more oblate, but the value stayed under 0.57, indicating that the directionality of its spatial distribution remained stable. Both the major and minor axes of RI, ADP and GWP reduced, and the spatial contraction of the ellipse indicated that compared with the outer region, increases in the environmental impacts were more pronounced in the central region. The azimuth angle changed in a clockwise direction, indicating that the southeast region, especially Hainan, had an increasing influence on the distribution and orientation of environmental impacts. The distribution became slightly more oblate, but the value stayed under 0.44, indicating that the directionality of its spatial distribution remained significant.
Figure 6. Spatial analysis of the per capita environmental impact of fossil fuel extraction in China. (a) The per capita environmental impacts of fossil fuel extraction in 1995; (b) The per capita environmental impacts of fossil fuel extraction in 2015. Note: Detailed results of spatial analysis are shown in Table S5
Discussion
In this study, we used the MFA method and LCA coefficients to characterize the environmental impacts (RI, ADP and GWP) of resource extraction in China at the provincial scale from 1995 to 2015 and the average center and SDE methods for spatial analysis. We explored temporal and spatial changes in environmental impacts caused by resource extraction in Chinese provinces. We also determined which resources were extracted at high concentrations and which produced potentially unsafe environmental impacts. Thus, the results of this research allow China’s provinces to take the next step in combating environmental pollution induced by resource extraction. Given that RI is primarily caused by metal and nonmetallic minerals, ADP by metal and GWP by fossil fuels, our study was focused on the most important resources and their environmental impacts.
In terms of RI, PM2.5 not only induces smoke formation, which reduces visibility, but also adversely affects human physical and mental health. The materials that cause most RI are nonmetallic minerals. In addition, the RI generated by resource extraction in China are mainly produced by metal extraction in Hebei as well as by nonmetallic minerals extraction in Zhejiang, Jiangsu, Shandong and Sichuan. Specifically, metal and nonmetallic mineral extraction are more prevalent in Sichuan. Several reasons explain this pattern. First, these regions are richer in natural resources relative to other regions in China. Second, infrastructure construction in these regions utilizes high quantities of locally extracted iron, sand and gravel. Third, these materials produce large quantities of RI.
Our research has shown that the center of gravity of total resources moved southwest, while that of metals moved northwest from 1995 to 2015. These shifts primarily stem from the acceleration in the development of the central and western regions in the context of China’s four “five-year plans” over the past two decades. The focus of manufacturing has gradually shifted from the southeastern coastal region to the central and western regions (Wang et al. Citation2019a). Our results indicate that the environmental impacts of nonmetallic minerals and fossil fuel extraction in the Southwest is increasing. Indeed, the RI ellipse space shrank. That is, the distribution of environmental impacts has become increasingly concentrated, and areas within the SDE are key provinces for RI. Therefore, efforts to control environmental impacts should be directed toward the center of gravity areas.
However, the SDE for metal only showed slight increases, primarily from the large increases in Tibet and Sichuan. Additionally, the environmental impacts of Sichuan’s metal are high, and the growth rate has been increasing in recent years. Compared with Sichuan, Tibet is China’s mineral resource reserve base. Although its environmental impacts have increased significantly, its level of RI is low. Given the growing development of the tourism industry, the market environment in Tibet is also constantly improving, and large mining companies have begun to enter Tibet. The mining industry has gradually become the major engine underlying Tibet’s economic development. However, because of the currently fragile ecological environment in Tibet, the cost of development is high, and the geomorphology caused by the extraction of materials has also led to an ecological and environmental crisis. Therefore, there is an urgent need for improvements in exploration and extraction technology in Tibet. The SDE of nonmetallic minerals stems from the large increase in Jiangxi, Hubei and Shaanxi, which has led to their shrinkage. The production of RI in Hubei has experienced greatly in Hubei, and RI are currently produced in large amounts. Relative to Hubei, Jiangxi and Shaanxi have experienced large increases in RI, but the production of RI has still not attained high levels. Jiangxi has abundant nonmetallic mineral resources. However, compared to metal minerals, the level of development is still low, and many minerals are in the trial mining stage. Our findings suggest that there is a need to increase exploration efforts and improve extraction technology.
The center of gravity of ADP has shifted to the Northwest, and the provinces that have caused the most changes in ADP were Tibet, Inner Mongolia and Chongqing. These provinces have extracted some materials that have caused increases in ADP in recent years, which has led to more widespread scarcity of materials in these provinces and has driven the center of gravity to the Northwest. Antimony ore is one of the materials that causes the most pronounced increases in ADP in China, especially in Hunan, Yunnan and Tibet (Zhao et al. X). The expansion of the ADP ellipse space indicates that there is a discrete trend in the distribution of environmental impacts. Therefore, provinces with high levels of environmental impacts and high growth rates, such as Hunan, Yunnan and Tibet, should consider alternative materials or expand materials imports. Our results have also shown that the directionality of the spatial distribution of metal ADP has become increasingly significant. Policies should target the northeast-southwest axis to control the increasing environmental impacts.
The GWP generated by resource extraction in China is primarily caused by fossil fuels in Shanxi, Inner Mongolia, Heilongjiang, Shaanxi and Shandong. The center of gravity of GWP has begun to move westward, primarily due to the migration of the center of gravity of GWP caused by the extraction of fossil fuels in the West in recent years. In addition, the SDE showed that its spatial distribution exhibited an aggregate trend from 1995 to 2015. These areas are rich in fossil fuels. GWP generated from resource extraction was also concentrated within the SDE. Additional extraction is inevitable for supporting the continued development of the economy. Therefore, there is an urgent need to strengthen the control and governance of environmental impacts inside the ellipse.
In short, the distribution of environmental impacts of resource extraction is different in Chinese regions, and the spatial distribution is dominated by northeast – southwest. The environmental impacts of the east are relatively higher, showing the infiltration trend of “east-middle-west, north-middle-south.” Therefore, it is necessary to formulate differentiated environmental policies based on the characteristics of different regions (Xue, Xiao, and Li Citation2020). For example, provinces such as Tibet and Inner Mongolia have relatively low levels of economic development, but their environmental impacts have grown rapidly, and the government and the public have paid less attention and investment in environmental governance. These areas may have potential risk of environmental degradation. In order to reduce the environmental impact caused by resource extraction and avoid repeating the route of “treatment after pollution” in developed areas, it is recommended to increase investment in mining technology and take a new path of tunneling through the “environmental mountain” (Lu, Wang, and Yue Citation2015).
For provinces with high level of economic development and decrease of environmental impacts, mainly in the eastern regions, it is necessary to prevent the transfer of environmental impacts to the underdeveloped western regions(Chen et al. Citation2018). Meanwhile, we should seize the strategic opportunity of regional coordinated development in the new era, share scientific and technological achievements with neighboring provinces through promoting of new mining technologies, improving the efficiency of resource extraction and utilization (Yu et al. Citation2017), and developing circular economy vigorously in order to reduce the exploitation of resources (Wang et al. Citation2020; Zhu et al. Citation2018).
Conclusions
To alleviate the severe problems associated with the environmental impacts of resource extraction in China, this study combined MFA and the LCA method to characterize the environmental impacts of the resource extraction process in 31 provinces from 1995 to 2015. Furthermore, we used two spatial analytical methods, average center and SDE, to explore the spatial distribution of and temporal changes in environmental impacts. The major findings are presented below.
During the study period, the center of gravity of ADP caused by total resource extraction changed the most rapidly and was closely related to the center of gravity of ADP caused by metal extraction. The center of gravity of GWP caused by total materials moved westward and was related to the shift in the center of gravity of GWP caused by fossil fuel extraction. In addition, the center of gravity of DE and RI caused by total resource extraction moved to the Southwest, while the center of gravity of DE and RI caused by metal extraction moved to the Northwest. The results also showed that most of the provinces distributed inside the ellipse are high-environmental impact provinces. These areas should take more responsibility for environmental impacts. The spatial distribution patterns of DE, RI and GWP induced by total resource extraction exhibited a centralized trend regardless of overall changes or changes in the main axis. Only the metal distribution was clearly discrete. The overall and main axis of ADP induced by total resource extraction increased significantly, which is in contrast to the shrinkage of the oval space of nonmetallic minerals and fossil fuels.
With the development of China’s economy, infrastructure construction and urbanization, China’s regional environmental impacts were unevenly distributed, and regional governments need to formulate targeted policies to reduce environmental impacts based on the actual conditions under the policy framework. The spatial distribution direction of environmental impacts are dominated by northeast-southwest, and the environmental impacts in the east are higher, showing the infiltration trend of “east-middle-west, north-middle-south.” It is necessary to formulate differentiated environmental policies based on the characteristics of different provinces. For regions with relatively low levels of economic development, but high environmental impacts, it is suggested to avoid repeating the route of “treatment after pollution” and increase investment in mining technology. For provinces with high level of economic development and decrease of environmental impacts, it is necessary to prevent the transfer of environmental impacts to the underdeveloped regions.
Acknowledgments
This research was supported by the National Natural Science Foundation of China (41871204, 41701627 and 41971255) and Fundamental Research Funds for the Central Universities (N172504026, N182502045). We appreciate the helpful feedback from the editor and anonymous reviewers.
Disclosure statement
No potential conflict of interest was reported by the authors.
Additional information
Funding
References
- Chen, B., J. S. Li, X. F. Wu, M. Y. Han, L. Zeng, Z. Li, and G. Q. Chen. 2018. “Global Energy Flows Embodied in International Trade: A Combination of Environmentally Extended Input-output Analysis and Complex Network Analysis.” Applied Energy 210: 98–16. doi:10.1016/j.apenergy.2017.10.113.
- Chen, L., S. Liang, M. Liu, Y. Yi, Z. Mi, Y. Zhang, Y. Li, et al. 2019. “Trans-provincial Health Impacts of Atmospheric Mercury Emissions in China.” Nature Communications 10 (1): 1484. doi:10.1038/s41467-019-09080-6.
- Chen, S., B. Chen, K. Feng, Z. Liu, N. Fromer, X. Tan, A. Alsaedi, et al. 2020. “Physical and Virtual Carbon Metabolism of Global Cities.” Nature Communications 11 (1): 182. doi:10.1038/s41467-019-13757-3.
- Chen, W. Q., and L. Shi. 2012. “Analysis of Aluminum Stocks and Flows in Mainland China from 1950 to 2009: Exploring the Dynamics Driving the Rapid Increase in China’s Aluminum Production.” Resources Conservation and Recycling 65: 18–28. doi:10.1016/j.resconrec.2012.05.003.
- Chen, W.-Q., and T. E. Graedel. 2015. “In-use Product Stocks Link Manufactured Capital to Natural Capital.” Proceedings of the National Academy of Sciences of the United States of America 112 (20): 6265–6270. doi:10.1073/pnas.1406866112.
- Chen, W.-Q., T. E. Graedel, P. Nuss, and H. Ohno. 2016. “Building the Material Flow Networks of Aluminum in the 2007 US Economy.” Environmental Science & Technology 50 (7): 3905–3912. doi:10.1021/acs.est.5b05095.
- Cui, G. X., Y. D. Yu, L. Zhou, and H. Y. Zhang. 2020. “Driving Forces for Carbon Emissions Changes in Beijing and the Role of Green Power.” Science of the Total Environment 728:138688.
- De Smith, M. J., M. F. Goodchild, and P. Longley. 2007. Geospatial Analysis: A Comprehensive Guide to Principles, Techniques and Software Tools. Leicester, UK: Troubador Publishing Ltd.
- Dente, S. M. R., C. Aoki-Suzuki, D. Tanaka, and S. Hashimoto. 2018. “Revealing the Life Cycle Greenhouse Gas Emissions of Materials: The Japanese Case.” Resources, Conservation and Recycling 133: 395–403. doi:10.1016/j.resconrec.2017.12.011.
- Ding, N., J. Liu, Z. Kong, L. Yan, and J. Yang. 2019. “Life Cycle Greenhouse Gas Emissions of Chinese Urban Household Consumption Based on Process Life Cycle Assessment: Exploring the Critical Influencing Factors.” Journal of Cleaner Production 210: 898–906. doi:10.1016/j.jclepro.2018.10.242.
- Editing Committee of China Energy Statistical Yearbook. 1996–2016. “China Energy Statistical Yearbooks 1996–2016.” Beijing.
- Eurostat. 2013. “Economy-Wide Material Flow Accounts (EW-MFA).” Compilation Guide 2013. Luxembourg: EUROSTAT Office.
- Eurostat. 2018. Economy-wide Material Flow Accounts Handbook - 2018 Edition. Luxemburg: Publications Office of the European Union.
- Fang, D., C. Duan, and B. Chen. 2020. “Average Propagation Length Analysis for Carbon Emissions in China.” Applied Energy 275: 115386. doi:10.1016/j.apenergy.2020.115386.
- Fang, D. L., B. Chen, K. Hubacek, R. J. Ni, L. L. Chen, K. S. Feng, and J. T. Lin. 2019. “Clean Air for Some: Unintended Spillover Effects of Regional Air Pollution Policies.” Science Advances 5 (4): 4. doi:10.1126/sciadv.aav4707.
- Federal Office for the Environment. 2018. “Environmental Footprints of Switzerland Developments from 1996 to 2005.”
- Fischer-Kowalski, M., F. Krausmann, S. Giljum, S. Lutter, A. Mayer, S. Bringezu, Y. Moriguchi, H. Schuetz, H. Schandl, and H. Weisz. 2011. “Methodology and Indicators of Economy-wide Material Flow Accounting.” Journal of Industrial Ecology 15 (6): 855–876. doi:10.1111/j.1530-9290.2011.00366.x.
- Frischknecht, R., N. Jungbluth, H.-J. Althaus, G. Doka, R. Dones, T. Heck, S. Hellweg, et al. 2004. “The Ecoinvent Database: Overview and Methodological Framework (7 Pp).” The International Journal of Life Cycle Assessment 10 (1): 3–9. doi:10.1065/lca2004.10.181.1.
- Guinee, J. B., M. Gorree, R. Heijungs, G. Huppes, R. Kleijn, and A. V. O. L. A. De Koning. 2001. “Handbook on Life Cycle Assessment - Operational Guide to the ISO Standards.” International Journal of Life Cycle Assessment 6 (5): 255. doi:10.1007/BF02978784.
- Haberl, H., D. Wiedenhofer, S. Pauliuk, F. Krausmann, D. B. Müller, and M. Fischer-Kowalski. 2019. “Contributions of Sociometabolic Research to Sustainability Science.” Nature Sustainability 2 (3): 173–184. doi:10.1038/s41893-019-0225-2.
- Hao, M., P. Wang, L. Song, M. Dai, Y. Ren, and W.-Q. Chen. 2020. “Spatial Distribution of Copper In-use Stocks and Flows in China: 1978–2016.” Journal of Cleaner Production 261: 121260. doi:10.1016/j.jclepro.2020.121260.
- IKE. 2017. China Life Cycle Assessment Database (CLCD) and online LCA system (www.efootprint.net).
- Jolliet, O., M. Margni, R. Charles, S. Humbert, J. Payet, and G. Rebitzer. 2003. “IMPACT 2002+:A New Life Cycle IMPACT Assessment Methodology.” International Journal of Life Cycle Assessment 8, 6, a.R.K.R., 324–330. doi:10.1007/BF02978505
- Kai Fang, Q. Z., Y. Long, Y. Yoshida, L. Sun, H. Zhang, Y. Dou, and S. Li. 2019. “How Can China Achieve Its Intended Nationally Determined Contributions by 2030? A Multi-criteria Allocation of China’s Carbon Emission Allowance.” Applied Energy 241 (2019): 380–389. doi:10.1016/j.apenergy.2019.03.055.
- Krausmann, F., S. Gingrich, N. Eisenmenger, K.-H. Erb, H. Haberl, and M. Fischer-Kowalski. 2009. “Growth in Global Materials Use, GDP and Population during the 20th Century.” Ecological Economics 68 (10): 2696–2705. doi:10.1016/j.ecolecon.2009.05.007.
- Lee, J., and D. W. Wong. 2001. Statistical Analysis with ArcView GIS. Hoboken, NJ, USA:John Wiley & Sons.
- Levine, N. 2004. CrimeStat III: A Spatial Statistics Program for the Analysis of Crime Incident Locations (Version 3.0). Houston, TX: Ned Levine & Associates.
- Liang, S., Z. Liu, D. Crawford-Brown, Y. Wang, and M. Xu. 2014. “Decoupling Analysis and Socioeconomic Drivers of Environmental Pressure in China.” Environmental Science & Technology 48 (2): 1103–1113. doi:10.1021/es4042429.
- Lin, C., J. Qi, S. Liang, C. Feng, T. O. Wiedmann, Y. Liao, X. Yang, Y. Li, Z. Mi, and Z. Yang. 2020. “Saving Less in China Facilitates Global CO2 Mitigation.” Nature Communications 11 (1): 1358. doi:10.1038/s41467-020-15175-2.
- Liu, G.-X., M. Wu, F.-R. Jia, Q. Yue, and H.-M. Wang. 2019a. “Material Flow Analysis and Spatial Pattern Analysis of Petroleum Products Consumption and Petroleum-related CO2 Emissions in China during 1995–2017.” Journal Clean Production 209,40–52
- Liu, G.-X., M. Wu, F.-R. Jia, Q. Yue, and H.-M. Wang. 2019b. “Material Flow and Spatial Data Analysis of the Petroleum Use to Carbon Dioxide (CO2) Emissions in Northeast China.” Journal Industrial Ecology 23(4), 823–837
- Liu, X., H. Qin, and P. Hou. 2010. “Research on the Establishment Method of China Life Cycle Basic Database.” Science & Technology Information 3: 7.
- Liu, X., H. Wang, and J. Chen. 2010. “Method and Basic Model for Development of Chinese Reference Life Cycle Database of Fundamental Industries.” Acta Scientiae Circumstantiae 30 (10): 2136–2144.
- Lu, Y., A. Jenkins, R. C. Ferrier, M. Bailey, I. J. Gordon, S. Song, J. Huang, et al. 2015. “Addressing China’s Grand Challenge of Achieving Food Security while Ensuring Environmental Sustainability.” Science Advances 1 (1): 1. doi:10.1126/sciadv.1400039.
- Lu, Z. W., H. M. Wang, and Q. Yue. 2015. “Decoupling Analysis of the Environmental Mountainwith Case Studies from China.” Journal of Industrial Ecology 19 (6): 1082–1090. doi:10.1111/jiec.12226.
- Ma, F., H. Wang, B. Zhu, D. Chen, H. Dai, J. Wang, S. Zhao, et al. 2018. “Material Footprint of a Fast-industrializing Region in China, Part 1: Exploring the Materialization Process of Liaoning Province.” Resources, Conservation and Recycling 134: 228–238. doi:10.1016/j.resconrec.2018.03.015.
- Miao, Z., X. D. Chen, T. Balezentis, and C. W. Sun. 2019. “Atmospheric Environmental Productivity across the Provinces of China: Joint Decomposition of Range Adjusted Measure and Luenberger Productivity Indicator.” Energy Policy 132: 665–677. doi:10.1016/j.enpol.2019.06.019.
- Ministry of Land and Resources of China. 2000–2016. China Land and Resources Statistical Yearbooks 1999–2016. Beijing: China Geology Press.
- Peng, J., S. Chen, H. Lü, Y. Liu, and J. Wu. 2016. “Spatiotemporal Patterns of Remotely Sensed PM 2.5 Concentration in China from 1999 to 2011.” Remote Sensing of Environment 174: 109–121. doi:10.1016/j.rse.2015.12.008.
- Qi, J., Y. Wang, S. Liang, Y. Li, Y. Li, C. Feng, L. Xu, et al. 2019. “Primary Suppliers Driving Atmospheric Mercury Emissions through Global Supply Chains.” One Earth 1 (2): 254–266. doi:10.1016/j.oneear.2019.10.005.
- Schandl, H., M. Fischer-Kowalski, J. West, S. Giljum, M. Dittrich, N. Eisenmenger, A. Geschke, et al. 2018. “Global Material Flows and Resource Productivity: Forty Years of Evidence.” Journal of Industrial Ecology 22 (4): 827–838. doi:10.1111/jiec.12626.
- Scott, L. M., and M. V. Janikas. 2010. Spatial Statistics in ArcGIS, In Handbook of Applied Spatial Analysis: Software tools, methods and applications. Heidelberg. Germany: Springer Science & Business Media.
- Shi, Y., T. Matsunaga, Y. Yamaguchi, Z. Li, X. Gu, and X. Chen. 2018. “Long-term Trends and Spatial Patterns of Satellite-retrieved PM2.5 Concentrations in South and Southeast Asia from 1999 to 2014.” Science of the Total Environment 615: 177–186. doi:10.1016/j.scitotenv.2017.09.241.
- Song, L., P. Wang, M. Hao, M. Dai, K. Xiang, N. Li, and W.-Q. Chen. 2020. “Mapping Provincial Steel Stocks and Flows in China: 1978–2050.” Journal of Cleaner Production 262: 121393. doi:10.1016/j.jclepro.2020.121393.
- Sun, W. Q., Y. Zhou, J. X. Lv, and J. Z. Wu. 2019. “Assessment of Multi-air Emissions: Case of Particulate Matter (Dust), SO2, NOx and CO2 from Iron and Steel Industry of China.” Journal of Cleaner Production 232: 350–358. doi:10.1016/j.jclepro.2019.05.400.
- Tian, X., M. Chang, H. Tanikawa, F. Shi, and H. Imura. 2012. “Regional Disparity in Carbon Dioxide Emissions: Assessing Sectoral Impacts on the Carbon Dioxide Emissions Structure among Regions of Mainland China.” Journal of Industrial Ecology 16 (4): 612–622. doi:10.1111/j.1530-9290.2012.00514.x.
- UNEP-IRP. 2019. Global Resource Outlook 2019: Natural Resources for the Future We Want. A Report of the International Resource Panel United Nations Environment Programme.Edited by B. Oberle, S. Bringezu, S. Hatfeld-Dodds, S. Hellweg, H. Schandl, J. Clement, L. Cabernard, et al. Nairobi, Kenya: UNEP.
- van der Voet, E., L. van Oers, and N. Igor. 2005. “Dematerialization: Not Just a Matter of Weight.” Journal of Industrial Ecology 8 (4): 121–137. doi:10.1162/1088198043630432.
- van Oers, L., and J. Guinée. 2016. “The Abiotic Depletion Potential: Background.” Updates, and Future. Resources 5 (1): 16.
- van Oers, L., J. B. Guinée, and R. Heijungs. 2020. “Abiotic Resource Depletion Potentials (Adps) for Elements Revisited—updating Ultimate Reserve Estimates and Introducing Time Series for Production Data.” The International Journal of Life Cycle Assessment 25 (2): 294–308. doi:10.1007/s11367-019-01683-x.
- Wang, H., G. Wang, J. Qi, H. Schandl, Y. Li, C. Feng, X. Yang, Y. Wang, X. Wang, and S. Liang. 2019b. “Scarcity-weighted Fossil Fuel Footprint of China at the Provincial Level.” Applied Energy 258 (2020): 114081.
- Wang, H., H. Dai, L. Dong, Y. Xie, Y. Geng, Q. Yue, F. Ma, J. Wang, and T. Du. 2018. “Co-benefit of Carbon Mitigation on Resource Use in China.” Journal of Cleaner Production 174: 1096–1113. doi:10.1016/j.jclepro.2017.11.070.
- Wang, H., H. Schandl, G. Wang, L. Ma, and Y. Wang. 2019a. “Regional Material Flow Accounts for China: Examining China’s Natural Resource Use at the Provincial and National Level.” Journal of Industrial Ecology 23 (6): 1425–1438. doi:10.1111/jiec.12933.
- Wang, H., H. Schandl, X. Wang, F. Ma, Q. Yue, G. Wang, Y. Wang, Y. Wei, Z. Zhang, and R. Zheng. 2020. “Measuring Progress of China’s Circular Economy.” Resources, Conservation and Recycling 163: 105070. doi:10.1016/j.resconrec.2020.105070.
- Wang, H., S. Hashimoto, Y. Moriguchi, Q. Yue, and Z. Lu. 2012. “Resource Use in Growing China.” Journal of Industrial Ecology 16 (4): 481–492. doi:10.1111/j.1530-9290.2012.00484.x.
- Wong, W. S. D., and J. L. 2005. Statistical Analysis of Geographic Information with ArcView GIS and ArcGIS. Hoboken, NJ: Wiley.
- Xue, B., X. Xiao, and J. Li. 2020. Identification Method and Empirical Study of Urban Industrial Spatial Relationship Based on POI Big Data: A Case of Shenyang City, China. Geography and Sustainability 1(2),152-162. doi:10.1016/j.geosus.2020.06.003
- Yang, D., J. Liu, J. Yang, and N. Ding. 2015. “Life-cycle Assessment of China’s Multi-crystalline Silicon Photovoltaic Modules considering International Trade.” Journal of Cleaner Production 94: 35–45. doi:10.1016/j.jclepro.2015.02.003.
- Yang, S. Y., B. Chen, M. Wakeel, T. Hayat, A. Alsaedi, and B. Ahmad. 2018. “PM2.5 Footprint of Household Energy Consumption.” Applied Energy 227: 375–383. doi:10.1016/j.apenergy.2017.11.048.
- Yu, Y., D. Chen, S. Hu, A. Kharrazi, and B. Zhu. 2017. “Advancing Factors Influencing Resource Productivity through the Use of the Material Utility Framework.” Journal of Cleaner Production 142: 1892–1900. doi:10.1016/j.jclepro.2016.11.096.
- Zhang, L., J. M. Yang, Z. J. Cai, and Z. W. Yuan. 2015. “Understanding the Spatial and Temporal Patterns of Copper In-Use Stocks in China.” Environmental Science & Technology 49 (11): 6430–6437. doi:10.1021/acs.est.5b00917.
- Zhang, Y., L. L. Xia, B. D. Fath, Z. F. Yang, X. N. Yin, M. R. Su, G. Y. Liu, and Y. X. Li. 2016. “Development of a Spatially Explicit Network Model of Urban Metabolism and Analysis of the Distribution of Ecological Relationships: Case Study of Beijing, China.” Journal of Cleaner Production 112: 4304–4317. doi:10.1016/j.jclepro.2015.06.052.
- Zhao, S., H.-M. Wang, W.-Q. Chen, D. Yang, J.-R. Liu, and F. Shi. 2019. “Environmental Impacts of Domestic Resource Extraction in China.” Ecosystem Health and Sustainability 5 (1): 67–78. doi:10.1080/20964129.2019.1577703.
- Zhu, J., C. Fan, H. Shi, and L. Shi. 2018. “Efforts for A Circular Economy in China: A Comprehensive Review of Policies.” Journal Industrial Ecology 23 (1): 110-118.