
 ?Mathematical formulae have been encoded as MathML and are displayed in this HTML version using MathJax in order to improve their display. Uncheck the box to turn MathJax off. This feature requires Javascript. Click on a formula to zoom.
ABSTRACT
Improving the wheat yield of countries along the Belt and Road (BR) plays a core role in ensuring global food security. However, little attention has been paid to the wheat yield variation and the determinants across these countries. This paper analyzes wheat yield convergence in countries along the BR using the club-convergence test. The empirical results show that instead of one convergence for all countries along the BR, the wheat yields are converging into three clubs. Furthermore, we investigate the impact of climate change and agricultural production technology on wheat yield convergence, and find that countries along the BR with a one degree Celsius increase in temperature are 36.5% (32.7%) more likely to converge to the high-level yield club. This may be related to the lower frequency of frost and higher photosynthetic capacity of wheat. We also find that a one kilogram increase in fertilizer application per hectare will result in a 0.4% (0.5%) higher probability of countries along the BR converging to the high-level yield club. Countries along the BR should pay more attention to coordinating production technologies and climate change to ensure food security.
Introduction
The global food system is under pressure to ensure food security in the face of global warming. The global temperature rose by 0.85 degrees Celsius from 1880 to 2012 (IPCC, Citation2014). It is virtually certain that there will be more frequent hot and fewer cold temperature extremes over most land areas at both daily and seasonal timescales, and leading major crop yields are likely to suffer significant reductions by 2100 as the global mean surface temperature increases (Mbow et al. Citation2019). However, the FAO (Citation2016) predicted that by 2050, driven by urbanization, rising incomes, and growing population, consumers will need 60% more agricultural products than were produced in 2006. Moreover, in recent years, increases in crop production have either slowed down or even stagnated in many European countries that contribute significantly to the supply of agricultural products and are also big exporting countries (Brisson et al. Citation2010; Ray et al. Citation2012). Thus, the need to improve global grain production is urgent, and much of the increase may rely on regions with growth potential.
Wheat is the main staple food of 2.5 billion people in 89 countries (CGIAR, Citation2019). In low- and middle-income countries, wheat has superseded rice and maize as the most important source of protein and is second only to rice as a source of calories (CGIAR(Consultative Group for International Agricultural Research) Citation2019). The regions along the Belt and Road constitute the world’s major wheat-producing basin by using 55.9% of the world’s harvested areas to produce 65.3% of the global production (FAO Citation2017). Consequently, improvement of wheat production in countries along the BR has become increasingly important for ensuring food security in the world.
Both cropping area expansion and yield improvement could increase wheat production. Besides the high cost of ecological destruction, allocating new land for growing wheat seems impractical given the continuing decline of area suitable for grain production due to urbanization and industrialization (Balmford, Green, and Scharlemann Citation2005; You et al. Citation2009; Godfray et al. Citation2010; Chen, Fang, and Gao Citation2010; Alexandratos and Bruinsma Citation2012; Tian and Yu Citation2019). Therefore, improving the wheat yield on existing agricultural lands is of high priority under global warming (Brown Citation2001; Alexandratos and Bruinsma Citation2012).
The grain yield is originally determined by both the endowment of agricultural natural resources and agricultural production technology (You et al. Citation2009; You Citation2012; Chen, Huang, and Qiao Citation2013; Zhou and Turvey Citation2014; Chen, Chen, and Chen Citation2016; Zhang, Zhang, and Chen Citation2017; McArthur and McCord Citation2017). The endowment of agricultural natural resources includes climate, the characteristics of farmland and water, and geographical location. Improved seeds, chemical fertilizer, and pesticides, in addition to investment in irrigation are technological approaches that are used widely used all over the world (Zhang et al. Citation2017; Zhou, Tang, and Yu Citation2018; Zhang et al. Citation2019a; Zhang, Qing, and Yu Citation2019).
Climate change is the most important, albeit uncontrolled, factor that affects grain yield (You et al. Citation2009; Chen, Chen, and Chen Citation2016; Holst, Yu, and Gruen Citation2013; Zhang, Yu, and You Citation2020c). Climate change has different effects on wheat yield in different regions (Ray et al. Citation2015). Compared with other climatic factors such as precipitation, changes in temperature will be the stronger factor for most countries along the BR, especially in Central Asia (Lioubimtseva and Henebry Citation2009). The effects of rising temperature on wheat yield can be divided into two aspects: positive and negative. On the positive side, rising temperature may increase wheat yield because of the lower frequency of frost and higher photosynthetic capacity (Sommer et al. Citation2013; Zhou and Turvey Citation2014; Fan et al. Citation2015). By studying winter wheat, facultative wheat, and spring wheat in Central Asia, Sommer et al. (Citation2013) claimed that higher temperatures during spring may boost early growth of winter wheat, lower the risk of severe/late frost damage, and, thus, increase yield. After conducting field experiments in the Yangtze River Basin of China in 2012–2014, Fan et al. (Citation2015) pointed out that higher temperatures on winter nights promotes pre-anthesis wheat growth and leaf development and also improves post-anthesis photosynthetic capacity, eventually resulting in higher wheat yield. The negative effects include both direct effects and indirect effects. The direct effects are high temperature leading to a shorter growing period (Lobell and Asner Citation2003; Asseng, Ewert, and Martre Citation2015) and causing heat stress during the grain filling stage (Dubey et al. Citation2020), which will reduce the wheat yield. The indirect effects include higher frequency of droughts (Reilly et al. Citation2003; Mahmood et al. Citation2019) and greater incidence of pests because warming may accelerate the evaporation of agrarian moisture and allow pests to survive during winter (Liu et al. Citation2010). Porter and Gawith (Citation1999) found that temperatures during early spike development reduced wheat yield, as calculated from either the number of spikelets per head or the number of seeds per spikelet (Johnson and Kanemasu Citation1983).
The adoption of modern agricultural production technology has contributed to dramatic increases in grain yield all over the world (Rosegrant and Cline Citation2003). Alston (Citation2002) reported that technological progress in agricultural production accounts for at least half of the growth in the grain yield. Without effective adaptation and genetic improvement, each degree-Celsius increase in global mean temperature would reduce global yields of wheat by 6.0%, on average (Zhang et al. Citation2017). Chemical fertilizer is an important technological measure to offset the impact of natural conditions on the agricultural production process (HU, ZHANG, and ZHOU Citation2019). The Green Revolution improved grain yields by 126% from 1950 to 1980, and approximately 40–60% of the increase is attributed to the application of fertilizer (FAO, 1961–2003). According to IPCC (2019) food supply per capita has increased more than 30% accompanied by greater use of nitrogen fertilizers (increase of about 800%) since 1961. Wilcox and Makowski (Citation2014) concluded through field experiments that the average contribution rate of soil fertility to the maximum wheat yield was 37.9%, with the remaining 62.1% coming from chemical fertilizer. Bandyopadhyay et al. (Citation2010) argued that the long-term use of a combination of organic and chemical fertilizers in wheat production could improve soil fertility and yield.
The wheat yield in countries along the BR has grown more rapidly than has that in the world in general. shows changes in the average wheat yield of countries along the BR and the world from 1992 to 2017. The growth rate of wheat yield in countries along the BR generally shows a more rapid upward trend, though the current average yield is lower than that of world average yield, indicating more growth potential (Taffesse, Dorosh, and Gemessa Citation2012). From 2010 to 2016, the average yield in countries along the BR increased by approximately 770hg annually, gradually narrowing the gap between the BR average yield and that of the world. In 2017, the average wheat yield in countries along the BR nearly caught up to the average yield in the world.
Wheat yields vary widely from country to country. shows the changes of wheat yield in countries along the BR. Egypt, China, and other European countries rank more highly in terms of wheat yield from 1992 to 2017. The countries with lower yield are more likely to be located in Southeast Asia, e.g., Thailand, Afghanistan, Nepal, and Bhutan. However, some Asian countries, such as Tajikistan, Iraq, and Uzbekistan have achieved a significant increase in wheat yield. This is particularly true for Uzbekistan, where wheat yield has increased by almost 168.3%.
Figure 1. Changes in average wheat yield per unit area of countries along the BR and the world from 1992 to 2017
Table 1. Changes and Rank of wheat yield in countries along the BR
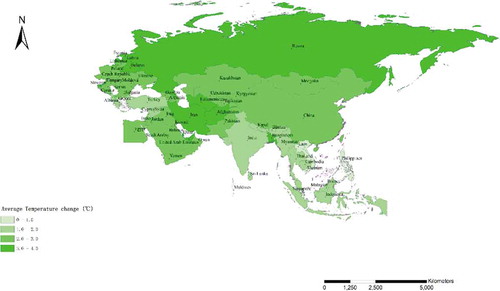
The natural conditions in countries along the BR differ markedly because of a large span of latitude and longitude. The BR runs through Asia, Central and Eastern Europe, and Africa (Egypt), with a variety of terrains and climate conditions, especially in terms of temperature. The average temperature has been increasing in countries along the BR. shows the average temperature for countries along the BR during 1992–2017. It is approximately 10 degree Celsius to 15 degree Celsius in the north, whereas other countries in the southern line are mostly in the tropics and subtropics, with an average temperature above 20 degree Celsius. shows the average temperature change for countries along BR from 1992 to 2017. During this time, the average temperature in BR regions rose by 0.899 degrees Celsius, with the average temperature change in the Northwest being higher than that in the Southeast. The increase in temperature may positively or negatively affect wheat yield, depending on the location. Meanwhile, countries along the BR are mostly developing countries (except for countries in the European region) and agricultural technology is backward. Countries along the BR have 64% of the world’s population but only 30% of its GDP (Huang Citation2016; Yang, Guo, and Xiao Citation2016), and shortage of fertilizers is a common problem, particularly in Asia, with, on average, a 10% gap in availability of nitrogen, a 30% gap in availability of phosphate, and a 90% gap in availability of potash between countries in Asia and other BR countries (Zhang et al. Citation2019b). Meanwhile China is one of the production centers of phosphate fertilizer and has sufficient capital for and talents in agriculture technological research. Since 2013, China has provided intensive agricultural technical assistance to the other countries along the BR through, for instance, the establishment of breeding centers and the export of fertilizers (Song Citation2014). Southeast Asia and South Asia have become the main export destinations of China’s fertilizer (Li Citation2016). Moreover, Gong (Citation2019) estimated the average bidirectional spillover effect between China and countries along the Belt and Road is more than 0.0362%, which was mainly originated from the technology diffusion such as fertilizer technology. Accompanying the cooperation between countries along the BR, the technology spillover effect may promote technological progress that might account for at least half of the growth in productivity (Alston Citation2002; You Citation2012).
Figure 2. Average temperature for Countries along the BR during 1992–2017
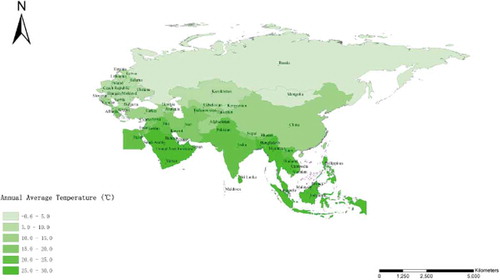
Figure 3. Average Temperature Change for Countries along the BR during 1992–2017
The wheat yield is the result of interaction between natural and technical factors. Temperature change and intensity of fertilizer use exert centrifugal and centripetal force on yield convergence, respectively (You et al. Citation2009). Given the variability of wheat yields across temperature change and intensity of fertilizer use, does the wheat yield in countries along the BR converge? If not, does the wheat yield converge to several different clubs? What roles do temperature change and intensity of fertilizer use play in the wheat yield convergence?
This study contributes to the literature in two aspects: First, this paper aims at uncovering the wheat yield convergence of countries along the BR and investigating the impact of temperature change and intensity of chemical fertilizer use on the convergence. Although the resource endowments, ecological conditions, and resource conditions of the countries along the BR are different, it is interesting to investigate whether the spillover of agricultural technologies overcomes the natural conditions and leads to convergence of the wheat yields. This study is helpful in describing the status of wheat yield inequality and updating the climate policy of countries along the BR to cope with the warming world. The results will also provide some implications to close the yield gap to ensure food security for countries along the BR. Moreover, we employ the club-convergence test to examine the convergence of wheat yield in countries along the BR to avoid the disadvantages of the traditional convergence test.
The remainder of the paper is organized into the following sections. We first present a short discussion about convergence and an introduction to the club-convergence test developed by Phillips and Sul (Citation2007), followed by a brief introduction of the data used. Then, we report the empirical results of the convergence test and investigate the impacts of temperature change and intensity of fertilizer use on club convergence among countries along the BR. In the final section, we conclude with a summary and some policy implications.
Methodology and data
Methodology
Convergence has long been an important research topic in economic literature (Chen and Fleisher Citation1996; Lau Citation2010; Westerlund Citation2013). There are two different types of convergence: β-convergence and σ-convergence. The former refers directly to the process of catching-up, which means regions with low initial conditions grow faster than do those with high initial conditions (Tian, Yu, and Zhang Citation2016; Mankiw, Romer, and Weil Citation1992). Conversely, the latter refers to a reduction in the dispersion across economies over time (Phillips and Sul Citation2007; Quah Citation1993). Lichtenberg (Citation1994) proves that β-convergence is a necessary but not sufficient condition for σ-convergence. Both β-convergence and σ-convergence tests have been used widely in the literature for income inequality and productivity inequality (Tian et al. Citation2016; Tian and Yu Citation2019). However, there are some pitfalls in these traditional convergence test methods (Lichtenberg Citation1994; Phillips and Sul Citation2007; Tian et al. Citation2016). For the β-convergence test, the estimation of augmented Solow regression under transitional heterogeneity is biased and inconsistent because of the issues of omitted variables and endogeneity (Lichtenberg Citation1994). Conventional cointegration tests typically have low power to detect the asymptotic movement, because the existence of a unit root in the panel series does not necessarily lead to the divergence conclusion (Phillips and Sul Citation2009; Du Citation2017). Moreover, traditional analyses have usually overlooked the possible existence of convergence clubs of the panel because they divided all individuals into subgroups based on some prior information (for example, geographic location, institution).
Taking every single wheat-producing country along the BR as “individual,” we employ the log t test developed by Phillips and Sul (Citation2007) to investigate whether wheat yields converge in countries along the BR and to further identify whether they are converging into different clubs in the scenario that countries along the BR are not converging as a whole. This approach has the following merits: First, it accommodates heterogeneous agent behavior and evolution of that behavior. Second, the log t-test does not impose any particular assumptions concerning either trend stationarity or stochastic nonstationary; therefore, it is robust to the stationarity property of the series (Du Citation2017). Third, the log t-test may identify the convergence clubs based on statistical analysis, so we can get a more accurate convergence picture.
We employ the club-convergence test to examine the wheat yield convergence in countries along the BR, and our method can be described as follows:
The start point is decomposing the panel data, as
where is a single common factor whereas
is a time-varying factor-loading coefficient.
can be further expressed as a semi-parametric equation like (2):
The is fixed,
is
across
but weakly dependent over
, and the
is a slowly varying function, which is used to eliminate the variance increase with time. EquationEquation (2)
(2)
(2) ensures that
converges to
when
for all
. Thus, when
for all
, the null hypothesis of convergence can be characterized as the following model:
for with
where b is the coefficient of log t, r means the fraction of the time series, and the Monte Carlo experiments indicate that achieves a satisfactory performance (Phillips and Sul Citation2007, Citation2009). Phillips and Sul (Citation2007, Citation2009) further show that
and
is conveniently tested through the weak inequality null
. The time data used in regression start from
.
This method can not only examine the convergence of the sample population but also test whether the sample individuals converge on different subgroups under the circumstances that the sample population is divergent. We follow five steps in the empirical analysis:
(1) Observation Ordering
Rank all the wheat yields of countries along the BR according to their average value in the last period, where T is the total time, is the observation, and ω is the last fraction (e.g.,
or
) of the sample.
(2) Core group formation
Conduct the log t regression and find the first k. If the condition does not hold for the highest two individuals, then the highest individual can be dropped from the core group and we need to form the core group starting from the second highest individual. If the condition
is not satisfied for the first two individuals again, drop the highest one and attempt to form a core group beginning with the third highest individual. Repeat this procedure until
is satisfied. If there is no k satisfying
, we conclude that there are no convergence subgroups in the panel. If all tk are greater than −1.65, then
and there is only a single convergence club.
(3) The first convergence group formation
Form a complementary group G* with all the remaining individuals not included in the core group. Run the log t-test and calculate the test statistic after adding one individual from G* at each time to the core group. We set a critical value c and include the individual in the core group if
. After adding all individuals whose
, we conduct the log t-test for this whole group. If
greater than −1.65, the initial convergence club is obtained. If not, we should raise the critical value c and repeat step 3 until
.
(4) Recursion and stopping rule
Perform the log t-test for the rest of the individuals after the first convergence group is formed. If the test statistic is greater than −1.65, that means all the samples converge to two clubs. Otherwise, repeat steps 1 to 3 on these individuals. If there is no individual satisfying step 2, this indicates that all the remaining individuals are divergent. Perform the log t-test for all pairs of the subsequent initial clubs, and merge those clubs fulfilling the convergence hypothesis jointly.
Data
The data of the average temperature, temperature change, intensity of fertilizer use, and wheat yield in countries along the BR from 1992 to 2017 are collected from the FAO database. The list of countries along the BR comes from the Standard Information Platform Contributed by the Belt and Road Countries. Based on the work of Han et al. (Citation2018) and Yu et al. (Citation2020), there are 65 countries along the BR. Eight of these countries – Brunei Darussalam, Cambodia, Indonesia, Laos, Philippines, Qatar, Sri Lanka, and Vietnam – do not grow wheat. Czechoslovakia officially became the Czech Republic and the Slovak Republic on January 1, 1993. The wheat yield data for Singapore, Palestine, Bahrain, Maldives, Montenegro, Malaysia, and Macedonia are incomplete since 1992. Considering the data available in our research, we drop the data of the Czech Republic, Slovakia, Singapore, Palestine, Bahrain, Maldives, Montenegro, Malaysia, Macedonia, and other countries that do not grow wheat. The final dataset includes 48 countries. shows the results of the descriptive statistics. The average temperature in countries along the BR is 15.005 degrees Celsius. The average temperature change in countries along the BR is 0.899 degree Celsius, and the intensity of fertilizer use averages 69.559 kg per hectare. Meanwhile, the world average temperature change is 0.914 degree Celsius and the intensity of fertilizer use averages 63.678 kg per hectare, meaning that countries along the BR are less subject to natural interference and have more agricultural technical support than the world average.
Table 2. Data description
Empirical results
Wheat productivity convergence
We employ the Phillips and Sul (Citation2007) method to test the wheat yield convergence in countries along the BR. Before taking the log t regression test, we employ the Hadri (Citation2000) test to conduct a unit root test on panel data to identify whether the wheat yield in each region is stable. The null hypothesis of the Hadri test is that all panels are stationary, and the test results in show that the null hypothesis is rejected significantly at the 1% level, implying some panel data are non-stationary. Therefore, it is necessary to use to eliminate the effects of natural variance growth. We make,
as suggested by Phillips and Sul (Citation2007), in this paper.
Table 3. Unit root test results of wheat yield in countries along the BR
We first examine the population convergence, that is whether all countries’ wheat yields converge to the same equilibrium. presents the log t test result of population convergence. The t-statistic is −42.354, and is less than −1.65, implying that the null hypothesis of population convergence is rejected. Therefore, perhaps due to obvious differences in climate conditions, the wheat yield in the countries along the BR does not converge as a whole.
Table 4. Population Convergence Test for Wheat Yield in countries along the BR using Log t-test
However, Phillips and Sul (Citation2007) argued that rejection of population convergence does not necessarily mean that there is no convergence club in the population. It might be that converge to multiple clubs. It is possible either that the diffusion of agricultural technology, which is the main method for increasing the wheat yield, occurs only in specific regions, or that the geographic and climate conditions play important roles. Although the mechanism of forming a club is complicated, often unknown, and determined by many factors, the club convergence test determines clubs based on statistical methods rather than any artificial definition.
Figure 4. The distribution of club members in the countries along the BR
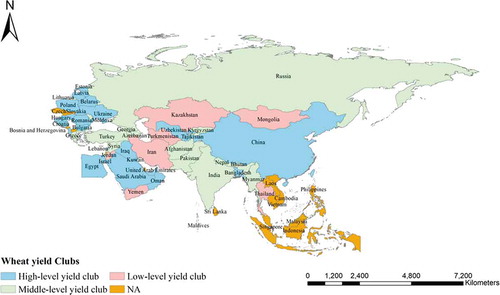
and display the grouping and distribution of club members, respectively. Based on the log t-test, the core group is comprised of Egypt and Saudi Arabia (Appendix 2). The results then indicate three convergence clubs for the wheat yield of countries along the BR. More specifically, nearly half of the countries (24 out of 48) converge into club one, with the highest wheat yield (high-level yield club). The high-level yield club includes 12 countries in Central and Eastern Europe, seven countries in western Asia, three countries in Central Asia, and two countries in Southeast Asia. Most of the members of the high-level yield club are located in more economically developed areas and have an above-average wheat yield. More than one-third of the countries (17 out of 48) converge into club two, with moderate wheat yield (middle-level yield club). The middle-level yield club consists of six Southeast Asian countries, five West Asian countries, one Central Asian country, and five Eastern European countries. The members of the middle-level yield club are concentrated mainly in Asia. Their climate is characterized as temperate continental ecosystem, and the wheat yield is slightly lower than the world level. Seven countries (Mongolia, Iran, Thailand, Turkmenistan, Jordan, Kazakhstan, and Yemen) converge into club three (low-level yield club), which has the lowest wheat yield. We also depict the trends of the average wheat yield among the three clubs in .
Figure 5. Changes in average wheat yield among three clubs from 1992 to 2017
Table 5. Convergence clubs for wheat yield in countries along the BR
The impacts of average temperature and temperature change on wheat yield convergence among the countries along the BR
Global warming, increased fertilizer usage, and technical changes could be major factors leading to changes in the wheat yield (Holst, Yu, and Gruen Citation2013; Zhou, Tang, and Yu Citation2018). Gao, Zhang, and Sun (Citation2018) indicated that the effect of temperature in different climatic zones is different during the wheat-growing period, implying that we can improve the wheat yield by finding the pattern between wheat yield and the temperature change. In this context, we further explore the determinants that lead to convergence at different equilibrium levels for different countries, to provide some sound implications for policymakers.
The dependent variable in this paper has three categories and is ordered, so we analyze the impacts of temperature change and intensity of fertilizer use on wheat yield convergence in countries along the BR by employing the ordered logit model. And we also report the results using an ordered probit model to conduct the robust check.
We make a comparison of the average temperature, the temperature change, and the intensity of fertilizer use among three clubs. The results in show significant differences among clubs. On average, the high-level yield club and the middle-level yield club have similar average temperatures, but the low-level yield club has a significantly lower average temperature. In addition, the average temperature changes for the three clubs are 1.042 degree Celsius, 0.792 degree Celsius, and 0.972 degree Celsius, respectively. More specifically, from 1992 to 2017, the temperature in Lithuania, which belongs to the high-level yield club, increased by 1.480 degree Celsius, whereas the temperature in Georgia, which belongs to the middle-level yield club, increased by 0.354 degree Celsius. The average intensities of fertilizer use in the three clubs are 98.902, 40.050, and 31.725 kg per hectare, respectively. The intensity of fertilizer use in Egypt, which belongs to the high-level yield club, is 368.329 kg per hectare, whereas the amount in Kazakhstan, which belongs to the low-level yield club, is only 1.601 kg per hectare.
Table 6. Comparison of variables among three clubs
The dependent variable is the status of wheat yield convergence of countries along the BR, which has three categories and is ordered. We use 1 for the high-level yield club, 2 for the middle-level yield club, and 3 for the low-level yield club. The regression results are reported in . Column (1) includes the linear term and square term of average temperature, in addition to temperature change (Holst, Yu, and Gruen Citation2013). Column (2) contains intensity of fertilizer use. Column (3) contains all of them in the model. In the ordered logit model, the coefficients of temperature change and fertilizer application are both statistically significant for wheat yield convergence. However, the linear term and square term of average temperature are not statistically significant. The results obtained by using an ordered probit model are consistent with those from using an ordered logit model.
Table 7. Results using both the ordered Logit and Probit models
However, the coefficients of both the ordered logit and ordered probit models reported in differ by a scale factor, and, thus, we cannot interpret the magnitude of the coefficients directly. We need to calculate the marginal effects further. The results are reported in and . Corresponding to the econometric results in the ordered logit/probit model, all of the marginal effects of temperature change and intensity of fertilizer use are statistically significant, which indicates that the rising temperature and increase in intensity of fertilizer use will result in the countries along the BR converging to the high yield club with higher probability.
Table 8. Marginal effects of the ordered Logistic model
Table 9. Marginal effects of the ordered Probit model
More specifically, the coefficients of temperature change are 0.365 in the ordered logit model and 0.327 in the ordered probit model for the high-level yield club, meaning that a one-degree Celsius increase in temperature is associated with a 32.7–36.5% increased likelihood of countries along the BR converging to the high-level yield club. The coefficients of temperature change are −0.220 in the ordered logit model and −0.176 in the ordered probit model for the middle-level yield club, indicating that a one- Celsius increase in temperature will result in the countries along the BR being 17.6–22.0% less likely of converging to the middle-level yield club. Similarly, a one-degree Celsius increase in temperature will result in a 14.5% (15.1%) lower probability of countries along the BR converging to the low-level yield club.
The result implies that the increase in average temperature has a positive effect on the wheat yields converging to the higher yield club. The result is consistent with that of Zhou and Turvey (Citation2014). This may be related to the increase in the effective-accumulated temperature and lower frequency of frost. In addition, the rising temperature may promote pre-anthesis wheat growth and leaf development and improve post-anthesis photosynthetic capacity, and thus lead to increased wheat yield (Fan et al. Citation2015). Wheat yields in countries such as Nepal and Bangladesh have risen by approximately 60% under global warming. One possible explanation is that the rising temperature increases the effective-accumulated temperature, and the warmer temperatures have accelerated the melting of Himalayan glaciers, providing more water for irrigation (He Citation2010).
The coefficients of intensity of fertilizer use indicate that a one-kilogram increase in fertilizer application per hectare is associated with a 0.4% increased likelihood of countries along the BR converging to the high-level yield club. Meanwhile, this will result in 0.3% and 0.2% lower probabilities of countries along the BR converging to the middle-level and low-level yield clubs, respectively. One possible explanation for this is that wheat growth requires the soil to have enough fertility (Zhang and Liu Citation2005). Combining these findings with the results reported in , we speculate that the low fertilizer inputs in the low-level yield club may be the main reason for the poor wheat yield.
In central and south Asian countries such as Tajikistan, Uzbekistan, and Iraq, the wheat yield increased by 200% on average compared with the average yield during 1992–1996, and it converged to countries with higher yields such as China and Egypt. This might be explained by the possible technology spillovers in the BR region. However, the yields in western Asian countries, such as Yemen, Jordan, and Turkmenistan, have not converged to a higher level club, implying that the technologies effectively improving the wheat yield either have not or cannot spread to those countries.
Conclusions and policy implication
Wheat is one of the most important grain crops in countries along the BR. The countries along the BR are major wheat-producing regions in the world.Footnote1 Closing the wheat yield gaps plays a core role in ensuring food security in countries along the BR. Under the combination of global warming and the effect of technological spillover, the wheat yield in countries along the BR is on the rise. What is the status of wheat yield inequality in countries along the BR? What roles do temperature change and intensity of fertilizer use play in the wheat yield inequality? A club convergence test indicated no wheat yield convergence in the whole BR region due to the different natural endowments, but we found three convergence clubs that could be explained partly by increasing temperature and intensity of fertilizer use.
We can conclude some policy implications from the results. Although the increase in temperature will result in a higher probability of countries along the BR converging to the high-level yield club, the governments along the BR should move climate policies forward to avoid the negative impacts of temperature on agriculture production. Moreover, countries along the BR should take full use of the cooperation between members that has been launched to promote agriculture technologies, such as fertilizer, pesticide, and enhanced seed for climate adaptation, to increase grain yield and ensure food security.
Disclosure statement
No potential conflict of interest was reported by the authors.
Additional information
Funding
Notes
1 The countries along the BR are among the major wheat-producing countries, but the US, Argentina, Canada, and European countries such as France or Germany are also very important. This paper focuses mainly on the countries along the BR.
References
- Alexandratos, N., and J. Bruinsma. 2012. “World Agriculture Towards 2030/2050: The 2012 Revision.” Rome: FAO. doi: 10.22004/ag.econ.288998.
- Alston, J. M. 2002. “Spillovers.” Australian Journal of Agricultural and Resource Economics 46 (3): 315–15.
- Asseng, S., F. Ewert, and P. Martre. 2015. “Rising Temperatures Reduce Global Wheat Production.” Nature Climate Change 5: 143–147. doi:10.1038/nclimate2470.
- Balmford, A., R. E. Green, and J. P. W. Scharlemann. 2005. “Sparing Land for Nature: Exploring the Potential Impact of Changes in Agricultural Yield on the Area Needed for Crop Production.” Global Change Biology 11: 1594–1605. doi:10.1111/j.1365-2486.2005.001035.x.
- Bandyopadhyay, P. K., S. Saha, P. K. Mani, and B. Mandal. 2010. “Effect of Organic Inputs on Aggregate Associated Organic Carbon Concentration under Long-term Rice-wheat Cropping System.” Geoderma 154 (3–4): 379–386. doi:10.1016/j.geoderma.2009.11.011.
- Brisson, N., P. Gate, D. Gouache, G. Charmet, F.-X. Oury, and F. Huard. 2010. “Why are Wheat Yields Stagnating in Europe? A Comprehensive Data Analysis for France.” Field Crops Research 119 (1): 201–212. doi:10.1016/j.fcr.2010.07.012.
- Brown, L. R. 2001. “Eradicating Hunger: A Growing Challenge”.World Watch Institute 43–62.
- CGIAR(Consultative Group for International Agricultural Research). 2019. “Wheat in the World. CGIAR Research Program on Wheat”.
- Chen, F., Q. Fang, and T. Gao. 2010. “Agricultural Policies, Food Production and Food Production Adjustment Ability.” Economic Research Journal 45(11):101–114. (In Chinese)
- Chen, J., and B. M. Fleisher. 1996. “Regional Income Inequality and Economic Growth in China.” Journal of Comparative Economics 22 (2): 141–164. doi:10.1006/jcec.1996.0015.
- Chen, R., J. Huang, and F. Qiao. 2013. “Farmers’ Knowledge on Pest Management and Pesticide Use in Bt Cotton Production in China.” China Economic Review 27: 15–24. doi:10.1016/j.chieco.2013.07.004.
- Chen, S., X. Chen, and J. Chen. 2016. “Impacts of Climate Change on Agriculture: Evidence from China.” Journal of Environmental Economics and Management 76: 105–124. doi:10.1016/j.jeem.2015.01.005.
- Du, K. 2017. “Econometric Convergence Test and Club Clustering Using Stata.” The Stata Journal 17 (4): 882–900. doi:10.1177/1536867X1701700407.
- Dubey, R., H. Pathak, B. Chakrabarti, S. Singh, D. K. Gupta, and R. C. Harit. 2020. “Impact of Terminal Heat Stress on Wheat Yield in India and Options for Adaptation.” Agricultural Systems 5: 181. doi:10.1016/j.agsy.2020.102826.
- Fan, Y., M. Tian, Q. Jing, Z. Tian, H. Han, D. Jiang, and T. Dai. 2015. “Winter Night Warming Improves Pre-anthesis Crop Growth and Post-anthesis Photosynthesis Involved in Grain Yield of Winter Wheat (Triticum Aestivum L.).” Field Crops Research 178: 100–108. doi:10.1016/j.fcr.2015.04.001.
- FAO (Food and Agriculture Organization). 2016. “Climate Change, Agriculture and Food Security. The State of Food and Agriculture 2016”. Rome: FAO.
- FAO (Food and Agriculture Organization). 2019. Food and Agriculture Organization of the United Nations. Food and Agriculture Data. Rome: FAO.
- FAO (Food and Agriculture Organization of the United Nations). 2017. FAOSTAT. http://www.fao.org/faostat/en/#data/QC
- Gao, M., X. Zhang, and Z. Sun. 2018. “Response of Wheat Yield and Duration of Development to Field Temperature Increase in Different Climatic Regions in China”. Scientia Agricultura Sinica 51: 386–400. (In Chinese).
- Godfray, H. C. J., J. R. Beddington, I. R. Crute, and L. Haddad. 2010. “Food Security: The Challenge of Feeding 9 Billion People.” Science 327:812–818. doi:10.1126/science.1185383.
- Gong, B. 2019. “The Approach for Realizing Agricultural Cooperation between China and Countries along the Belt and Road.” Chinese Rural Economy 10: 114–129. (In Chinese).
- Han, M., Q. Yao, W. Liu, and D. Michael. 2018. “Tracking Embodied Carbon Flows in the Belt and Road Regions.” Journal of Geographical Sciences 28 (9): 1263–1274. doi:10.1007/s11442-018-1524-7.
- He, Z. 2010. “Study on Impacts of Climate Change on Watershed Runoff”. Northwest A & F university (In Chinese).
- Holst, R., X. Yu, and C. Gruen. 2013. “Climate Change, Risk and Grain Yields in China.” Journal of Integrative Agriculture 12 (7): 1279–1291. doi:10.1016/S2095-3119(13)60435-9.
- HU, L., X. ZHANG, and Y. ZHOU. 2019. “Farm Size and Fertilizer Sustainable Use: An Empirical Study in Jiangsu, China.” Journal of Integrative Agriculture 18 (12): 2898–2909. doi:10.1016/s2095-3119(19)62732-2.
- Huang, Y. 2016. “Understanding China’s Belt and Road Initiative: Motivation, Framework and Assessment.” China Economic Review 40: 314–321. doi:10.1016/j.chieco.2016.07.007.
- IPCC (Intergovernmental Panel on Climate Change). 2014. “Climate Change 2014: Synthesis Report”. Geneva, Switzerland: 151.
- Johnson, R. C., and E. T. Kanemasu. 1983. “Yield and Development of Winter Wheat at Elevated Temperatures.” Agronomy Journal 75 (3): 561. doi:10.2134/agronj1983.000219620075000.
- Hadri, K. 2000. “Testing for Stationarity in Heterogrneous Panel Data.” The Econometric Journal 3: 148–161. doi:10.1111/1368423X.00043.
- Lau, C. K. M. 2010. “New Evidence about Regional Income Divergence in China.” China Economic Review 21 (2): 293–309. doi:10.1016/j.chieco.2010.01.003.
- Li, F., S. Dong, L. Yuan, and H. Cheng. 2016. “Study on Agriculture Patterns and Strategy of the Belt and Road.” Bulletin of Chinese Academy of Sciences 31 (6): 678–688. (In Chinese). doi:10.16418/j..1000-3045.2016.06.011.
- Li, H. 2016. “Study on the Necessity of Adjusting the Fertilizer Export Policy under the Belt and Rode Strategy.” Chemical Enterprise Management 31: 10–15. (In Chinese)..
- Lichtenberg, F. R. 1994. “Testing the Convergence Hypothesis.” The Review of Economics and Statistics 76 (3): 576–579.
- Lin, Y., and Y. Li. 2003. “Comparative Advantage, Competitive Advantage and Economic Development of Developing Countries.” Management World 7: 21–28+66-155. (In Chinese). doi:10.19744/j.cnki.11-1235/f.2003.07.004.
- Lioubimtseva, E., and G. M. Henebry. 2009. “Climate and Environmental Change in Arid Central Asia: Impacts, Vulnerability, and Adaptations.” Journal of Arid Environments 04 (11): 963–977. doi:10.1016/j.jaridenv.
- Liu, S., X. Mo, Z. Lin, Y. Xu, J. Ji, G. Wen, and J. Richey. 2010. “Crop Yield Responses to Climate Change in the Huang-Huai-Hai Plain of China.” Agricultural Water Management 97 (8): 1195–1209. doi:10.1016/j.agwat.2010.03.001.
- Lobell, D., and G. Asner. 2003. “Climate and Management Contributions to Recent Trends in U.S. Agricultural Yields.” Science 299: 1032. doi:10.1126/science.1078475.
- Mahmood, N., M. Arshad, H. Kächele, H. Ma, A. Ullah, and K. Müller. 2019. “Wheat Yield Response to Input and Socioeconomic Factors under Changing Climate: Evidence from Rainfed Environments of Pakistan.” Science of the Total Environment 688: 1275–1285. doi:10.1016/j.scitotenv.2019.06.266.
- Mankiw, N. G., D. Romer, and D. N. Weil. 1992. “A Contribution to the Empirics of Economic Growth.” Quarterly Journal of Economics 107: 407–437.
- Mbow, C., C. Rosenzweig, L. G. Barioni, T. G. Benton, M. Herrero, M. Krishnapillai, and E. Liwenga. 2019. “Food Security. In: Climate Change and Land: An IPCC Special Report on Climate Change, Desertification, Land Degradation, Sustainable Land Management, Food Security, and Greenhouse Gas Fluxes in Terrestrial Ecosystems”.
- McArthur, J. W., and G. C. McCord. 2017. “Fertilizing Growth: Agricultural Inputs and Their Effects in Economic Development.” Journal of Development Economics 127: 133–152. doi:10.1016/j.jdeveco.2017.02.007.
- Nicholls, N. 1997. “Increased Australian Wheat Yield Due to Recent Climate Trends..” Nature 387: 484–485. doi:10.1038/387484a0.
- Phillips, P., and D. Sul. 2007. “Transition Modeling and Econometric Convergence Tests.” Econometrica 75 (6): 1771–1855. doi:10.1111/j.1468-0262.2007.00811.x.
- Phillips, P., and D. Sul. 2009. “Economic Transition and Growth..” Journal of Applied Econometrics 24: 1153–1185. doi:10.1002/jae.1080.
- Porter, J. R., and M. Gawith. 1999. “Temperatures and the Growth and Development of Wheat: A Review.” European Journal of Agronomy 10 (1): 23–36. doi:10.1016/s1161-0301(98)00047-1.
- Quah, D. H. 1993. “Galton’s Fallacy and the Convergence Hypothesis.” Scandinavian Journal of Economics 95: 427–443.
- Ray, D., J. Gerber, G. MacDonald, and P. C. West. 2015. “Climate Variation Explains a Third of Global Crop Yield Variability.” Nature Communications 6 (1): 5898. doi:10.1038/ncomms6989.
- Ray, D. K., N. Ramankutty, N. D. Mueller, P. C. West, and J. A. Foley. 2012. “Recent Patterns of Crop Yield Growth and Stagnation.” Nature Communications 3: 1. doi:10.1038/ncomms2296.
- Reilly, J., F. Tubiello, B. McCarl, and D. Abler. 2003. “U.S. Agriculture and Climate Change: New Results..” Climatic Change 57: 43–69. doi:10.1023/A:1022103315424.
- Rodomiro, O., D. S. Kenneth, G. Bram, R. Gupta, and G. V. Subbarao. 2008. “Climate Change: Can Wheat Beat the Heat?” Agriculture, Ecosystems and Environment 126: 46–58. doi:10.1016/j.agee.2008.01.019.
- Rosegrant, M. W., and S. A. Cline. 2003. “Global Food Security: Challenge and Policies.” Science 302: 1917–1920. doi:10.1126/science.1092958.
- Sommer, R., M. Glazirina, T. Yuldashev, A. Otarov, M. Ibraeva, L. Martynova, and E. Pauw. 2013. “Impact of Climate Change on Wheat Productivity in Central Asia.” Agriculture, Ecosystems & Environment 178: 78–99. doi:10.1016/j.agee.2013.06.011.
- Song, S. 2014. “Expanding Foreign Agricultural Cooperation under the Belt and Road Strategy.” Journal of International Economic Cooperation 09: 63–66. (In Chinese).
- Sun, Z., and X. Xian. 2015. “Current Situation and Prospect of Food Production in Countries along the First Belt and Road.” World Agriculture. 12(1):253+1-8. (In Chinese). doi:10.13856/j.cn11-1097/s.2015.12.001.
- Taffesse, A. S., P. Dorosh, and S. A. Gemessa. 2012. “Crop Production in Ethiopia: Regional Patterns and Trends, Ethiopia Strategy Support Program (ESSP II)”. doi:10.9783/9780812208610.53
- Tian, X., and X. Yu. 2019. “Crop Yield Gap and Yield Convergence in African Countries.” Food Security 11 (6): 1–15. doi:10.1007/s12571-019-00972-5.
- Tian, X., X. Yu, and X. Zhang. 2016. “Grain Output Potential in China: A Perspective from Club Convergence.” Journal of Zhejiang University (Humanities and Social Sciences) 46(5):112–128. (In Chinese)
- Tian, X., X. Zhang, Y. Zhou, and X. Yu. 2016. “Regional Income Inequality in China Revisited.” A Perspective from Club Convergence. Economic Modelling 56: 50–58. doi:10.1016/j.econmod.2016.02.028.
- Westerlund, J. 2013. “A Sequential Test for Pair-wise Convergence in Chinese Provincial Income.” Economics 27: 1–6. doi:10.1016/j.asieco.2013.04.002.
- Wilcox, J., and D. Makowski. 2014. “A Meta-analysis of the Predicted Effects of Climate Change on Wheat Yields Using Simulation Studies.” Field Crops Research 156: 180–190. doi:10.1016/j.fcr.2013.11.008.
- Yang, T., Q. Guo, and T. Xiao. 2016. “Distribution Characteristics of Natural Disasters along the Belt and Road.” Journal of Safety Science and Technology 12(10):165–171. (In Chinese)
- You, L. 2012. “A Tale of Two Countries: Spatial and Temporal Patterns of Rice Productivity in China and Brazil.” China Economic Review 23 (3): 690–703. doi:10.1016/j.chieco.2010.10.004.
- You, L., M. W. Rosegrant, S. Wood, and D. Sun. 2009. “Impact of Growing Season Temperature on Wheat Productivity in China.” Agricultural and Forest Meteorology 149 (6–7): 1009–1014. doi:10.1016/j.agrformet.2008.12.004.
- Yu, L., D. Zhao, H. Niu, and F. Liu. 2020. “Does the Belt and Road Initiative Expand China’s Export Potential to Countries along the Belt and Road?” China Economic Review. doi:10.1016/j.chieco.2020.101419.
- Zhang, D., H. Zhang, C. Hao, L. Wang, T. Li, and X. Zhang. 2015. “Effects of Post Flowering Canopy Temperature on Wheat Yield and Effect Analysis of Several Associated SSR Sites.” Acta Agronomica Sinica 41(4):548–556. (In Chinese)
- Zhang, P., J. Zhang, and M. Chen. 2017. “Economic Impacts of Climate Change on Agriculture: The Importance of Additional Climatic Variables Other than Temperature and Precipitation.” Journal of Environmental Economics and Management 83: 8–31. doi:10.1016/j.jeem.2016.12.001.
- Zhang, X., F. Chu, X. Yu, Y. Zhou, X. Tian, X. Geng, and J. Yang. 2017. “Changing Structure and Sustainable Development for China’s Hog Sector.” Sustainability 9 (1): 69. doi:10.3390/su9010069.
- Zhang, X., P. Qing, and X. Yu. 2019. “Short Supply Chain Participation and Market Performance for Vegetable Farmers in China.” Australian Journal of Agricultural and Resource Economics 63 (2): 282–306. doi:10.1111/1467-8489.12299.
- Zhang, X., and W. Liu. 2005. “Simulating Potential Response of Hydrology, Soil Erosion, and Crop Productivity to Climate Change in Changwu Tableland Region on the Loess Plateau of China.” Agricultural and Forest Meteorology 131 (3–4): 127–142. doi:10.1016/j.agrformet.2005.05.005.
- Zhang, X., X. Yu, and L. You. 2020. “Does the Granary County Subsidy Program Lead to Manipulation of Grain Production Data in China?” China Economic Review 62: 101347. (Zhang et al., 2020c). doi:10.1016/j.chieco.2019.101347.
- Zhang, X., X. Yu, X. Tian, X. Geng, and Y. Zhou. 2019a. “Farm Size, Inefficiency, and Rice Production Cost in China.” Journal of Productivity Analysis 52 (1–3): 57–68. doi:10.1007/s11123-019-00557-6..
- Zhang, X., Y. Yang, Y. Zhu, K. Gao, and H. J. Zhang. 2019b. “An Analysis of China’s Fertilizer Industry Based on the Global Fertilizer Supply and Demand Matching.” World Agriculture 5 (13): 84–90 (In Chinese). doi:10.13856/j.cn11-1097/s.2019.05.013.
- Zhou, J., L. Tang, and X. Yu. 2018. “Estimating the Average Treatment Effect of Adopting Stress Tolerant Variety on Rice Yield in China.” Journal of Integrative Agriculture 17 (4): 940–948. doi:10.1016/S2095-3119(17)61848-3.
- Zhou, L., and C. G. Turvey. 2014. “Climate Change, Adaptation and China’s Grain Production.” China Economic Review 28: 72–89. doi:10.1016/j.chieco.2014.01.001.
Appendix
Appendix 1
Regional classification of 65 countries along the BR
Appendix 2
Looking for the core group using Log t test