
ABSTRACT
The study examine the efficacy of government policy interventions initiated since 2014 to curb FCRB in NW Indian states and the related air pollution in Delhi-NCR during 2014-2019. The regression analysis suggests an increase in PM2.5 of ~69 µg/m3/1000 surge in fires. VIIRS retrieved data suggest an overall declining trend of ~1606 and ~4308 fire counts per year across NW states during October-November respectively. The monthly PM2.5 concentrations in New Delhi exhibits a decline of ~2.18 µg/m3 and ~5.17 µg/m3 per year over the same period. Despite an overall increase of ~17.6 % rice productivity, a noted decrease in fire activity over the period is an encouraging move, likely a result of some control imposed by authorities on FCRB. Owing to a significant ~35.5% rise in wheat productivity, data records rising trend in wheat residue burning activities in April (~1298/year) and May (~2402/year) but do not trigger extreme pollution due to difference in intensity of fires across harvesting seasons and relatively weak northwesterly wind direction. Nevertheless, the overall high PM2.5 levels in October-November and April-May compared to NAAQS 24-hour average of 60µg/m3, disproves the overall efficacy of government policies to curb FCRB and related air pollution in IGP region.
Introduction
Over the past few decades, field crop residue burning (FCRB) also known as biomass burning has become the most common agricultural land management practice and a significant source of air pollution (Streets et al. Citation2003) in Asian countries such as India, China, Indonesia, and Thailand (Cassou, Jaffee, and Ru Citation2018). Farmers mostly burn crop stubble or superfluous vegetation to prepare the fields for cultivation of next season’s crop with little apprehension of its detrimental impact on air quality, climate change, and public health.
India is an agrarian country with more than 150 million hectares of arable land (52.8% of the total land) (https://data.worldbank.org), used mainly for rotational cultivation of crops like rice and wheat. Rotational rice and wheat (R-W) cultivation is widely practiced in the Northwestern (NW) Indian states,Footnote1 i.e., Punjab, Haryana, and Western Uttar Pradesh (UP)Footnote2 located in the Indo-Gangetic Plains (IGP) (). The NW states are famously known as the “Food Bowl of India” (Koshal Citation2014) for contributing approximately 26% and 59% to the country’s total rice and wheat production, respectively (Agriculture statistics Citation2017). Nevertheless, they are also equally infamous for the post-harvest FCRB practice.
Figure 1. The map depicting NW Indian states, New Delhi, Punjab, Haryana and UP
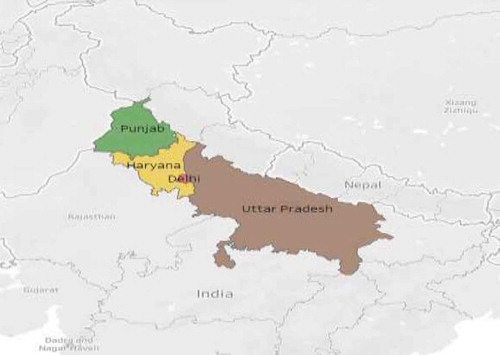
Figure 2. (a): MODIS and VIIRS collection of fire counts in October–November (2014–2019)
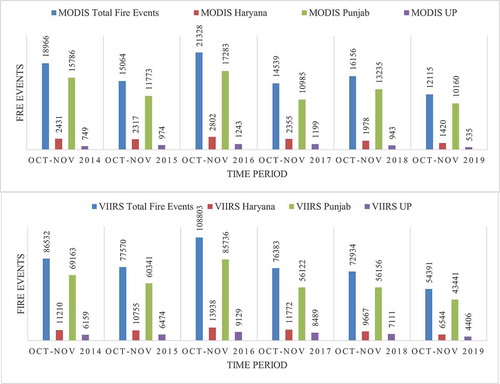
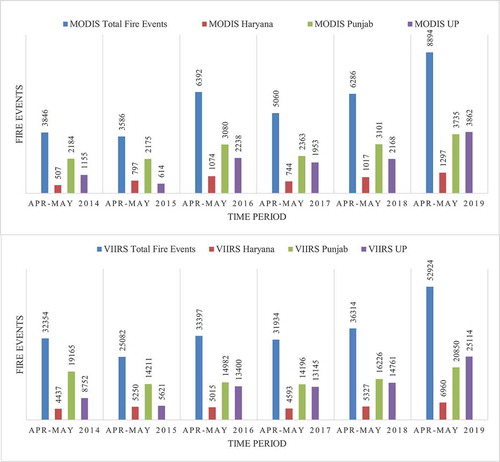
Figure 2. (b): MODIS and VIIRS collection of fire counts in April–May (2014–2019)
Uncontrolled FCRB is a significant source of atmospheric pollution that impacts the atmospheric chemistry (both local and regional), global climate change, and human health (Hiloidhari et al. Citation2019; Mehmood et al. Citation2018; Gurjar, Ravindra, and Nagpure Citation2016). Among the series of atmospheric pollutants, Greenhouse Gases (GHGs) such as CO2 (carbon-do-oxide) is primarily linked to global warming (Kaur-Sidhu et al. Citation2020; Jacobson Citation2019; Andini et al. Citation2018); whereas, particulate matter with an aerodynamic diameter smaller than 2.5 mm (PM2.5) significantly contributes to the ambient air pollution and the human health ailments such as respiratory infections, lung cancer, and cardio-pulmonary disorders (Li et al. Citation2019; Gupta Citation2019; Saggu et al. Citation2018). FCRB in NW states is a severe concern for the adjoining New Delhi and the neighboring capital region (Delhi-NCR) 3 especially during winters (October–November) when the rice residue burning is at its peak (Singh et al. Citation2020; Kumar et al. Citation2019; Mathur and Srivastava Citation2019). The time duration for which a specific air pollutant such as PM2.5 and GHGs remains in the atmosphere is determined by its reactivity and removal rate by natural mechanisms such as wind speed, wind direction, and rainfall. (Maduna and Tomašić Citation2017).
Extensive R-W cultivation (dual cropping) has fatigued the natural resource base, i.e., land, soil, water, and air (Ladha et al. Citation2003). The sustainability of agricultural systems and the best use of natural resources with minimal adversarial environmental and social impacts have gained paramount attention among academic scholars (Raza et al. Citation2019; Mitchell, Brown, and McRoberts Citation2018; Weersink and Pannell Citation2017). Air pollution is associated with many of the United Nations Sustainable Development Goals. Policies (UN-SDGs) to improve air pollution directly relate to climate change mitigation efforts, sustainable consumption and production patterns, waste-reduction measures, promotion of good health and well-being, access to clean energy, and environmentally sound waste management practices among other socio-economic developmental aspects (Rafaj et al. Citation2018). Implementing environmentally sustainable policies is key to real development in Third world countries (Brundtland et al. Citation1987).
Owing to the rising environmental concerns, India initiated the first national policy for the management of crop residue (NPMCR) in 2014, to control crop burning in NW states and mitigate transboundary air pollution in the neighboring region. The study attempts to examine the efficacy of Indian government policies to curb crop burning and the related-fine particulate matter pollution (PM2.5), over the period 2014–19, ensuring that the research is relevant to policymakers. To achieve the objective, the study assesses the Spatial-temporal distribution of active fire events in NW states, to identify the trend and intensity of thermal anomalies or crop fires in the region. The study retrieved the thermal datasets from 2 NASA sensors, i.e., Visible Infrared Imaging Radiometer Suite (VIIRS) at 375 m aboard Sumo-NPP and Moderate-Resolution Imaging Spectro-Radiometer (MODIS) at 1000 m aboard Terra & Aqua to monitor and map the active fire events. The study also assesses the impact of crop fires in NW states on the ground-level PM2.5 concentrations measured at the U.S. Embassy site in New Delhi during winter (October and November) and summer harvesting (April-May) season across 2014–2019. The study conducts a correlative analysis to investigate the co-existence of the crop burning and the resulting particulate matter pollution link. The trend of thermal anomalies and the resulting PM2.5 New Delhi levels during 2014–2019 would further suggest the efficacy of government interventions to curb FCRB and related air pollution. Broadly, the study attempts to provoke more discussion and policy research on the critical issue of FCRB in the NW states.
Agriculture scenario in northwest India
Agricultural production in India is typically classified into two cropping seasons, Kharif and Rabi. Rice (Kharif) is sown in June till September and harvested in October-November (post-monsoon), whereas wheat (Rabi) is sown in October till March and harvested in April/May(summers). Traditionally, in a year, farmers cultivated rice or wheat besides other vegetation such as pulses and millets. Green revolution introduced during the mid-1960s resulted in high-yielding varieties of rice (Oryza sativa) and wheat (Triticum aestivum) (Gupta and Seth Citation2007) which enabled rotational R-W cultivation to emerge as the major cropping system in NW India (Singh, Park, and Litten-Brown Citation2011; Kannan Citation2013). The rice-wheat cropping system (RWCS) existed since the 1960s; nevertheless, the FCRB gained momentum post-1980s when mechanized harvesting through combine harvesters resulted in substantial stubble or crop residue leftovers in the fields (Bhuvaneshwari, Hettiarachchi, and Meegoda Citation2019; Singh and Kaskaoutis Citation2014). A short window of 15–20 days to clear the fields before sowing the next season’s crop leaves farmers with the most common residue management practice of open field crop burning (Liu et al. Citation2020; Nagar, Sharma, and Das Citation2019). Unlike wheat, the rice residue with high silica content is a poor animal feed (Zayed Citation2018; Bisen and Rahangdale Citation2017; Jitendra et al. Citation2017; Kumar, Kumar, and Joshi Citation2015), which further supports post-harvest rice residue burning. The NW states account for ~80 and ~25% of rice and wheat residue burning, respectively (Ravindra, Singh, and Mor Citation2019; Gadde et al. Citation2009).
Over the years (2014–19) the wheat productivity across the NW states has increased manifolds (UP ~51%; Punjab ~7.6%; Haryana ~24%) compared to rice (UP ~21%; Punjab ~7.6% and Haryana ~0.26%) (https://eands.dacnet.nic.in/). However, the marginal 0.25 million hectare rise in the total area under rice cultivation across the NW states was compensated by a 0.25 million hectare fall in total area under wheat cultivation, suggesting no effective rise in the total land area under RWCS during the period of study (Supplementary Table 1). Thus, the rising crop productivity over the period 2014–2019 (rice ~17.6% & wheat ~35.5%) as also suggested by Jethva et al., 2019 for the period 2002–2016 is significantly contributing to the rising crop burning activities in the NW region. The total rice and wheat production for the NW states from 2014 to 2019 has increased from 27.27 Mt/year to 32.88 Mt/year and 47.62 Mt/year to 63.54 Mt/year, respectively.
RWCS is also complemented by strong governmental incentives such as a minimum support price (MSP) regime, subsidized seeds and fertilizers, no legal permissible limit on the extraction of water, and free power supply for agricultural usage (Mondal et al. Citation2020; Tripathi et al. Citation2019; McDonald et al. Citation2019) in the region. Excessive RWCS results in several environmental problems such as declining soil productivity, groundwater depletion, excessive use of fertilizer and pesticides, air pollution, and biodiversity loss, among others (Kayatz et al. Citation2019; Chatterjee, Lamba, and Zaveri Citation2017; Rodell, Velicogna, and Famiglietti Citation2009). However, the lack of effective farm-gate to market linkages, insecure market demand and economic yields for alternative crops such as millets, pulses, and barley impedes farmers’ confidence to look beyond RWCS (TERI Citation2015).
Since the early 2000s, the rising R-W production has led to enormous residue generation and burning in the NW states. About 85–90% of the crop fires transpires during the October–November months (Jitendra et al. Citation2017). The strong northwesterly wind direction during winters (October–November) transports the smoke plume emitting from rice stubble burning in the neighboring NW states to the areas of Delhi-NCR (Liu et al. Citation2018; Guo et al. Citation2017), where the stagnant weather conditions such as low wind speeds, descending air, and low temperatures trap the pollutants and trigger high PM pollution and haze events (Beig et al. Citation2019; Bikkina et al. Citation2019; Chowdhury et al. Citation2019; Sawlani et al. Citation2019; Cusworth et al. Citation2018). Nevertheless, the relatively weak northwesterly wind direction during the summers (April–May), accompanied by high flowing wind speed in the Delhi-NCR (compared to winters), do not trigger the same severity of air pollution in the region (Liu et al. Citation2018). Delhi topped the list of the most polluted regional capital city for the second consecutive year in 2019 with the mean annual PM2.5 concentration of 98.6 μg/m3 (~10 times above the WHO’s annual mean threshold of 10 μg/m3). It is alarming to note that 7 out of the 10 most polluted cities in the South Asian region are from India (World Air quality report Citation2019).
Policy background
The transition to the sustainable management of agricultural waste supports the decoupling of economic growth from environmental degradation (UNEP Citation2011). Agricultural waste can be turned into resources using intensified conversion technologies yielding potentially sustainable bio-products such as fertilizers, energy, and materials. Since the 1950s, Britain, the United States (US), Germany, France, Japan, and the former Soviet Union have been using one of the most promising solutions – anaerobic digestion technology (Merlin and Boileau Citation2013) to convert biomass into bioenergy and bio-based products. Moreover, since the 1990s, the US has been extensively promoting biomass energy generation to mitigate global climate change (Wise et al. Citation2014). Liquefaction technology is employed by the US and Brazil to convert biomass into liquid fuels to supplant petroleum (Wei et al. Citation2020). The agricultural waste in the US, Canada, and the UK are widely recycled to produce animal feed and building material (UNEP (United Nations Environment Programme) Citation2009). Wheat straw is an excellent fiber material used by several EU nations in the pulping and papermaking industry (Fang and Shen Citation2018). The biomass energy generation in Denmark reduces the running cost of power plants and is also an additional source of income for farmers (Nguyen, Hermansen, and Mogensen Citation2013). Shattered crop residue is widely used as farm fertilizer in Japan, the Philippines, and Canada. (UNEP (United Nations Environment Programme) Citation2009). The approaches to the sustainable management of crop residue and developing bio-products from agricultural wastes are backed by technological progress and innovation in the developed nations; however, the processes are evolving and require more in-depth knowledge to extrapolate the solutions in the Asian region (Gontard et al. Citation2018; Yin et al. Citation2017).
Thailand, an agricultural country cultivates rice two to three times a year (Junpen et al. Citation2018; Phairuang, Hata, and Furuuchi Citation2017). To regulate the widely practiced rice residue open burning and the associated air pollution and haze events in Southeast Asia, the Thai government signed a legally binding ASEAN Agreement on Transboundary Haze Pollution in 2002. Since 2012, the Thai government has imposed various regulatory measures to curb rice production and related residue burning. Among the various measures, discontinuation of the “Rice Pledging Scheme” in 2015 (introduced during 2011–14) that guaranteed farmers the MSP of 15,000 baht per ton for rice (double the market price) has been quite a success. It coxed farmers to substitute off-season rice cultivation with alternative crops (Prasertsri Citation2017), overcoming the rice stubble burning problem to some extent.
China also faces a similar issue of FCRB-induced air pollution but is determined to reverse the declining air quality trend by reducing carbon-di-oxide (CO2) and PM emissions attributing to global warming and regional haze episodes (Zhang, Liu, and Hao Citation2016). China considerably promotes the development of new technologies converting biomass into energy resources such as biogas, liquid fuel, and briquette fuel. The government aims to increase the renewable energy share to 15% of the total energy consumption by 2020 (NDRC Citation2007). The Chinese government also subsidizes crop stubble retention in the fields to improve soil quality and agricultural productivity (Sun, Ge, and Zhou Citation2019).
The Indonesian government, since 2014, has enforced stringent regulations to ban crop burning practice and also ratified the Agreement on Transboundary Haze Pollution originally signed in 2002. By 2025, the Indonesian biofuel policy aims to replace gasoline and diesel with 15% bioethanol and 20% biodiesel made from rice and sugarcane waste (Putrasari et al. Citation2016).
Since 2014, the Indian government has also implemented several regulatory measures to curb crop burning and mitigate air pollution at the regional and national levels. represents the key policy interventions and measures adopted by both center and state governments to specifically curb crop burning in NW states and mitigate crop burning-induced air pollution in the neighboring states, particularly Delhi-NCR.
Table 1. Key policy interventions and measures to curb crop burning and improve air quality
In 1998, the Supreme Court of India constituted the Environment Pollution (Prevention and Control) Authority (EPCA) to specifically look into the matter of transboundary air pollution in the Delhi-NCR. Moreover, a legal National Policy for Management of Crop Residue (NPMCR) was introduced lately in 2014 (http://agricoop.gov.in/sites/default/files/NPMCR_0.pdf) in response to a legal case filed by Vikrant Kumar Tongar to National Green Tribunal (NGT) against the popular FCRB practiced in Delhi bordering NW states, causing severe air pollution, smog, and health hazards in Delhi-NCR. The NPMCR emphasized the development of economic farm machinery to reduce residue generation, alternative sustainable residue management practices, and satellite-based remote sensing technology to monitor the crop fires. Besides spreading awareness about the ill effects of FCRB among farmers, the CPCB and National Remote Sensing Agency (NRSA) are authorized to penalize farmers for crop burning. Nonetheless, the penalties based on the size of landholdings are bare minimum (USD 35–210)Footnote3 due to farmers’ weak economic status. FCRB is also a punishable offense under the Air (Prevention and Control of Pollution) Act, 1981, yet the number of fire events are rising year on year (Vasudeva Citation2019). The survey conducted in Punjab suggests that the high cost of managing stubble and convenience factor are the primary reasons for farmers opting for crop burning (CII-CESD Citation2019; Jitendra et al. Citation2017).
The Indian Government in the recent past has introduced numerous action plans such as the New National Biogas and Organic Manure Program (NNBOMP) and Sustainable Alternative Toward Affordable Transportation (SATAT) initiative for the sustainable management of crop residue. The Government recommends extensive incentivization and promotion of private and public sector participants in sustainable residue management practices.
Indian Government has earmarked USD 161.27 m to promote Agricultural Mechanization for In-Situ Management of Crop Residue in the NW Indian States (PIB Citation2019) by subsidizing 80% cost of required farm machinery (PIB Citation2019).The Environment Pollution (Control and Prevention) Authority (EPCA), in consultation with the NW state governments, implements short-term solutions such as shutting down power plants, industrial units, banning construction, and odd-even scheme during the winter smog episodes in New Delhi. However, despite all the mitigation measures, Delhi-NCR yet again in 2019 experienced a spike in pollution levels and lay enveloped in a thick layer of noxious smog during winters.
Assessment of spatial-temporal distribution of active fire events in NW states
Datasets used
The thermal datasets or the real-time active fire counts in the NW states during the period 2014–2019, were acquired from two NASA satellite sensors VIIRS (Visible Infrared Imager Radiometer Suite) and MODIS (Moderate Resolution Imaging Spectroradiometer). The sensors detect day and night fire events through a highly sensitive 3.9 μm channel with a robust thermal response to any fire activity in the pixel.
MODIS
MODIS thermal anomaly data (Collection 006) retrieved from Aqua (MYD14) and Terra (MOD14) platforms of the NASA Fire Information for Resource Management System (FIRMS) (https://earthdata.nasa.gov/earth-observation-data/near-real-time/firms) is used in the present study. The data used ranges between the confidence value of 30%–80% and 80%−100%, which corresponds to the “nominal” and “high” fire pixel classes, respectively (http://modis-fire.umd.edu/files/MODIS_C6_Fire_User_Guide_B.pdf). MODIS’s thermal detection algorithm uses a combination of 4 and 11 μm channels to detect active fires Giglio, Schroeder, and Justice Citation2016). The detailed description of the contextual algorithm used by MODIS to detect fire anomalies both in day and night time is available in MODIS Collection 6 Active Fire Product User’s Guide (Giglio et al. Citation2018).
Since the inception in 2000, the two MODIS instruments (1000 m resolution per pixel) onboard NASA’s Terra and Aqua satellites have been detecting fire spots at 1 × 1 km2 spatial resolution globally on a daily basis. Terra is timed to orbit around the Earth in a way that it passes from north to south across the equator in the morning (descending at 10:30 am) while Aqua passes south to north over the equator in the afternoon (ascending at 1:30 pm). Terra/Aqua MODIS views the entire Earth’s surface every 1–2 days and attains data in 36 spectral bands (https://modis.gsfc.nasa.gov/about/). The archive data were requested by selecting a custom region of each state from 2014 to 2019; further, the daily, monthly, and yearly fire counts were calculated using the retrieved data.
VIIRS
VIIRS instrument onboard the Suomi National Polar-Orbiting Partnership (Suomi NPP) spacecraft is a scanning imaging radiometer with a viewing swath of 3000 Km that was launched on 28 October 2011. Built on the MOD14/MYD14 algorithm, VIIRS has been loaded with various modifications to provide better data quality (Schroeder et al. Citation2014). VIIRS, with 22 imaging and radiometric bands covering wavelengths from 0.41 to 12.5 μm, has more efficient sensors than MODIS to monitor more than 20 environmental data records, including surface temperature and fire activities. The thermal band of VIIRS with higher resolution (375 m resolution per pixel) than MODIS (1000 m resolution per pixel) enables more fire detections, making it a well suitable tool for monitoring fire activity (Wolfe et al. Citation2013). Additionally, the VIIRS I-Band’s pixel area being 10 × smaller than MODIS detects active fires that are 10 × smaller in the area and 10 × lesser in intensity (Schroeder et al. Citation2014; Giglio et al. Citation2003). The thermal datasets for all three NW states are retrieved from VIIRS 375 m, which provides a greater response over fires of relatively smaller areas and improves the mapping of large fire perimeter (https://earthdata.nasa.gov/earth-observation-data/near-real-time/firms/viirs-i-band-active-fire-data). The VIIRS 375 m fire pixels consist of three confidence classes, “low,” “nominal,” and “high,” which represents the observation conditions associated with each detection. The study employs the fire detection data flagged with “nominal” and “high” confidence value to reduce effects such as sunlight and water surface reflection (https://lpdaac.usgs.gov/documents/132/VNP14_User_Guide_v1.3.pdf).
The data were requested by selecting a custom region of each state for the period from 2014 to 2019. Further, the daily, monthly, and yearly fire counts were calculated using the retrieved data.
Spatial-temporal distribution of active fire events by MODIS & VIIRS
The quality-guaranteed thermal datasets retrieved from NASA remote sensing instruments are appropriate for analyzing the regional active fire trends (Zhuang et al. Citation2018; Li et al. Citation2019). In the present study, the total active fire counts for the NW states are retrieved from NASA satellites, MODIS and VIIRS (March 2014–December 2019.) The data indicate that VIIRS is much more capable of detecting small and large active fires than MODIS. VIIRS is comparatively more sensitive in detecting fires, but MODIS provides crisper and more detailed land surface images due to its 250 m spatial resolution other than the thermal bands (https://earthobservatory.nasa.gov/images/87111/a-clearer-view-of-fire).
The satellite-retrieved temporal datasets are shown in indicate the inter-annual variations in fire counts across the NW states during 2014–2019. October–November (post-monsoon) and March–April (Spring) correspond to rice and wheat harvesting season, respectively. The year 2016 was the most unusual year with the maximum number of fire activities detected by NASA satellites during winters in the NW region (MODIS-21,328 and VIIRS-108,803), particularly in the state of Punjab (MODIS −17,283 and VIIRS −85,736). This was the result of historically high rice crop production in 2016 with practically no enforcement on crop residue burning (Jethva et al. Citation2018, Citation2019). The satellite retrievals further suggest that over the period (2014–19), the total rice stubble burning activities (October–November) in NW states have considerably reduced from 18,966 to 12,115 (MODIS) and 86,532 to 54,391 (VIIRS) (). However, the wheat stubble burning activities (April–May), on the contrary, show a positive trend, i.e., 3846 to 8894 (MODIS) and 32,354 to 52,924 (VIIRS) (). The rice stubble burning is highest in the state of Punjab followed by Haryana, whereas UP ranks higher in wheat stubble burning.
The Consortium for Research on Agro-Ecosystem Monitoring and Modeling from Space (CREAMS) at Indian Agricultural Research Institute (IARI), New Delhi, also reported similar occurrences of the crop fires across the NW states. The satellite-retrieved thermal data by CREAMS indicates a 40% decline in the rice stubble burning across all the NW states over the period 2016 to 2018. The decline is most evident in UP, followed by Haryana and Punjab (Farmech Citation2019).
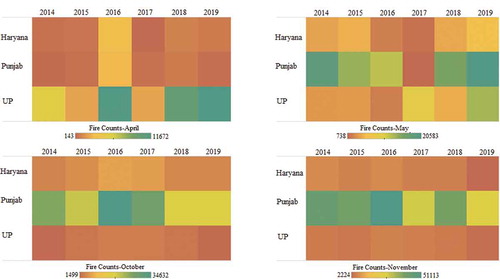
further depicts the relative intensity of fires events during rice-harvesting (October–November) and wheat-harvesting (April–May) months across all the three NW states (2014–2019). It is observable that maximum hot spots during the rice-harvesting period are detected in Punjab followed by Haryana and UP. However, over the period, there has been a noticeable increase in wheat-burning activities in UP, particularly in April months followed by Punjab, mainly in May months.
Figure 3. Relative Intensity of VIIRS-detected fires events during rice-harvesting (October–November) and WHEAT-HARVesting (April–May) months across Haryana, Punjab, and UP (NW States) during the period 2014–2019
Correlation analysis of ground-level PM2.5 and satellite-retrieved fire counts
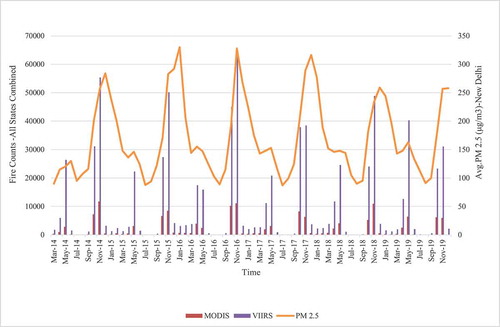
traces a positive relationship between satellite-retrieved fire counts in NW states and the monthly averaged PM2.5 concentrations in New Delhi. further depicts the coexistence of temporal evolution of active fire counts, both during October–November (rice harvesting) and April–May (wheat harvesting) and the subsequent monthly averaged PM2.5 concentrations in New Delhi. It is evident that the fire counts in winters are six to eight times higher than in summers and exhibits concurrence with high PM2.5 levels in New Delhi. Although 85–90% of the crop burning takes place during the October–November months but the high PM2.5 concentrations also persist in December because the pollution favorable weather conditions trap pollutants for longer a period. The persistence of higher levels of PM2.5 during December and January are also attributed to small-scale bonfire for personal heating throughout the region coupled with temperature inversion phenomenon favoring trapping of pollutants near the surface. The study retrieved daily averaged PM2.5 data measured by the U.S. Embassy and Consulates’ at the U.S. Embassy site in New Delhi (https://in.usembassy.gov/embassy-consulates/new-delhi/air-quality-data/) for the period 2014–2019.
Figure 4. Relationship between daily-averaged PM2.5 MEASUREd at the US embassy site in New Delhi and the satellite-detected (MODIS/VIIRS) Fire counts in NW states (2014–2019)
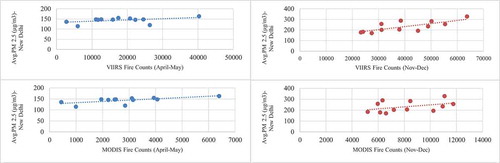
Figure 5. Temporal trends of VIIRS/MODIS-retrieved active fire counts in NW States (Combined) and monthly PM2.5 measured at the US embassy site in New Delhi (March 2014–November 2019)
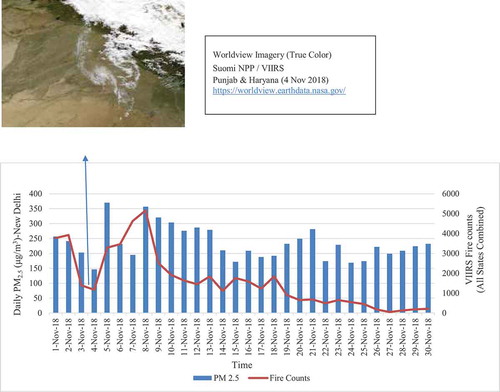
The study further attempts to estimate the concurrent variation of the temporal pattern of VIIRS-detected fires counts across NW states and PM2.5 concentrations in New Delhi, during October–November and April–May months over the period 2014–2019 by representing data in the standard Box and Whisker plot (). It enables visualization of PM2.5 distributions through its quartiles. The back-trajectory calculation by Jethva et al. (Citation2018) suggests that the transportation of smoke produced from agricultural fires in NW states typically takes 15–51 hours or (T + 2 days) to reach Delhi-NCR. It depends on the distance between the crop burning site and receptor site (ranges between 185 and 420 Km) and the altitude of the transportation pathway trajectory. Thus the present study adopts a T + 2 days’ window for transportation mechanism over which the VIIRS retrievals and PM2.5 in New Delhi are averaged to estimate correlation. Each box plot presents a five-point summary of the distribution of PM2.5. The lower and the upper end of the box represent 25 and 75 percentiles of the sample, whereas the thin vertical bars represent data falling within 1.5 times the interquartile range (75–25 percentile). The dots outside the interquartile range are outliers and the points where color changes represent the median of the distribution. Overall, the boxplot exhibits a definite relationship between the fire counts and PM2.5 concentrations in New Delhi. The inherent limitations in satellite fire detection on account of low visibility due to haze, clouds, or diminishing fire intensities () spread PM2.5 values over fewer fire counts (Jethva et al. Citation2018). Besides crop burning, the atmospheric stagnation and falling temperatures during winters also elevate PM2.5 concentrations by trapping particulate particles in the troposphere for a longer duration (Kanawade et al. Citation2020; Beig et al. Citation2019). The association between the variables is near-linear up to 2400 fire counts but non-linear beyond that. The data suggest that the mean PM2.5 for fire counts < 2400 and >2400 are 143 μg/m3 and 214 μg/m3, respectively. Despite the implementation of several mitigation policies, the 24-hour ambient PM2.5 concentrations during winters tend to spike more than eight times above India’s National Ambient Air Quality Standard (NAAQS) of 60 μg/m3 in New Delhi (for instance, 762.6 µg/m3 on October 28 2019).
Figure 6. Relationships of PM2.5 (μg/m3) measured at the US embassy site in New Delhi Versus VIIRS Detected Fire Counts for October–November and April–May months during the period 2014–2019
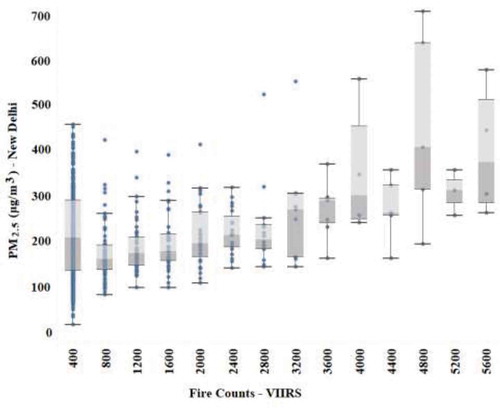
Figure 7. Impaired satellite-based (VIIRS) fire detection due to haze/cloud cover over NW Indian states
shows the regression parameters of the PM2.5 vs. fire counts for the two distinct data sets, “Full Data” and “Constrained Data.” The “full data” set comprises the entire range of measured data points, which exhibits a nonlinear relationship with a weak correlation (0.434) and high standard error (61.6 µg/m3). Moreover, the constrained dataset with fire counts < 2400 shows a strong correlation (0.81) and a low standard error of 21.9 µg/m3, exhibiting a near-linear relationship between the two parameters. It further suggests an increase in PM2.5 of ~ 69 µg/m3 per the 1000 surge in fire counts; however, with the subsequent rise in fire counts (> 2400), the two variables lose correlation. A similar study conducted by Jethva et al. (Citation2018) also exhibited a near-linear positive relationship between PM2.5 concentrations in New Delhi and the fire counts in the NW region of Punjab and Haryana, for the post-monsoon rice burning season (October–November) of 2013–2016. The results indicate an overall rise of ~33 µg/m3 PM2.5 per 100 surge in fire counts (constrained data). Jethva et al. (Citation2018) used MODIS thermal anomaly data, whereas the present study employs VIIRS data to compare PM 2.5 in New Delhi against fire counts in Punjab, UP, and Haryana (both during spring and post-monsoon season, 2014–2019) because VIIRS 375 m has more efficient sensors and thermal resolution than MODIS to detect even the small and lesser intensity fire activities (Schroeder et al. Citation2014; Wolfe et al. Citation2013; Giglio et al. Citation2003).
Table 2. Estimates of the linear regression fits between PM2.5 in New Delhi and VIIRS-retrieved fire counts
Discussion and conclusion
The seasonal crop residue burning in NW states is the primary source of transboundary air pollution, posing a serious threat to air quality and human health across the IGP region. The correlation analysis in the study traces the coexistence of fire events in NW states and the monthly PM2.5 concentrations at the US Embassy site in New Delhi. The analysis further suggests a strong influence of FCRB on the ground-level PM2.5 concentrations. As discussed earlier, the Indian Government since late 2014 has implemented several measures to reduce FCRB and promote sustainable management of crop residue, essentially to control episodic extreme air pollution and haze events in Delhi-NCR during winters. The results in the present study provide a practical assessment of the existing mitigation policy, which would help the Government identify what more needs to be done to ensure intentions are turned into results, in other words, a successful policy implementation.
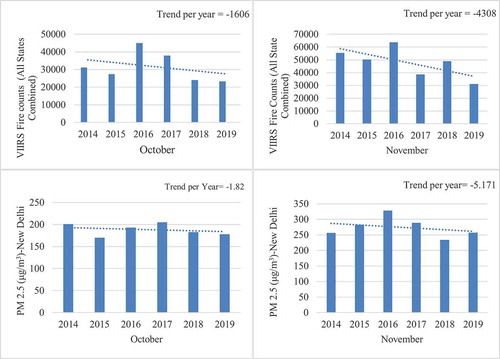
shows an overall declining trend of ~1606 and ~4308 fire counts per year across the NW states (combined) during October and November months over the period 2014–2019. The monthly PM2.5 concentrations in New Delhi also exhibit a decline of ~2.18 µg/m3 and ~5.17 µg/m3/year during October and November (2014–2019) but are still above the NAAQS 24-hour average of 60 μg/m3. Punjab with the highest FCRB incidences in the region has considerably curbed fire events from 85,736 in 2016 to 43,441 in 2019. Despite an increase in rice productivity by ~30%, a noted decrease in fire activity in Punjab from 2016 to 2019 is an encouraging move, which is likely a result of some control imposed by the authorities to reduce FCRB. Similar tendencies are also evident in the case of Haryana and UP (see , Supplementary Table 1).
Figure 8. Monthly trend of total fire counts (vertical color bars) detected by VIIRS across all the three NW States (combined) for October–November Months and the Monthly averaged PM2.5 (μg/m3) Measured at the U.S. embassy site in New Delhi for October, November months during 2014–2019
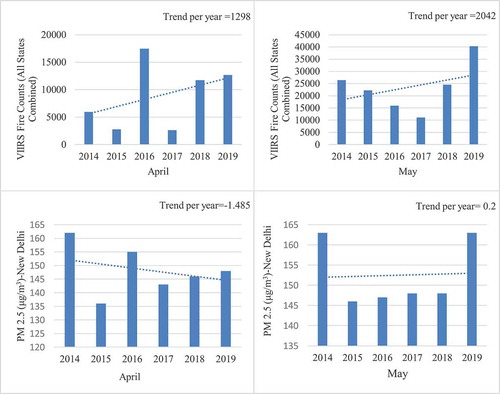
, on the contrary, indicates a rising trend in the wheat residue burning activities during April (~1298/year) and May (~2402/year) months across the NW region (all states combined) with UP being the major contributor (see )). Over the years (2014–2019), the total land under wheat cultivation in NW states has witnessed a marginal decline (0.25 million hectares) but a very steep rise in the wheat productivity, particularly in UP (~51%) has resulted in increased fire activities in the region. However, compared to winters, the average PM2.5 levels in New Delhi are significantly low in summers on account of less quantity of wheat residue burnt (~25%) compared to rice (~80%), and weak northwesterly winds transporting fewer pollutants to the neighboring states. The boundary layer depth or mixing layer height during spring (April–May) is much deeper compared to that in post-monsoon (October–November) allowing vertical mixing of the pollutants, which results in a relatively lesser concentration of PM2.5 near the surface. The high-speed winds flowing over Delhi-NCR also enable the clearing of pollution without significantly impacting the local air quality. Thus, the adversarial impact of wheat residue burning neither raises enough public concern nor questions the efficacy of government policies to curb crop burning. The overall results suggest a noteworthy reduction in rice residue burning but a significant rise in wheat residue burning in the NW states over the period 2014–2019. Nevertheless, it is worth noting that the overall PM2.5 levels in October–November (6–8×) and April–May (2–3×) are significantly high compared to the NAAQS 24-hour average of 60 μg/m3, disproving the overall efficacy of government policies to regulate crop burning and the related air pollution in the IGP region.
Figure 9. Monthly trend of total fire counts (vertical color bars) detected by VIIRS over all the three NW states (combined) for April–May Months and the Monthly averaged PM2.5 (μg/m3) measured at the U.S. embassy site in New Delhi for April–May Months over the Period 2014–2019
Increasing crop productivity is crucial to the food security needs of a developing country like India; however, the absence of an effective crop residue management system has resulted in excessive crop residue burning practice, polluting air, and deteriorating the health of millions across the NW region. The majority of the government initiatives aim to monitor and regulate the problem by providing alternative options for sustainable management of crop residue instead of addressing the genesis of the problem. Based on the global review of policies aiming to eliminate crop burning and the related air pollution, the study proposes the following recommendations. The policy-practice gap could be bridged by firstly considering the practical constraints and considerations of the farmers responsible for the intensifying FCRB and the related air pollution. The adoption of sustainable farming measures should be facilitated by a broader participatory approach involving farmers as major stakeholders. The Government should restructure its reimbursement-based subsidy scheme, enabling easy financing of Agri-equipments such as happy seeders for farmers. The use of happy seeders seems to be limited locally and given a shorter time window between the harvest and sowing of the next crop, it is practically hard to make it available to all farmers in the NW states. Like the Chinese policy, the Indian Government may subsidize farmers to retain stubble in the fields for enhancing soil productivity and mitigate air pollution. Secondly, the Government should partially discontinue the guaranteed rice procurement at MSP and instead provide the same for alternative crops. The initiative will motivate farmers to replace rotational R-W cropping with alternative less water-intensive crops, as was the case in Thailand. Third, similar to the developed world, the downstream integration of agri-food supply chains and access to markets could be a boon for Indian farmers. Crop residue could be procured for generating power and making various merchandise such as paper, packaging products etc., in turn creating value for the farmers. The Government should promote agri-based food processing units either owned by farmers or public–private partnerships (PPP) to encourage a secured market for alternative crops. These measures would promote crop diversification and discontinue extensive RWCS and related stubble burning, especially in NW India. Lastly, the Government should adopt a more holistic rather selective approach to curb crop burning across all seasons. Hence, a rigorous government effort is required to shift the focus from dual cropping to alternative crops and overcome the FCRB-air-water nexus that contaminates the environment.
Supplemental Material
Download MS Word (15.1 KB)Acknowledgments
Datasets for this research are included in this paper. Data is displayed in figures and tables in the paper.
Disclosure statement
No potential conflict of interest was reported by the author.
Supplemental material
Supplemental data for this article can be accessed here.
Notes
1 NW states thereafter represent Punjab, Haryana and Western UP.
2 Western Uttar Pradesh is referred as UP in the study.
3 1USD = 71.34 INR.
References
- Agriculture statistics, 2017, http://agricoop.nic.in/sites/default/files/pocketbook_0.pdf
- Andini, A., S. Bonnet, P. Rousset, and U. Hasanudin (2018). “Impact of Open Burning of Crop Residues on Air Pollution and Climate Change in Indonesia”.
- Beig, G., R. Srinivas, N. S. Parkhi, G. R. Carmichael, S. Singh, S. K. Sahu, S. Maji, and S. Maji. 2019. “Anatomy of the Winter 2017 Air Quality Emergency in Delhi.” Science of the Total Environment 681: 305–16. doi:10.1016/j.scitotenv.2019.04.347.
- Bhuvaneshwari, S., H. Hettiarachchi, and J. N. Meegoda. 2019. “Crop Residue Burning in India: Policy Challenges and Potential Solutions.” International Journal of Environmental Research and Public Health 16 (5): 832. doi:10.3390/ijerph16050832.
- Bikkina, S., A. Andersson, E. N. Kirillova, H. Holmstrand, S. Tiwari, A. K. Srivastava, Ö. Gustafsson, and Ö. Gustafsson. 2019. “Air Quality in Megacity Delhi Affected by Countryside Biomass Burning.” Nature Sustainability 2 (3): 200–205. doi:10.1038/s41893-019-0219-0.
- Bisen, N., and C. P. Rahangdale. 2017. “Crop Residues Management Option for Sustainable Soil Health in Rice-wheat System: A Review.” International Journal of Chemical Studies 5 (4): 1038–1042.
- Brundtland, G. H., M. Khalid, S. Agnelli, S. Al-Athel, and B. Chidzero. 1987. “Our Common Future.” New York 8.
- Cassou, E., S. M. Jaffee, and J. Ru. 2018. The Challenge of Agricultural Pollution: Evidence from China, Vietnam, and the Philippines. Washington, DC: World Bank.
- Cattau, M. E., M. E. Harrison, I. Shinyo, S. Tungau, M. Uriarte, and R. DeFries. 2016. “Sources of Anthropogenic Fire Ignitions on the Peat-swamp Landscape in Kalimantan, Indonesia.” Global Environmental Change 39: 205–219. doi:10.1016/j.gloenvcha.2016.05.005.
- Chatterjee, S., R. Lamba, and E. Zaveri. 2017. “The Water Gap: Environmental Effects of Agricultural Subsidies in India.” Work. https://static1.squarespace.com/static/53e4679ae4b0c4f03d1af29d/t/598e0e1dbe42d629f54bf695/1502481952769/water_crop_6june2017.pdf
- Chowdhury, S., S. Dey, L. Di Girolamo, K. R. Smith, A. Pillarisetti, and A. Lyapustin. 2019. “Tracking Ambient PM2.5 Build-ups in Delhi National Capital Region during the Dry Season over 15 Years Using a High-resolution (1 Km) Satellite Aerosol Dataset.” Atmospheric Environment 204: 142–150. doi:10.1016/j.atmosenv.2019.02.029.
- CII-CESD. 2019. “Impact Assessment Report for Crop Residue Management Project.” http://ciifoundation.in/document/NewsLetter/CII-Final-CRM-Impact-Assessment-Report-05Aug2019.pdf
- Cusworth, D. H., L. J. Mickley, M. P. Sulprizio, T. Liu, M. E. Marlier, R. S. DeFries, P. Gupta, and P. Gupta. 2018. “Quantifying the Influence of Agricultural Fires in Northwest India on Urban Air Pollution in Delhi, India.” Environmental Research Letters 13 (4): 044018. doi:10.1088/1748-9326/aab303.
- Fang, G., and K. Shen. 2018. “Wheat Straw Pulping for Paper and Paperboard Production.” Global Wheat Production,, Chapter 12, 223–239.
- Farmech. 2019. “Report of the Committee Review of the Scheme “Promotion of Agricultural Mechanization for In-Situ Management of Crop Residue in States of Punjab, Haryana, Uttar Pradesh and NCT of Delhi”.Ministry of Agriculture and Farmers Welfare. New Delhi. May 2019. https://farmech.dac.gov.in/revised/1.1.2019/REPORT%20OF%20THE%20COMMITTEE-FINAL(CORRECTED).pdf
- Fuller, G. W., and A. Font. 2019. “Keeping Air Pollution Policies on Track.” Science 365 (6451): 322–323. doi:10.1126/science.aaw9865.
- Gadde, B., S. Bonnet, C. Menke, and S. Garivait. 2009. “Air Pollutant Emissions from Rice Straw Open Field Burning in India, Thailand and the Philippines.” Environmental Pollution 157 (5): 1554–1558. doi:10.1016/j.envpol.2009.01.004.
- Gani, S., S. Bhandari, S. Seraj, D. S. Wang, K. Patel, P. Soni, J. S. Apte, G. Habib, L. Hildebrandt Ruiz, and J. S. Apte. 2019. “Submicron Aerosol Composition in the World’s Most Polluted Megacity: The Delhi Aerosol Supersite Study.” Atmospheric Chemistry & Physics 19: 10. doi:10.5194/acp-19-6843-2019.
- Ghei, D., R. Sane, and K. P. Vadrevu. 2018. “Estimates of Air Pollution in Delhi from the Burning of Firecrackers during the Festival of Diwali.” PloS One 13 (8): e0200371. doi:10.1371/journal.pone.0200371.
- Giglio, L., J. Descloitres, C. O. Justice, and Y. J. Kaufman. 2003. “An Enhanced Contextual Fire Detection Algorithm for MODIS.” Remote Sensing of Environment 87 (2–3): 273–282. doi:10.1016/S0034-4257(03)00184-6.
- Giglio, L., W. Schroeder, and C. O. Justice. 2016. “The Collection 6 MODIS Active Fire Detection Algorithm and Fire Products.” Remote Sensing of Environment 178: 31–41. doi:10.1016/j.rse.2016.02.054.
- Giglio, L., W. Schroeder, J. V. Hall, and C. O. Justice (2018). “MODIS Collection 6 Active Fire Product User’s Guide Revision B.” http://modis-fire.umd.edu/files/MODIS_C6_Fire_User_Guide_B.pdf
- Gontard, N., U. Sonesson, M. Birkved, M. Majone, D. Bolzonella, A. Celli, … B. Schaer. 2018. “A Research Challenge Vision regarding Management of Agricultural Waste in A Circular Bio-based Economy.” Critical Reviews in Environmental Science and Technology 48 (6): 614–654. doi:10.1080/10643389.2018.1471957.
- Guo, H., S. H. Kota, S. K. Sahu, J. Hu, Q. Ying, A. Gao, and H. Zhang. 2017. “Source Apportionment of PM2. 5 In North India Using Source-oriented Air Quality Models.” Environmental Pollution 231: 426–436. doi:10.1016/j.envpol.2017.08.016.
- Gupta, R., and A. Seth. 2007. “A Review of Resource Conserving Technologies for Sustainable Management of the Rice–wheat Cropping Systems of the Indo-Gangetic Plains (IGP).” Crop Protection 26 (3): 436–447. doi:10.1016/j.cropro.2006.04.030.
- Gupta, S. 2019. “Exposure Assessment of Pulmonary Functions of School Going Children Due to Agriculture Crop Residue Burning Practice in Indo-Gangetic Plains of India.” Human and Ecological Risk Assessment: An International Journal 1–16. doi:10.1080/10807039.2019.1689354.
- Gurjar, B. R., K. Ravindra, and A. S. Nagpure. 2016. “Air Pollution Trends over Indian Megacities and Their Local-to-global Implications.” Atmospheric Environment 142: 475–495. doi:10.1016/j.atmosenv.2016.06.030.
- Hiloidhari, M., D. C. Baruah, M. Kumari, S. Kumari, and I. S. Thakur. 2019. “Prospect and Potential of Biomass Power to Mitigate Climate Change: A Case Study in India.” Journal of Cleaner Production 220: 931–944. doi:10.1016/j.jclepro.2019.02.194.
- Jacobson, M. Z. (2019). “Primary Contributors to Net Observed Anthropogenic Global Warming (AGW) from 1750 to 2018 And, Separately, the Natural Greenhouse Effect (NGE)”.
- Jethva, H., D. Chand, O. Torres, P. Gupta, A. Lyapustin, and F. Patadia. 2018. “Agricultural Burning and Air Quality over Northern India: A Synergistic Analysis Using NASA’s A-train Satellite Data and Ground Measurements.” Aerosol and Air Quality Research 18 (7): 1756–1773. doi:10.4209/aaqr.2017.12.0583.
- Jethva, H., O. Torres, and Y. Yoshida. 2019. “Accuracy Assessment of MODIS Land Aerosol Optical Thickness Algorithms using AERONET Measurements over North America”. Atmospheric Measurement Techniques 12(8).
- Jitendra, S. V., I. Kukreti, K. Pandey, D. G. Niyogi, and P. Mukerjee 2017. “India’s Burning Issue of Crop Burning Takes a New Turn.” Down To Earth, 2 June, https://www.downtoearth.org.in/coverage/river-of-fire-57924
- Junpen, A., J. Pansuk, O. Kamnoet, P. Cheewaphongphan, and S. Garivait. 2018. “Emission of Air Pollutants from Rice Residue Open Burning in Thailand, 2018.” Atmosphere 9 (11): 449. doi:10.3390/atmos9110449.
- Kanawade, V. P., A. K. Srivastava, K. Ram, E. Asmi, V. Vakkari, V. K. Soni, C. Sarangi, and C. Sarangi. 2020. “What Caused Severe Air Pollution Episode of November 2016 in New Delhi?” Atmospheric Environment 222: 117125. doi:10.1016/j.atmosenv.2019.117125.
- Kannan, E. 2013. “Do Farmers Need Free Electricity? Implications for Groundwater Use in South India.” Journal of Social and Economic Development 15 (2): 16–28.
- Kaur-Sidhu, M., K. Ravindra, S. Mor, and S. John. 2020. “Emission Factors and Global Warming Potential of Various Solid Biomass Fuel-cook Stove Combinations.” Atmospheric Pollution Research 11 (2): 252–260. doi:10.1016/j.apr.2019.10.009.
- Kayatz, B., F. Harris, J. Hillier, T. Adhya, C. Dalin, D. Nayak, A. D. Dangour, P. Smith, and A. D. Dangour. 2019. ““More Crop per Drop”: Exploring India’s Cereal Water Use since 2005.” Science of the Total Environment 673: 207–217. doi:10.1016/j.scitotenv.2019.03.304.
- Koshal, A. K. 2014. “Changing Current Scenario of Rice-wheat System in Indo-gangetic Plain Region of India.” International Journal of Scientific and Research Publications 4 (3): 1–13.
- Kumar, P., S. Kumar, and L. Joshi. 2015. Socioeconomic and Environmental Implications of Agricultural Residue Burning: A Case Study of Punjab, India (p. 144). Springer Nature.
- Kumar, P., S. K. Rajpoot, V. Jain, S. Saxena, and S. S. Ray. 2019. “Monitoring of Rice Crop in Punjab and Haryana with respect to Residue Burning.” International Archives of the Photogrammetry, Remote Sensing & Spatial Information Sciences XLII-3/W6: 31–36. doi:10.5194/isprs-archives-XLII-3-W6-31-2019.
- Ladha, J. K., H. Pathak, A. T. Padre, D. Dave, and R. K. Gupta. 2003. “Productivity Trends in Intensive Rice–wheat Cropping Systems in Asia.”Improving the Productivity and Sustainability of Rice‐Wheat Systems: Issues and Impacts 65: 45–76.
- Lei, D., L. W. Xi, W. Z. Li, and C. Liu. 2007. “Analysis on the Comprehensive Utilization of Crop Residue in Foreign Countries Modern Agriculture Equipments.” 7: 67–68.
- Li, R., W. Chen, A. Xiu, H. Zhao, X. Zhang, S. Zhang, and D. Q. Tong. 2019. “A Comprehensive Inventory of Agricultural Atmospheric Particulate Matters (PM10 and PM2.5) And Gaseous Pollutants (Vocs, SO2, NH3, CO, NOx and HC) Emissions in China.” Ecological Indicators 107: 105609. doi:10.1016/j.ecolind.2019.105609.
- Liu, T., L. Mickley, S. Singh, M. Jain, R. DeFries, and M. Marlier. 2020. “Crop Residue Burning Practices across North India Inferred from Household Survey Data: Bridging Gaps in Satellite Observations.” Atmospheric Environment: X: 100091.
- Liu, T., M. E. Marlier, R. S. DeFries, D. M. Westervelt, K. R. Xia, A. M. Fiore, G. Milly, D. H. Cusworth, and G. Milly. 2018. “Seasonal Impact of Regional Outdoor Biomass Burning on Air Pollution in Three Indian Cities: Delhi, Bengaluru, and Pune.” Atmospheric Environment 172: 83–92. doi:10.1016/j.atmosenv.2017.10.024.
- Maduna, K., and V. Tomašić. 2017. “Air Pollution Engineering.” Physical Sciences Reviews 2: 12. doi:10.1515/psr-2016-0122.
- Mathur, R., and V. K. Srivastava. 2019. “Crop Residue Burning: Effects on Environment.” In Greenhouse Gas Emissions, edited by Shurpali N., Agarwal A., and Srivastava V,127–140. Singapore: Springer.
- McDonald, A. J., A. K. Srivastava, B. Gerard, and B. Gerard. 2019. “Tradeoffs between Groundwater Conservation and Air Pollution from Agricultural Fires in Northwest India.” Nature Sustainability 2 (7): 580–583. doi:10.1038/s41893-019-0304-4.
- Mehmood, K., S. Chang, S. Yu, L. Wang, P. Li, Z. Li, J. H. Seinfeld, D. Rosenfeld, and J. H. Seinfeld. 2018. “Spatial and Temporal Distributions of Air Pollutant Emissions from Open Crop Straw and Biomass Burnings in China from 2002 to 2016.” Environmental Chemistry Letters 16 (1): 301–309. doi:10.1007/s10311-017-0675-6.
- Merlin, G., and H. Boileau. 2013. “Anaerobic Digestion of Agricultural Waste: State of the Art and Future Trends.” In Anaerobic Digestion: Types, Processes and Environmental Impact, edited by A. Torres. New York: Nova Science Publishers, Inc..
- Mitchell, P. D., Z. Brown, and N. McRoberts. 2018. “Economic Issues to Consider for Gene Drives.” Journal of Responsible Innovation 5 (sup1): S180–S202. doi:10.1080/23299460.2017.1407914.
- Mondal, T., R. P. Yadav, V. S. Meena, M. Choudhury, S. Nath, J. K. Bisht, A. Pattanayak, S. K. Arya, and A. Pattanayak. 2020. “Biomass Yield and Nutrient Content of Dual Purpose Wheat in the Fruit Based Cropping System in the North-Western mid-Himalaya Ecosystem, India.” Field Crops Research 247: 107700. doi:10.1016/j.fcr.2019.107700.
- Nagar, P. K., M. Sharma, and D. Das. 2019. “A New Method for Trend Analyses in PM10 and Impact of Crop Residue Burning in Delhi, Kanpur and Jaipur, India.” Urban Climate 27: 193–203. doi:10.1016/j.uclim.2018.12.003.
- NDRC,2007. “China’s Energy Conditions and Policies2007.”https://en.ndrc.gov.cn/policyrelease_8233/200712/P020191101482236108443.pdf
- Nguyen, T. L. Y., J. E. Hermansen, and L. Mogensen. 2013. “Environmental Performance of Crop Residues as an Energy Source 656for Electricity Production: The Case of Wheat Straw in Denmark.” Applied Energy 104: 633–641. doi:10.1016/j.apenergy.2012.11.057.
- Phairuang, W., M. Hata, and M. Furuuchi. 2017. “Influence of Agricultural Activities, Forest Fires and Agro-industries on Air Quality in Thailand.” Journal of Environmental Sciences 52: 85–97. doi:10.1016/j.jes.2016.02.007.
- PIB,2019. https://pib.gov.in/PressReleseDetailm.aspx?PRID=1590402
- Prasertsri, P. 2017. Thailand Grain and Feed Update—January 2017. Washington, DC, USA: Global Agricultural Information Network USDA Agricultural Service. https://gain.fas.usda.gov/Recent%20GAIN%20Publications/Grain%20and%20Feed%20Update%20-%20January%202017_Bangkok_Thailand_1-18-2017.pdf
- Putrasari, Y., A. Praptijanto, W. B. Santoso, and O. Lim. 2016. “Resources, Policy, and Research Activities of Biofuel in Indonesia: A Review.” Energy Reports 2: 237–245. doi:10.1016/j.egyr.2016.08.005.
- Rafaj, P., G. Kiesewetter, T. Gül, W. Schöpp, J. Cofala, Z. Klimont, … L. Cozzi. 2018. “Outlook for Clean Air in the Context of Sustainable Development Goals.” Global Environmental Change 53: 1–11. doi:10.1016/j.gloenvcha.2018.08.008.
- Ravindra, K., T. Singh, and S. Mor. 2019. “Emissions of Air Pollutants from Primary Crop Residue Burning in India and Their Mitigation Strategies for Cleaner Emissions.” Journal of Cleaner Production 208: 261–273. doi:10.1016/j.jclepro.2018.10.031.
- Raza, M. H., M. Abid, T. Yan, S. A. A. Naqvi, S. Akhtar, and M. Faisal. 2019. “B. Understanding Farmers’ Intentions to Adopt Sustainable Crop Residue Management Practices: A Structural Equation Modeling Approach.” Journal of Cleaner Production 227: 613–623. doi:10.1016/j.jclepro.2019.04.244.
- Rodell, M., I. Velicogna, and J. S. Famiglietti. 2009. “Satellite-based Estimates of Groundwater Depletion in India.” Nature 460 (7258): 999. doi:10.1038/nature08238.
- Sabani, W., D. P. Rahmadewi, K. I. N. Rahmi, M. Priyatna, and E. Kurniawan. 2019. “Utilization of MODIS Data to Analyze the Forest/land Fires Frequency and Distribution (Case Study: Central Kalimantan Province).” IOP Conference Series: Earth and Environmental Science Vol. 243 (No. 1): 012032. March. IOP Publishing.. doi:10.1088/1755-1315/243/1/012032.
- Saggu, G. S., S. K. Mittal, R. Agarwal, and G. Beig. 2018. “Epidemiological Study on Respiratory Health of School Children of Rural Sites of Malwa Region (India) during Post-Harvest Stubble Burning Events.” MAPAN 33 (3): 281–295.
- Sawlani, R., R. Agnihotri, C. Sharma, P. K. Patra, A. P. Dimri, K. Ram, and R. L. Verma. 2019. “The Severe Delhi SMOG of 2016: A Case of Delayed Crop Residue Burning, Coincident Firecracker Emissions, and Atypical Meteorology.” Atmospheric Pollution Research 10 (3): 868–879. doi:10.1016/j.apr.2018.12.015.
- Schroeder, W., P. Oliva, L. Giglio, and I. A. Csiszar. 2014. “The New VIIRS 375 M Active Fire Detection Data Product: Algorithm Description and Initial Assessment.” Remote Sensing of Environment 143: 85–96. doi:10.1016/j.rse.2013.12.008.
- Singh, R., D. B. Yadav, N. Ravisankar, A. Yadav, and H. Singh. 2020. “Crop Residue Management in Rice–wheat Cropping System for Resource Conservation and Environmental Protection in North-western India.” Environment, Development and Sustainability 22 (5): 3871–3896. doi:10.1007/s10668-019-00370-z.
- Singh, R. P., and D. G. Kaskaoutis. 2014. “Crop Residue Burning: A Threat to South Asian Air Quality.” Eos, Transactions American Geophysical Union 95 (37): 333–334. doi:10.1002/2014EO370001.
- Singh, S., J. R. Park, and J. Litten-Brown. 2011. “The Economic Sustainability of Cropping Systems in Indian Punjab: A Farmers’ Perspective.” No. 726-2016-50056, pp. 1–12.
- Streets, D. G., T. C. Bond, G. R. Carmichael, S. D. Fernandes, Q. Fu, D. He, Z. Klimont, et al. 2003. “An Inventory of Gaseous and Primary Aerosol Emissions in Asia in the Year 2000.” Joyrnal of Geophysical Reearch Atmospheres 108 (D21).
- Sun, D., Y. Ge, and Y. Zhou. 2019. “Punishing and Rewarding: How Do Policy Measures Affect Crop Straw Use by Farmers? An Empirical Analysis of Jiangsu Province of China.” Energy Policy 134: 110882. doi:10.1016/j.enpol.2019.110882.
- Sun, J., H. Peng, J. Chen, X. Wang, M. Wei, W. Li, A. Mellouki, Q. Zhang, W. Wang, and A. Mellouki. 2016. “An Estimation of CO2 Emission via Agricultural Crop Residue Open Field Burning in China from 1996 to 2013.” Journal of Cleaner Production 112: 2625–2631. doi:10.1016/j.jclepro.2015.09.112.
- TERI,2015. “Climate Resilient Green Growth Strategy for Punjab: Towards an Inclusive Development Agenda, Summary for Policymakers.” https://www.teriin.org/projects/green/pdf/Punjab_SPM.pdf
- Tripathi, R., K. C. Moharana, A. D. Nayak, B. Dhal, M. Shahid, B. Mondal, … A. K. Shukla. 2019. “Ecosystem Services in Different Agro-climatic Zones in Eastern India: Impact of Land Use and Land Cover Change.” Environmental Monitoring and Assessment 191 (2): 98. doi:10.1007/s10661-019-7224-7.
- UNEP. (2011). “Towards a Green Economy: Pathways to Sustainable Development and Poverty Eradication.” www.unep.org/greeneconomy
- UNEP (United Nations Environment Programme), 2009. “Converting Agricultural Waste into a Resource.” https://wedocs.unep.org/bitstream/handle/20.500.11822/7614/WasteAgriculturalBiomassEST_Compendium.pdf
- Vasudeva, V. 2019. “Stubble Burning Cases on the Rise in Punjab.” https://www.thehindu.com/news/national/other-states/stubble-burning-cases-on-the-rise-in-punjab/article29769546.ece
- Weersink, A., and D. Pannell. 2017. “Payments versus Direct Controls for Environmental Externalities in Agriculture.” In Oxford Research Encyclopedia of Environmental Science,Oxford University Press. https://oxfordre.com/environmentalscience/view/10.1093/acrefore/9780199389414.001.0001/acrefore-9780199389414-e-520
- Wei, J., G. Liang, J. Alex, T. Zhang, and C. Ma. 2020. “Research Progress of Energy Utilization of Agricultural Waste in China: Bibliometric Analysis by Citespace.” Sustainability 12 (3): 812. doi:10.3390/su12030812.
- Wise, R. M., I. Fazey, M. S. Smith, S. E. Park, H. C. Eakin, E. A. Van Garderen, and B. Campbell. 2014. “Reconceptualising Adaptation to Climate Change as Part of Pathways of Change and Response.” Global Environmental Change 28: 325–336. doi:10.1016/j.gloenvcha.2013.12.002.
- Wolfe, R. E., G. Lin, M. Nishihama, K. P. Tewari, J. C. Tilton, and A. R. Isaacman. 2013. “Suomi NPP VIIRS Prelaunch and On‐orbit Geometric Calibration and Characterization.” Journal of Geophysical Research: Atmospheres 118 (20): 11–508.
- World Air quality report. 2018. https://www.who.int/airpollution/data/cities/en/
- World Air quality report (2019), “Region & City PM2.5 Ranking, IQAir”.
- Yin, S., X. Wang, Y. Xiao, H. Tani, G. Zhong, and Z. Sun. 2017. “Study on Spatial Distribution of Crop Residue Burning and PM2. 5 Change in China.” Environmental Pollution 220: 204–221. doi:10.1016/j.envpol.2016.09.040.
- Zayed, M. S. 2018. “Enhancement the Feeding Value of Rice Straw as Animal Fodder through Microbial Inoculants and Physical Treatments.” International Journal of Recycling of Organic Waste in Agriculture 7 (2): 117–124. doi:10.1007/s40093-018-0197-7.
- Zhang, L., Y. Liu, and L. Hao. 2016. “Contributions of Open Crop Straw Burning Emissions to PM2. 5 Concentrations in China.” Environmental Research Letters 11 (1): 014014. doi:10.1088/1748-9326/11/1/014014.
- Zhuang, Y., D. Chen, R. Li, Z. Chen, J. Cai, B. He, Y. Huang, N. Cheng, and Y. Huang. 2018. “Understanding the Influence of Crop Residue Burning on PM2. 5 And PM10 Concentrations in China from 2013 to 2017 Using MODIS Data.” International Journal of Environmental Research and Public Health 15 (7): 1504. doi:10.3390/ijerph15071504.