
 ?Mathematical formulae have been encoded as MathML and are displayed in this HTML version using MathJax in order to improve their display. Uncheck the box to turn MathJax off. This feature requires Javascript. Click on a formula to zoom.
ABSTRACT
Land use and land cover (LULC) play a significant role in carbon regulation. South-China accounts for ~65% of China’s carbon sink. In Xishuangbanna (South-China), rubber is expanding rapidly creating an urgent need to understand and monitor LULC change and how spatial variation affects carbon storage (CS). This is vital for the formation and implementation of better land use management practices. We studied LULC changes of 22-year period; addressing how these changes have affected the CS. We quantified LULC changes between1988 and 2010 using remote sensing methods and calculated CS changes using InvEST. Results showed that between 1988 and 2010, the rate of deforestation accelerated to 203.2 km2 y−1 and ~23% of forest were lost. Conversion of natural forest to rubber was responsible for 78% of this deforestation. Rubber expansion rate was 153.4 km2 y−1. Changes to LULC drove a temporal CS reduction 0.223 Tg C/km2. Local stakeholders have strong economic interest in converting land to more profitable plantations. Government efforts is required to control land conversion through new policies and incentives to retain natural forest. Assessment of specific potential land use change will be required to avoid promoting the conversion of high carbon storage land uses to low carbon storage land uses.
Introduction
Land use changes and rubber expansion in Southeast Asia, China and Xishuangbanna
In the tropics the highest rates of deforestation and forest degradation have been recorded in Southeast Asia. In Southeast Asia’s humid tropics, there has been widespread expansion of large monocultures of oil palm (Elais guineensis) and rubber (Hevea brasiliensis) plantations, across areas previously covered by native lowland forests (DeFries, Houghton, and Hansen et al. Citation2002). This region hosts a high concentration of endemic species, which could be obliterated by habitat destruction. By 2100 A.D., Southeast Asia could potentially lose 13% to 42% of its species, of which at least 50% are endemic (Koh and Wilcove Citation2008).
Land use change can adversely affect ecosystems and the ecosystem services which they provide. These include carbon sequestration, soil quality, water regulation, and climate regulation (Defries, Foley, and Asner Citation2004; Laganiere, Angers, and Pare Citation2010; Sauer et al. Citation2012; Deng, Wang, and Li et al. Citation2014; Deng and Shangguan Citation2016). Global climate regulation is perhaps the most important ecosystem service, including sequestration or emission of greenhouse gases (Perrings et al. Citation2011). Lal (Citation2004a) estimated that the total soil carbon pool is four times greater than the biotic pool and three times greater than the total atmospheric pool. Although there have been some previous carbon storage experiments in Xishuangbanna, these have been limited to specific study areas, which are not necessarily representative of how overall carbon storage could have changed across the entirety of Xishuangbanna (Nizami, Yiping, and Liqing et al. Citation2014; Yang et al. Citation2015; Yang, Blagodatsky, and Lippe et al. Citation2016). Therefore, it is essential to understand carbon fluxes and storage in terrestrial carbon sinks in such highly biodiverse areas as Xishuangbanna. Temporal mapping of land use changes and ecosystem services is a promising technique to approach these issues.
China’s economy has developed at an unprecedented rate (Gong Citation2014). A large proportion of China’s land area is devoted to agriculture and plantations. The developing economy has produced a high demand for rubber, leading to mass conversion of land use to rubber plantations (Sarathchandra, Dossa, and Ranjitkar et al. Citation2018). Rubber now provides an important cash income to Xishuangbanna’s rural villagers, who lack alternative cash income sources (Yi, Cannon, and Chen et al. Citation2014a).
The rapid expansion of rubber plantations could have serious repercussions. Rubber plantations have low carbon storage compared to the natural forest ecosystems that they are replacing (Li and Fox Citation2012; De Blécourt, Brumme, and Xu et al. Citation2013). The loss of natural habitats is especially likely to cause species extinctions if it occurs in biodiverse ecosystems with a high number of endemic species. Our study area of Xishuangbanna is part of the Indo-Burma biodiversity hotspot (Myers, Mittermeier, and Mittermeier et al. Citation2000). Xishuangbanna’s natural forests are particularly biodiverse. Although they comprise only 0.2% of China’s landmass, they harbor over 25% of its fauna and flora (Liu, Linderman, and Ouyang et al. Citation2001).
China’s domestic demand for rubber far exceeds its production. China has become a net importer of rubber, accounting for 30% of global rubber consumption (FAO Citation2010). This high demand has driven land use conversion to rubber plantations, even in areas with high biodiversity, which provide essential ecosystem services. Such loss of ecosystem services is likely to undermine the productivity of the very land uses that have displaced them (Li, Aide, and Ma et al. Citation2007).
Early studies of the expansion of monoculture plantations and agriculture in tropical and subtropical landscapes predicted a decrease in biodiversity, ecosystem services and above- and below-ground carbon stocks (Guo and Gifford Citation2002; Sodhi et al. Citation2004; Bunker, Declerck, and Bradford et al. Citation2005; Xu and Melick Citation2007), although they did not directly measure these outcomes. In this study we tested their predictions by examining land use changes in Xishuangbanna over the past two decades and how these have affected carbon storage capacity.
Implementation of the United Nations Framework Convention on Climate Change (UNFCCC) requires reporting on the changing carbon storage capacity of forest land, cropland, and grassland areas. For such reporting, we need to quantify the potential of different land uses to sequester and store carbon (Zhiyanski, Gikov, and Nedkov et al. Citation2016a). Ecosystem service modeling of carbon storage is one means to approach this task. This requires simulation of supply, use and demand for ecosystem services, based on ecological and socio-economic data (Burkhard and Maes Citation2017).
Previous studies in Xishuangbanna have addressed the potential consequences of converting rain forest to rubber plantations (Xu et al. Citation2005; Noordwijk et al. Citation2008; Ziegler et al. Citation2009; Tan et al. Citation2011; Li and Fox Citation2012; Meyer et al. Citation2015). However, Tan et al. (Citation2011) stated that the ecological and environmental consequences of land use conversions remain uncertain. Studies in other tropical areas found reductions in biomass (above- and below-ground), litter and soil carbon stocks (Schrotha, Angelo, and Teixeira et al. Citation2002; Nair, Kumar, and Nair Citation2009) and suggested that agroforestry would be a possible approach to restoring carbon sequestration in deforested lands. Yu et al. (Citation2014) and Yang, Blagodatsky, and Lippe et al. (Citation2016) evaluated the carbon storage capacities of different vegetation types, but we found no studies taking a holistic view of how land use changes as a whole affected carbon storage in Xishuangbanna. Given the importance of carbon storage in regulating climate, it is clear that more studies are needed regarding the impact of land use change on carbon storage. Consideration is also required of how far reversing land use change could also reverse current loss of carbon storage capacity.
A proper understanding of a system is essential for successful management; a principle that is true for ecosystem services. Research is necessary to guide and support the management of natural resources, ecosystems and socio-ecological systems (Sarathchandra, Kambach, and Ariyarathna et al. Citation2018). Warren-Thomas, Dolman, and Edwards (Citation2015) stated that by 2024 an estimated additional 4.3–8.5 million ha of rubber plantations will be required to satisfy the increasing demand for rubber. Such expansion would threaten a significant portion of existing forest areas, therefore it is essential to measure ecosystem services if we are to understand how ecosystems contribute to human wellbeing. This is vital to forming and supporting land use policies which would have a positive impact on natural resource management.
In our current era, the basic resources for both humans and nature are threatened by both global and regional pressures (IPBES Citation2019). Consequently, principles for measuring and valuation of ecosystem services are attracting attention for their potential to assist the resolution of environmental dilemmas (Nerlich, Graeff-Honninger, and Claupein Citation2013). Appropriate methods for measuring or valuation of ecosystem services depend on variety of factors, such as the type of ecosystem service and the study region (Malinauskaite et al. Citation2021). Ecosystem services are generally evaluated in terms of their biophysical, economic and socio-cultural contributions. For example, socio-cultural valuation can be based on literature reviews, stakeholder mapping, observations, interviews or preference surveys. (Bélisle, Wapachee, and Asselin Citation2021). Economic valuations of ecosystem services can use methods including benefit transfer (Zhou, Wu, and Gong Citation2020), choice experiments and market data (Hynes, Chen, and Vondolia et al. Citation2021; Kieslich and Salles Citation2021).
It is especially important not to ignore the roles of stakeholders and economic forces. Currently, most models that forecast ecosystem services and biodiversity losses as a result of habitat loss implicitly assume that passive sampling can be extrapolated from larger to smaller habitats. However such scenario projections typically ignore demographic effects (Chase, Blowes, and Knight et al. Citation2020), market incentives and government policies that can have crucial impacts on the direction and extent of changes.
Considering these factors, this paper was designed with the following objectives: (1) to analyze the changes in land use and land cover across the study area over specific study periods of 1988 −2010; (2) to compare changes in land use and calculated carbon storage among the beginning, middle and end of the study period; (3) to evaluate the effect of land use conversion on total carbon storage of the studied landscape; and (4) to assess the implications for policy formation to reduce the potential carbon storage losses that could arise from further land use change.
Materials and methods
Study site
Xishuangbanna Dai Autonomous Prefecture (19,164 km2) is located in Yunnan Province, in Southwestern China, bordering Laos and Myanmar on the upper course of the Mekong River (Lü et al. Citation2010). Most of its land area is categorized as mountainous, with an elevation range of 475 m to 2,428 m (Li et al. Citation2008). Xishuangbanna records annual precipitation of 1,493 mm. It has a typical tropical monsoon climate with a rainy season between May and October and a dry season between November and April. Due to its climate and geography, Xishuangbanna is considered to be a transition zone, which has the highest level of biodiversity in China (Hongmao et al. Citation2002; Lü et al. Citation2010).
Xishuangbanna supports five types of natural forest: tropical seasonal rain forest (at elevations < 900 m), tropical montane rainforest (700 m – 1,500 m), monsoon forest (< 900 m), monsoon forest located on limestone (< 800 m) and sub-tropical evergreen broad-leaved forest (1,000 m – 1,500 m). Each forest type hosts a unique assemblage of faunal and floral diversity (Zhang and Cao Citation1995).
Data acquisition, processing and analysis
The administrative data, including boundaries of the study area and remote sensing data used for this study were obtained from the Center for Mountain Ecosystem Studies, Kunming Institute of Botany, Chinese Academy of Sciences, and from two previous studies (Xu, Grumbine, and Beckschäfer Citation2014b; Chen, Yi, and Schmidt-Vogt et al. Citation2016). However, neither of those studies had addressed how the total carbon storage of the landscape has been affected during the recent period of intensive rubber expansion. We briefly summarize our methodology here.
Remote sensing data of land use types
Land use types were mapped based on a Landsat TM image and a Landsat ETM+ image (path/row number: 130/45, acquisition dates: 2 February 1988 and 28 March 2002, spatial resolution of 30 m). We used this study window period because few published studies have focused on this time period of escalated rubber expansion.
Radiometric and geometric rectification had already been applied to these images (L1T products) by the imagery supplier. For 2010, a published map by Xu, Grumbine, and Beckschäfer Citation2014b) was used and the corresponding RapidEye (RE) satellite images were reanalyzed, using a refined classification scheme that enables rubber plantations and other land use types to be distinguished. During January and February of 2010, the 48 RapidEye (RE, ortho product level 3A, spatial resolution of 5 m) scenes were captured from TM, ETM+, and RE images that were registered in Universal Transverse Mercator Projection (UTMg WGS 84). We used high-resolution RE imagery because it allows superior identification of different vegetation types, via its use of red edge spectral bands in combination with with other spectral bands. We thereby developed a land cover classification scheme for the identification of forests, farmlands, rubber, shrubs, banana, barren land, tea, water and construction ().
Table 1. Land use transition matrix for the study area between 1988–2010 (area in km2)
This classification was quantified empirically via verification based on the different land use types shown in Google Earth Quickbird imagery. We obtained 460 GPS points in the study area between 2009 and 2011. Out of these 460 GPS points, we recorded land cover information for 308 points. Image classification was done with the software eCognition 8.0 (Trimble, U.S.), using membership function and nearest neighbor classifiers. Associated threshold values of certain object features were determined and implemented in class membership functions. The object-based classification using the membership function classifier was also applied for identification of land cover in Landsat images. Training areas were acquired from ground-truthed GPS points and high-resolution satellite images obtained from Google Earth (DigitalGlobe, U.S.). RE images were classified scene by scene and subsequently merged. Freely accessible DigitalGlobe archives played an important role in assessing the accuracy of our classifications (Olofsson, Foody, and Herold et al. Citation2014). We randomly selected 71 land use reference points for accuracy assessment for 2001 and 2002. These were generated based on high-resolution images from Google Earth. For verification of RE image classification for the year 2010, we used an additional combination of 361 points that had been obtained from the field and from Google Earth in 2009 and 2010 (Chen, Yi, and Schmidt-Vogt et al. Citation2016).
Land use types in 2010 derived from RE images were resampled to 30 m to match the resolution of RE images from 1988 and 2002. This resampling of the 2010 layer for rubber plantations from 5 m to 30 m resulted in a change of less than 1% in the calculated total rubber plantation area (Chen, Yi, and Schmidt-Vogt et al. Citation2016). Prior to analysis, all maps had been projected to a common grid system; the Universal Transverse Mercator (UTM) WGS84 reference system. All map spatial analyses were done in ArcGIS 10.2.
Quality of information derived from remotely sensed data should be determined by an accuracy assessment. This is most reliable when used along with ground reference data or data derived from aerial photographs at or near the time of the satellite overpass (Tao et al. Citation2015). We used the Kappa coefficient to evaluate the accuracy of the classification methods which we used to produce land use/land cover maps (see supplementary materials for details). Thereafter, the raster layers of land use from 1988, 2002, and 2010 were used to analyze land use conversion for each specific time period and to calculate carbon storage capacity.
Calculating carbon storage across Xishuangbanna
To determine the parameters for the levels of carbon storage for our calculations, we considered the carbon present in each land use type. Ten land use categories were identified in the study region (). For current carbon storage (total weight of carbon stored per square kilometer, Mg C/km2) values for each land use category, we referred to previous carbon related studies in Xishuangbanna (Jia, Zheng, and Zhang Citation2006; Li et al. Citation2008; Guirui et al. Citation2010; Yi, Cannon, and Chen et al. Citation2014a; Yang et al. Citation2015; Yang, Blagodatsky, and Lippe et al. ; Lu et al. Citation2016). We applied the carbon storage and sequestration model available in InVEST (Integrated Valuation of Ecosystem Services and Tradeoffs) to estimate temporal carbon storage. InVEST is preferable to other models for its ability to demonstrate ES results spatially in a visualized map. Moreover, InVEST consists of sub models which can be selected by users according to their specific needs and precision of available data (Nelson, Ennaanay, and Stacie et al. Citation2015; Fang, Bai, and Jiang et al. Citation2020).
Table 2. Main land use changes and their mean elevation in Xishuangbanna between 1988 and 2010
The InVEST carbon storage model partitions carbon storage into four components: above-ground, below-ground, soil, and dead organic matter. Grid land cover data is used to provide the input to the model. It calculates the total carbon in each pool and provides an estimate of total carbon storage across the whole landscape (Sharp, Chaplin-kramer, and Wood et al. Citation2015; Zhiyanski, Gikov, and Nedkov et al. Citation2016b, a).
InVEST is a GIS-based tool which was designed to estimate ecosystem services. It consists of appropriate models that base their calculations on land use and land cover patterns. It is an appropriate tool to inform and improve natural resource management and investment decisions. Models in InVEST are spatially explicit, and their outputs are in the form of maps. These maps can display either biophysical or economic variables (Sharp, Chaplin-kramer, and Wood et al. Citation2015; Zhiyanski, Gikov, and Nedkov et al. Citation2016a). We used the 3.1.1 version of InVEST tools, at a resolution of 30 m × 30 m. We opted to include carbon storage in all 4 pools. This was intended to avoid the bias associated with studies that only estimate above ground biomass – which will generally underestimate total carbon storage (Sierra, Del Valle, and Orrego et al. Citation2007).
Calculating land use change and its impact on carbon storage
We mapped land cover data for Xishuangbanna from the years 1988, 2002 and 2010. We calculated the annual rate of land use change separately for each land use type from equation 1 (Sarathchandra, Dossa, and Ranjitkar et al. Citation2018). This equation assumes linear conversion rates. To account for temporal variation in land use conversion, we analyzed separately the data from 1988 to 2002 and from 2002 to 2010.
Table
Where:
LU change = rate of land use change per year (km2 year−1),
t1 = year of first data recording
t2 = year of second data recording
and
= area of land use type (km2) at times t2 and t1
The contribution of each land use type to total deforestation was measured using the following formula:
Moreover, we quantified the LULC dynamics by conducting map to map comparisons using overlay function of ArcMap 10.6 in ArcGIS. Here we obtained a two-way cross-matrix and used it to describe the main land use changes in the study area. The quantity of conversion from one LULC type to another over the study period was determined by conducting cross tabulation analysis on a pixel-by-pixel basis (Falahatkar, Soffianian, and Khajedddin et al. Citation2011; Zhang, Li, and Chen Citation2011; Zhang, Zhang, and Feng et al. Citation2017; Butt et al. Citation2015; Hu, Batunacun, and Zhuang Citation2019).
We then mapped the carbon storage in each land cover and land use type and evaluated how changes in vegetation cover have affected the total carbon storage capacity of Xishuangbanna. We calculated carbon storage for each land use type using linear regression (Lian Citation2015):
Table
Where:
= the standard error of the regression line
To determine how much of the variation of y is due to variation in time n, we calculated the total variation in y (Lian Citation2015):
Where:
= mean value of y
= standard error of the mean of y
We calculated the percentage of the total variation in y which was not due to variation in n (time). The R2 value gives the residual proportion of the variation which is not described by the regression of n with y:
Where:
R2 = the coefficient of determination of the regression line.
= proportion of carbon storage due to y
Finally, carbon storage change during the study period was calculated using
Where:
ΔC = carbon storage change (tons year−1)
= carbon storage at time
= carbon storage at time
Results
Accuracy assessment
The accuracy of the land use types identification of maps produced for 2002 were 88.7% and the overall accuracy for all land use land cover classes for 2010 was 87.5%, with a Kappa coefficient of 0.82.
Deforestation and associated land use change
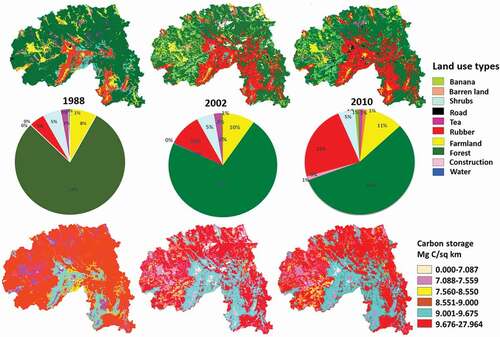
In 1988, 78.9% of Xishuangbanna was covered by natural forest, followed by farmlands 9.5%, natural shrubs 5% and rubber 4.5%. By 2010, 23.3% of forest cover had been destroyed. During the same period, land covered by rubber plantations increased by 18.2%, followed by farmland 3.1%. All other natural land cover types had reduced in area by 2010, including shrubs by 0.3% and water by 0.01% ().
Figure 1. Location of the study site relative to: (a) adjacent countries (derived from Xu, Fox, and Xing et al. (Citation1999)) (b) the provincial boundaries of China (a red square marks the position of Yunnan Province (c) Yunnan Province (a red square marks the position of Xishuangbanna) (d) Xishuangbanna Prefecture and its three administrative counties. The entire land area shown in was included in this study)
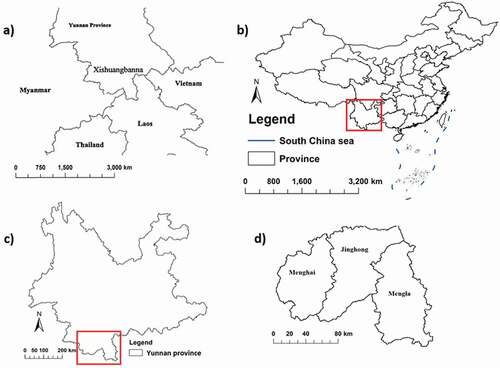
Figure 2. Carbon storage change for six land use types during 1988, 2002 and 2010
The transition matrix for the study area () shows how each LULC category had changed from 1988 to 2010. The planting of rubber monocultures was responsible for 70.4% of this deforestation, followed by agriculture (23.2%), construction of buildings and roads (2.8%) and banana plantations (3.3%). This rapid expansion of rubber plantations has largely replaced diverse tropical seasonal rainforests (Fig. S1). These had previously occupied the areas that are most suitable for rubber cultivation (Warren-Thomas, Dolman, and Edwards Citation2015).
Total forest cover in Xishuangbanna had reduced by 203.2 km2 y−1. Meanwhile, rubber plantations had expanded by 153.4 km2 y−1. Further major land use changes included an increase in banana plantations and construction. Despite a high demand for tea throughout Asia, the land area devoted to tea cultivation diminished by 71% between 1988 and 2010 ().
Our spatial analyses demonstrated that, since 1988, rubber had been planted at progressively higher elevations. This upward range expansion had contributed to the reductions in the range of forests and other natural land uses. Previously, inaccessible high elevation habitats had been comparatively safe from conversion to rubber plantations.
Changes in carbon storage
In 2010, lowland forests were the land use type which had the highest mean carbon storage, at 119.9 Mg C/km2 (). These lowland forests include tropical rainforest, tropical seasonal rainforest and mixed forest with bamboo.
Carbon storage in banana plantations, farmlands and rubber plantations was calculated to have increased over time, due to increases in their land use cover. In contrast, for both natural land use types (forest and shrubs) and tea plantations, carbon storage decreased over time.
In 2010, rubber plantations held a mean carbon stock of 17.3 Mg C/km2. The lowest carbon stock was for tea plantations. In 1988, forests held a mean carbon stock of 156.3 Mg C/km2 while rubber and tea plantations held 7.1 Mg C/km2 and 0.57 Mg C/km2 respectively. The highest individual land cover carbon storage capacity for these three time periods was for natural forest, followed by rubber plantations, banana plantations, shrubs and tea plantations.
Carbon storage changes caused by land use change during 1988 −2010
Carbon storage calculations for Xishuangbanna during 1988 to 2010, based on the InVEST modeling tool, showed an overall loss of carbon storage in the region during this period ().
Xishuangbanna’s total carbon storage in 1988 was 0.61 Tg C. By 2002, this had fallen to 0.47 Tg C, and to 0.41 Tg C by 2010 (). This represents a decrease of 0.2 Tg C, over a 22-year period. The average annual decrease between the years 1988 to 2010 was 0.01 Tg C year−1. These reductions in carbon storage will have resulted in a corresponding degree of increased carbon emissions.
Figure 3. Land use changes (top and middle) and consequent carbon storage change (bottom) between 1988 (left), 2002 (center) and 2010 (right)
Discussion
Deforestation and drivers of land use change
During our study period, our results show that Xishuangbanna suffered heavy deforestation; losing 23.3% of its natural forest area. Meanwhile, rubber plantations were established across 18.2% of its land area. Expansion of rubber plantations has generally driven loss of natural forest (Qiu Citation2009; Xu, Grumbine, and Beckschäfer Citation2014a).
Historical records of changing land ownership in China give supporting evidence of widespread changes in land use. In the 1950s, the Chinese government established large-scale state-owned rubber plantations in Xishuangbanna. In the early 1980s, China introduced the “Household Responsibility System.” This enabled smallholder farmers to plant rubber (Chapmen Citation1991). During the 1960’s, monoculture rubber plantations began to replace Xishuangbanna’s lowland forest. By the 1990’s, swidden agricultural lands were also being converted to rubber plantations. This situation was worsened by the land use definitions used in government policy documents and national statistics, which did not distinguish between rubber and natural forest (Van Noordwijk, Tata, and Xu et al. Citation2012). Because China’s policies grouped all natural forest types and plantations together as a single land use category, incentives for afforestation were granted to any green cover type regardless of whether these represented economic plantations or recovery of natural habitat. Thus, a policy intended to promote protection and reestablishment of natural forests actually promoted conversion of natural forest to rubber.
In the early 2000’s, income from rubber plantations boosted average rural incomes in Xishuangbanna by 10-fold (Richard, Citation2009). By 2009, rubber yield prices had reached approximately 15,000 RMB ha−1 year−1, whereas farmers could only earn 2,000–3,000 RMB ha−1 year−1 from tea or rice (Qiu Citation2009). This provided a strong economic incentive for the rapid expansion of rubber in Xishuangbanna. However, the pursuit of these economic incentives came at the cost of serious negative environmental impacts (Ziegler et al. Citation2009).
Our analyses also demonstrated other important changes to land use practices during our study period, including the introduction of short-term cash crops and infrastructure development (roads and other construction). Expansion of road networks has facilitated the transport of rubber and bananas from plantations to markets. Banana trees are fast-growing, giving a short-term profit, which has encouraged farmers to replace rice paddy fields with banana plantations.
Carbon storage changes triggered by the conversion of land use: consequences and mitigation
Between 1988 and 2010, we found that the carbon storage in Xishuangbanna decreased by 0.223 Tg C km−2. Although the total percentage of cultivated and forest land cover did not drastically change, conversion between specific land use types was responsible for this overall loss of carbon storage. Changes in the carbon storage capacity were determined by which land use types were converted to rubber. For example, conversion of other agricultural crops (which have a low carbon storage capacity), would cause less loss of carbon storage capacity than large scale conversion of natural forest (which has the highest carbon storage capacity) to rubber plantations. Previous studies indicate that the primary mechanism by which land use conversion affects carbon storage capacity is by reducing total plant biomass (Jiang, Apps, and Peng et al. Citation2002; Schrotha, Angelo, and Teixeira et al. Citation2002; Mao, Wang, and Dai Citation2009; Guirui et al. Citation2010).
Differences in total carbon storage between the base year of 1988 and our LULC map of 2010, correspond to land cover change during this period. The clearest contributing factor was a reduction in natural forest cover from 79% to 56%. Other variables that would have contributed to changes in the carbon storage capacity of these ecosystems would be: changes in the soil conditions, harvesting of timber, fires, tree maturity, average annual precipitation and temperature (Wu, Li, and Zhou et al. Citation2018). Previous studies of China’s carbon sequestration potential have recorded that Southern China accounts for > 65% of China’s total carbon sink (Fang et al. Citation2007; Guirui et al. Citation2010). It will therefore be of especial importance to implement suitable policies in Southern China to avoid or minimize the conversion of land uses with a higher carbon storage capacity to those with a lower carbon storage capacity.
Land use change comprises both changes in overall land cover of each land use type and in species composition (Meyer et al. Citation2015). For example, different tree species within natural forest have different growth rates, in addition to differing above- and below-ground biomass, and thus differing abilities to act as carbon sinks (Chi, Guo, and Fang et al. Citation2017). Agricultural crops also differ in their carbon storage capacity (Cantarello, Newton, and Hill Citation2011). Perennial crops are likely to store more carbon as above-ground biomass. Whether annual crops act as carbon sinks or sources could depend on agricultural practices, including tillage methods (Udawatta and Jose Citation2012; Kim, Kirschbaum, and Beedy Citation2016).
Keeping organic carbon in terrestrial sinks will be crucial to limiting climate change. Forests, grasslands, peat swamps, and other terrestrial ecosystems collectively store much more carbon than does the atmosphere (Lal Citation2004b). However, current shifts in global land use are reducing terrestrial carbon storage – turning previous carbon sinks into potential carbon sources (Nair, Kumar, and Nair Citation2009). Potential feedbacks between soil processes and increasing temperatures could further exacerbate the situation (Smith Citation2004).
The Intergovernmental Panel on Climate Change (IPCC) has stated that it will be impossible to keep global temperatures at safe levels unless there is also a transformation in human activities in food production and land management. Humans currently exploit 72% of the planet’s ice-free surface. Agriculture, forestry and other human land uses jointly account for almost a quarter of greenhouse gas emissions (IPCC Citation2019). As human populations increase, this situation will worsen, unless active steps are taken to protect land uses that act as carbon sinks and avoid conversion to land uses that act as carbon sources. Action is needed at a landscape level, to keep carbon sequestered for longer in the form of organic biomass. Globally, forests act to capture and retain large quantities of carbon (Espinoza-Domínguez et al. Citation2012). Therefore, conversion of deforested land to agroforestry has been proposed as an effective means to enhance carbon sequestration (Nair, Kumar, and Nair Citation2009) while diversifying income generation for vulnerable farming sectors. In such agroforestry ecosystems, above-ground species diversity affects their effectiveness in carbon storage and sequestration. Therefore, to maintain higher carbon storage capacity, agroforestry practices should be selected that support higher plant species diversity. This is of particular importance in tropical forests, where there is an especially strong relationship between higher plant species diversity and higher carbon storage (Liu, Herbert, and Hashemi et al. Citation2006; Henry, Tittonell, and Manlay et al. Citation2009; Laban, Metternicht, and Davies Citation2018)
4.3 Improving land use management practices for rubber dominated landscapes: recommendations based on the global scientific literature
As the landscape of Xishuangbanna is being increasingly converted to rubber plantations, it is essential to develop better land use management systems which maintain ecosystem health and support the local economy. Xishuangbanna has one of the most fertile soils in China, making it suitable for a range of agroforestry applications, including coffee, tea and cocoa. Agroforestry practices and intercropping species should be selected that enhance specific ecosystem services. Carbon storage potential differs between agroforestry systems. In Mexico, coffee agroforestry and intercropping was found to have higher carbon storage potential than coffee monocultures (Espinoza-Domínguez et al. Citation2012; Hergoualc’h, Blanchart, and Skiba et al. Citation2012). In Xishuangbanna, if coffee plants were grown under shade trees (Albizia), there was increased above- and below-ground biomass (Dossa et al. Citation2008). Thus, one means to mitigate the negative impact of rubber plantations in Xishuangbanna would be to promote the use of rubber as the shade tree for coffee.
Some other land use types have even lower carbon storage than rubber plantations, so it might be damaging to promote the widespread conversion of land already planted with rubber to other crops. In Ghana, the aboveground carbon sequestration potential of rubber plantations (214 t C ha −1) was found to be higher than that of orange (76 t C ha −1), cocoa (65 t C ha −1) and palm (45 t C ha −1) plantations (Kongsager, Napier, and Mertz Citation2013). More experiments on carbon sequestration are required in Xishuangbanna in order to select the best intercropping species for agroforestry, but intercropping of rubber with cocoa appears to be particularly promising. One study of rubber – cocoa intercropping found a total carbon storage of 91.5 Mg C ha −1. Of this, 84.7 Mg C ha −1 were stored in rubber trees, 5.22 Mg C ha −1 in cacao trees and 1.67 Mg C ha −1 in litter (Cotta, Jacovine, and Hn De et al. Citation2008). If further research supports these findings, then we would suggest that intercropping of rubber trees with coffee and cacao trees could simultaneously achieve the multiple goals of increasing carbon sequestration, enhancing ecosystem services, and diversifying crops. If these intercropping systems are further combined with crops that are in high demand locally, it would reduce the risk to farmers posed by the failure of any single crop. Crop diversification is an effective means to mitigate against disease, flooding, and drought, as well as against the potential effects of future climate change (Read, Beerling, and Cannell et al. Citation2001).
Economic mechanisms can be harnessed to avoid further loss of natural ecosystems in Xishuangbanna (Yi, Wong, and Cannon et al. Citation2014b). This could be achieved through mechanisms such as market-based ecosystem payments and carbon financing. Carbon pricing and trading schemes could compensate farmers for any loss of income arising from crop market price fluctuations. Such initiatives could be used to encourage local farmers and other relevant parties to preserve existing natural land uses and discourage further conversion between land use types.
One major limitation of our study is that we inferred carbon measurement values from other studies. As soil organic carbon and below-ground biomass can be highly variable, this approach has the potential to under- or over-estimate total carbon stocks (Yang, Blagodatsky, and Lippe et al. Citation2016). Future carbon related studies in Xishuangbanna could be made more robust if extensive soil sampling was conducted, giving more comprehensive understanding of below-ground carbon stocks, and how these are impacted by land use change.
Conclusion
Rapid deforestation and land cover changes in Xishuangbanna have primarily been driven by conversion of natural forest to monoculture rubber expansion. Additional contributors have been the expansion of other recently introduced short term cash crops, such as banana.
Because large trees dominate carbon storage in natural forests (Mildrexler, Berner, and Law et al. Citation2020), and trees are generally larger in natural forests than plantations, such loss of natural forest cover would hugely reduce carbon storage capacity. We showed that Xishuangbanna’s rapid land use change has also reduced its overall ability to store carbon. Revised land use management and conservation policies are needed that disincentivize land use conversion, especially from high carbon storage land categories to low carbon storage land categories. The impact of new policies should be monitored over time, using appropriate methods to assess land use change and associated changes in ecosystem services. It is essential that policies are integrated with information on species and the predicted effects of climate change (Zomer, Xu, and Wang et al. (Citation2015). One potential strategy to mitigate the impact of rubber monoculture expansion, would be to introduce intercropping practices into existing plantations. Species should be selected for intercropping that are economically viable, provide ecosystem services, and increase the potential carbon sequestration of rubber plantations.
Disclosure statement
No potential conflict of interest was reported by the author(s).
Correction Statement
This article has been republished with minor changes. These changes do not impact the academic content of the article.
References
- Bélisle, A. C., A. Wapachee, and H. Asselin. 2021. “From Landscape Practices to Ecosystem Services: Landscape Valuation in Indigenous Contexts.” Ecol Econ 179: 179: 106858. doi:https://doi.org/10.1016/j.ecolecon.2020.106858.
- Bunker, D. E., F. Declerck, J. C. Bradford, R. K. Colwell, I. Perfecto, O. L. Phillips, M. Sankaran, and S. Naeem. 2005. “Species Loss and Aboveground Carbon Storage in a Tropical Forest.” Science 310 (5750): 1029–14.https://doi.org/https://doi.org/10.1126/science.1117682
- Burkhard, B., and J. Maes. 2017. Mapping Ecosystem Services,374. Sofia: Pensoft Publishers.
- Butt, A., R. Shabbir, S. S. Ahmad, and N. Aziz. 2015. “Land Use Change Mapping and Analysis Using Remote Sensing and GIS: A Case Study of Simly Watershed, Islamabad, Pakistan.” Egypt J Remote Sens Sp Sci 18: 251–259. doi:https://doi.org/10.1016/j.ejrs.2015.07.003.
- Cantarello, E., A. C. Newton, and R. A. Hill. 2011. “Potential Effects of Future Land-use Change on Regional Carbon Stocks in the UK.” Environmental Science & Policy 14 (1): 40–52. doi:https://doi.org/10.1016/j.envsci.2010.10.001.
- Chapmen, E. C. 1991. “The Expansion of Rubber in Southern Yunnan, China.” The Geographical Journal 157 (1): 36–44. doi:https://doi.org/10.2307/635142.
- Chase, J. M., S. A. Blowes, T. M. Knight, K. Gerstner, and F. May. 2020. “Ecosystem Decay Exacerbates Biodiversity Loss with Habitat Loss.” Nature 584 (7820): 238–243. https://doi.org/https://doi.org/10.1038/s41586-020-2531-2.
- Chen, H., Z.-F. Yi, D. Schmidt-Vogt, A. Ahrends, P. Beckschäfer, C. Kleinn, S. Ranjitkar, and J. Xu. 2016. “Pushing the Limits: The Pattern and Dynamics of Rubber Monoculture Expansion in Xishuangbanna, SW China.” PLoS One 11 (2): 1–15. https://doi.org/https://doi.org/10.1371/journal.pone.0150062
- Chi, X., Q. Guo, J. Fang, B. Schmid, and Z. Tang. 2017. “Seasonal Characteristics and Determinants of Tree Growth in a Chinese Subtropical Forest.” J Plant Ecol 10 (1): 4–12.https://doi.org/https://doi.org/10.1093/jpe/rtw051
- Cotta, M. K., L. A. G. Jacovine, H. N. de Paiva, C. P. B. Soares, A. C. V. Filho, and S. R. Valverde. 2008. “Quantification of Biomass and Generation of Emission Certificates Reduced in the Rubber-cocoa Consortium.” Rev Árvore 32. https://doi.org/https://doi.org/10.1590/S0100-67622008000600002
- De Blécourt, M., R. Brumme, J. Xu, M. D. Corre, and E. Veldkamp. 2013. “Soil Carbon Stocks Decrease following Conversion of Secondary Forests to Rubber (Hevea Brasiliensis) Plantations.” PLoS One 8 (7): e69357. doi:https://doi.org/10.1371/journal.pone.0069357.
- Defries, R. S., J. A. Foley, and G. P. Asner. 2004. “Land-use Choices : Balancing Human Needs and Ecosystem Function.” Frontiers in Ecology and the Environment 2 (5): 249–257. LCBHNA]2.0.CO;2. doihttps://doi.org/10.1890/1540-9295(2004)002[0249:.
- DeFries, R. S., R. A. Houghton, M. C. Hansen, C. B. Field, D. Skole, and J. Townshend. 2002. “Carbon Emissions from Tropical Deforestation and Regrowth Based on Satellite Observations for the 1980s and 1990s.” Proc Natl Acad Sci 99 (22): 14256–14261. doi:https://doi.org/10.1073/pnas.182560099.
- Deng, L., K. B. Wang, J. P. Li, Z. P. Shangguan, and S. Sweeney. 2014. “Carbon Storage Dynamics in Alfalfa (Medicago Sativa) Fields in the Hilly-Gully Region of the Loess Plateau, China.” Clean - Soil, Air, Water 42 (9): 1253–1262. doi:https://doi.org/10.1002/clen.201300079.
- Deng, L., and Z. Shangguan. 2016. “Afforestation Drives Soil Carbon and Nitrogen Changes in China : Soil C-N Dynamics following Afforestation.” L Degrad Dev. doi:https://doi.org/10.1002/ldr.2537.
- Dossa, E. L., E. C. M. Fernandes, W. S. Reid, and K. Ezui. 2008. “Above- and Belowground Biomass, Nutrient and Carbon Stocks Contrasting an Open-grown and a Shaded Coffee Plantation.” Agrofor Syst 72 (2): 103–115. doi:https://doi.org/10.1007/s10457-007-9075-4.
- Espinoza-Domínguez, W., L. Krishnamurthy, A. Vázquez-Alarcón, and A. Torres- Rivera. 2012. “Carbon Stocks in Agroforestry Systems with Coffee Plantations.” Rev Chapingo Ser Ciencias for Y Del Ambient 18 (1): 57–70. doi:https://doi.org/10.5154/r.rchscfa.2011.04.030.
- Falahatkar, S., R. A. Soffianian, J. S. Khajedddin and M. A. Nadoushan. 2011. “Integration of Remote Sensing Data and GIS for Prediction of Land Cover Map.” Int J Geomatics Geosci 1:847–864.
- Fang, J. Y., Z. D. Guo, S. L. Piao, and A. P. Chen. 2007. “Terrestrial Vegetation Carbon Sinks in China, 1981-2000.” Sci China, Ser D Earth Sci 50 (9): 1341–1350. doi:https://doi.org/10.1007/s11430-007-0049-1.
- Fang, Z., Y. Bai, B. Jiang, J. M. Alatalo, G. Liu, and H. Wang. 2020. “Quantifying Variations in Ecosystem Services in Altitude-associated Vegetation Types in a Tropical Region of China.” The Science of the Total Environment 726 :1–10. doi:https://doi.org/10.1016/j.scitotenv.2020.138565.
- FAO. 2010. Global Forest Resources Assessment 2010. Rome: FAO.
- Gong, W. 2014. “An Analysis of Factors Affecting the Performance of Retail Industry.” J Wuxi Inst Commer 14:. doi:https://doi.org/10.13659/j.cnki.wxsy.2014.03.004.
- Guirui, Y., L. Xuanran, W. Qiufeng, and L. Shenggong. 2010. “Carbon Storage and Its Spatial Pattern of Terrestrial Ecosystem in China.” J Resour Ecol 1: 97–109. doi:https://doi.org/10.3969/j..1674-764x.2010.02.001.
- Guo, L. B., and R. M. Gifford. 2002. “Soil Carbon Stocks and Land Use Change: A Meta Analysis.” Global Change Biology 8 (4): 345–360. doi:https://doi.org/10.1046/j.1354-1013.2002.00486.x.
- Henry, M., P. Tittonell, R. J. Manlay, M. Bernoux, A. Albrecht, and B. Vanlauwe. 2009. “Biodiversity, Carbon Stocks and Sequestration Potential in Aboveground Biomass in Smallholder Farming Systems of Western Kenya.” Agriculture, Ecosystems & Environment 129 (1–3): 238–252. doi:https://doi.org/10.1016/j.agee.2008.09.006.
- Hergoualc’h, K., E. Blanchart, U. Skiba, C. Hénault, and J. M. Harmand. 2012. “Changes in Carbon Stock and Greenhouse Gas Balance in a Coffee (Coffea Arabica) Monoculture versus an Agroforestry System with Inga Densiflora, in Costa Rica.” Agriculture, Ecosystems & Environment 148 :102–110. doi:https://doi.org/10.1016/j.agee.2011.11.018.
- Hongmao, L., X. Zaifu, X. Youkai, and W. Jinxiu. 2002. “Practice of Conserving Plant Diversity through Traditional Beliefs: A Case Study in Xishuangbanna, Southwest China.” Biodiversity and Conservation 11 (4): 705–713. doi:https://doi.org/10.1023/A:1015532230442.
- Hu, Y., Z. L. Batunacun, and D. Zhuang. 2019. “Assessment of Land-Use and Land-Cover Change in Guangxi, China.” Scientific Reports 9 (1): 1–13. doi:https://doi.org/10.1038/s41598-019-38487-w.
- Hynes, S., W. Chen, K. Vondolia, C. Armstrong, and E. O’Connor. 2021. “Valuing the Ecosystem Service Benefits from Kelp Forest Restoration: A Choice Experiment from Norway.” Ecol Econ179 :106833. doi:https://doi.org/10.1016/j.ecolecon.2020.106833.
- IPBES (2019) Global Assessment Report on Biodiversity and Ecosystem Services. Bonn, Germany
- IPCC (2019) Land Use Food Production Key to Climate Crisis Leaked Report? https://www.theguardian.com/environment/2019/aug/03/ipcc-land-use-food-production-key-to-climateV-crisis-leaked-report?CMP=twt_a-environment_b-gdneco&fbclid=IwAR3zxZncYpRZ-hFcFfAxQrq0CoLIQGFSuE5ftVNVcVfiw9edS8ryCGqiLS0. Accessed 3 Aug 2019
- Jia, K., Z. Zheng, and Y. Zhang. 2006. “Changes of Rubber Plantation Aboveground Biomass along Elevation Gradient in Xishuangbanna.” Chinese J Ecol 25: 1028–1032.
- Jiang, H., M. J. Apps, C. Peng, Y. Zhang, and J. Liu. 2002. “Modelling the Influence of Harvesting on Chinese Boreal Forest Carbon Dynamics.” Forest Ecology and Management 169 (1–2): 65–82. doi:https://doi.org/10.1016/S0378-1127(02)00299-2.
- Kieslich, M., and J. M. Salles. 2021. “Implementation Context and Science-policy Interfaces: Implications for the Economic Valuation of Ecosystem Services.” Ecol Econ 179: 179: 106857. doi:https://doi.org/10.1016/j.ecolecon.2020.106857.
- Kim, D. G., M. U. F. Kirschbaum, and T. L. Beedy. 2016. “Carbon Sequestration and Net Emissions of CH4 and N2O under Agroforestry: Synthesizing Available Data and Suggestions for Future Studies.” Agriculture, Ecosystems & Environment 226: 65–78. doi:https://doi.org/10.1016/j.agee.2016.04.011.
- Koh, L. P., and D. S. Wilcove. 2008. “Is Oil Palm Agriculture Really Destroying Tropical Biodiversity?” Conserv Lett 1 (2): 60–64. doi:https://doi.org/10.1111/j.1755-263X.2008.00011.x.
- Kongsager, R., J. Napier, and O. Mertz. 2013. “The Carbon Sequestration Potential of Tree Crop Plantations.” Mitig Adapt Strateg Glob Chang 18 (8): 1197–1213. doi:https://doi.org/10.1007/s11027-012-9417-z.
- Lü, X. T., J. X. Yin, M. R. Jepsen, and J. W. Tang. 2010. “Ecosystem Carbon Storage and Partitioning in a Tropical Seasonal Forest in Southwestern China.” Forest Ecology and Management 260 (10): 1798–1803. doi:https://doi.org/10.1016/j.foreco.2010.08.024.
- Laban, P., G. Metternicht, and J. Davies. 2018. Soil Biodiversity and Soil Organic Carbon: Keeping Drylands Alive. Gland Switzerland: IUCN.
- Laganiere, J., D. A. Angers, and D. Pare. 2010. “Carbon Accumulation in Agricultural Soils after Afforestation : A Meta-analysis.” Global Change Biology 16 (1): 439–453. doi:https://doi.org/10.1111/j.1365-2486.2009.01930.x.
- Lal, R. 2004a. “Soil Carbon Sequestration to Mitigate Climate Change.” Geoderma 123 (1–2): 1–22. doi:https://doi.org/10.1016/j.geoderma.2004.01.032.
- Lal, R. (2004b) The Potential of Carbon Sequestration in Soils of South Asia. In: ISCO 2004-13th International Soil Conservation Organisation Conference. ISCO, Brisbane, pp 1–6
- Li, H., T. M. Aide, Y. Ma, W. Liu, and M. Cao. 2007. “Demand for Rubber Is Causing the Loss of High Diversity Rain Forest in SW China.” Biodiversity and Conservation 16 (6): 1731–1745. doi:https://doi.org/10.1007/s10531-006-9052-7.
- Li, H., Y. Ma, T. M. Aide, and W. Liu. 2008. “Past, Present and Future Land-use in Xishuangbanna, China and the Implications for Carbon Dynamics.” Forest Ecology and Management 255 (1): 16–24. doi:https://doi.org/10.1016/j.foreco.2007.06.051.
- Li, Z., and J. M. Fox. 2012. “Mapping Rubber Tree Growth in Mainland Southeast Asia Using Time-series MODIS 250 M NDVI and Statistical Data.” Applied Geography 32 (2): 420–432. doi:https://doi.org/10.1016/j.apgeog.2011.06.018.
- Lian, H. 2015. “Minimax Prediction for Functional Linear Regression with Functional Responses in Reproducing Kernel Hilbert Spaces.” Journal of Multivariate Analysis 140: 395–402. doi:https://doi.org/10.1016/j.jmva.2015.06.005.
- Liu, J., M. Linderman, Z. Ouyang, L. An, J. Yang, and H. Zhang. 2001. “Ecological Degradation in Protected Areas: The Case of Wolong Nature Reserve for Giant Pandas.” Science (80-) 292 (5514): 98–101. doi:https://doi.org/10.1126/science.1058104.
- Liu, X., S. J. Herbert, A. M. Hashemi X. Zhang, and G. Ding. 2006. “Effects of Agricultural Management on Soil Organic Matter and Carbon Transformation – A Review.” Plant, Soil Environ 52 (No. 12): 531–543. DOI:https://doi.org/10.17221/3544-PSE.
- Lu, H., G. Liu, Z. Huang, and Q. Yang. 2016. “Carbon, Soil, and Ecological Benefits of REDD+ Policies in Southwest China.” ScienceAsia 42 (1): 1–11. doi:https://doi.org/10.2306/scienceasia1513-1874.2016.42.001.
- Malinauskaite, L., D. Cook, B. Davíðsdóttir, and H. Ögmundardóttir. 2021. “Socio-cultural Valuation of Whale Ecosystem Services in Skjálfandi Bay, Iceland.” Ecol Econ 180: 180: 106867. doi:https://doi.org/10.1016/j.ecolecon.2020.106867.
- Mao, J., B. Wang, and Y. Dai. 2009. “Sensitivity of the Carbon Storage of Potential Vegetation to Historical Climate Variability and CO2 in Continental China.” Adv Atmos Sci 26 (1): 87–100. doi:https://doi.org/10.1007/s00376-009-0087-z.
- Meyer, S. R., K. Beard, C. S. Cronan, and R. J. Lilieholm. 2015. “An Analysis of Spatio-temporal Landscape Patterns for Protected Areas in Northern New England: 1900-2010.” Landscape Ecology 30 (7): 1291–1305. doi:https://doi.org/10.1007/s10980-015-0184-6.
- Mildrexler, D. J., L. T. Berner, B. E. Law, Richard A. Birdsey, and William R. Moomaw. 2020. “Large Trees Dominate Carbon Storage in Forests East of the Cascade Crest in the United States Pacific Northwest.” Front For Glob Chang 3 :1–15. doi:https://doi.org/10.3389/ffgc.2020.594274.
- Myers, N., R. A. Mittermeier, C. G. Mittermeier, G. A. B. da Fonseca, and J. Kent. 2000. “Biodiversity Hotspots for Conservation Priorities.” Nature 403: 853–858. doi:https://doi.org/10.1038/35002501.
- Nair, P. K. R., B. M. Kumar, and V. D. Nair. 2009. “Agroforestry as a Strategy for Carbon Sequestration.” J Plant Nutr Soil Sci 172 (1): 10–23. doi:https://doi.org/10.1002/jpln.200800030.
- Nelson, E., D. Ennaanay, W. Stacie, N. Olwero, K. Vigerstol, G. M. D. Penning- ton, J. Aukema, et al. (2015) InVEST User’s Guide. The Natural Capital Project, Stanford University, University of Minnesota, The Nature Conservancy, andWorldWildlife Fund
- Nerlich, K., S. Graeff-Honninger, and W. Claupein. 2013. “Agroforestry in Europe: A Review of the Disappearance of Traditional Systems and Development of Modern Agroforestry Practices, with Emphasis on Experiences in Germany.” Agroforest Syst 87 (2): 475–492. doi:https://doi.org/10.1007/s10457-012-9560-2.
- Nizami, S. M., Z. Yiping, S. Liqing, W. Zhao, and X. Zhang. 2014. “Managing Carbon Sinks in Rubber (Hevea Brasilensis) Plantation by Changing Rotation Length in SW China.” PLoS One 9 (12): 1–17. doi:https://doi.org/10.1371/journal.pone.0115234.
- Noordwijk, M. V., D. A. Suyamto, B. Lusiana, A. Ekadinata, and K. Hairiah. 2008. “Facilitating Agroforestation of Landscapes for Sustainable Benefits : Tradeoffs between Carbon Stocks and Local Development Benefits in Indonesia According to the FALLOW Model.” Agriculture, Ecosystems & Environment 126 (1): 98–112. https://doi.org/https://doi.org/10.1016/j.agee.2008.01.016
- Olofsson, P., G. M. Foody, M. Herold, S. V. Stehman, C. E. Woodcock, and M. A. Wulder. 2014. “Good Practices for Estimating Area and Assessing Accuracy of Land Change.” Remote Sensing of Environment 148 :42–57. doi:https://doi.org/10.1016/j.rse.2014.02.015.
- Perrings, C., A. Duraiappah, A. Larigauderie, and H. Mooney. 2011. “The Biodiversity and Ecosystem Services Science-Policy Interface.” Science (80-) 331 (6021): 1139–1140. doi:https://doi.org/10.1126/science.1202400.
- Qiu, J. 2009. “Where the Rubber Meets the Garden.” Nature 457 (7227): 246–247. doi:https://doi.org/10.1038/457246a.
- Read, D., D. Beerling, M. Cannell, P. Cox, and P. Curran. 2001. The Role of Land Carbon Sinks in Mitigating Global Climate Change. London: The Royal Society.
- Richard S.2009. “Nursing China’s Ailing Forests Back to Health.” Science 325: 556–558. https://doi.org/https://doi.org/10.1126/science.325_556
- Sarathchandra, C., G. G. O. Dossa, N. B. Ranjitkar, H. Chen, Z. Deli, S. Ranjitkar, K. H. W. L. de Silva, S. Wickramasinghe, J. Xu, and R. D. Harrison. 2018. “Effectiveness of Protected Areas in Preventing Rubber Expansion and Deforestation in Xishuangbanna, Southwest China.” L Degrad Dev 29 (8): 2417–2427. doi:https://doi.org/10.1002/ldr.2970.
- Sarathchandra, C., S. Kambach, S. Ariyarathna, J. Xu, R. Harrison, and S. Wickramasinghe. 2018. “Significance of Mangrove Biodiversity Conservation in Fishery Production and Living Conditions of Coastal Communities in Sri Lanka.” Diversity 10: 10 (2): 20. doi:https://doi.org/10.3390/d10020020.
- Sauer, T. J., D. E. James, C. A. Cambardella, and G. Hernandez-ramirez. 2012. “Soil Properties following Reforestation or Afforestation of Marginal Cropland.” Plant and Soil 360 (1–2): 375–390. doi:https://doi.org/10.1007/s11104-012-1258-8.
- Schrotha, G., S. A. D. Angelo, W. G. Teixeira, D. Haag, and R. Lieberei. 2002. “Conversion Os Secondary Forest into Agroforestry and Monoculture Plantations in Amazônia: Consequences for Biomass, Litter and Soil Carbon Stocks after 7 Years.” For Ecol Manag 163 (1–3): 131–150. doi:https://doi.org/10.1016/S0378-1127(01)00537-0.
- Sharp, E. R., R. Chaplin-kramer, S. Wood, A. Guerry, H. Tallis, T. Ricketts, Contributing Authors, et al. (2015) InVEST User’s Guide
- Sierra, C. A., J. I. Del Valle, S. A. Orrego, F. H. Moreno, M. E. Harmon, M. Zapata, G. J. Colorado et al. 2007. “Total Carbon Stocks in a Tropical Forest Landscape of the Porce Region, Colombia.” Forest Ecology and Management 243 (2–3): 299–309. doi:https://doi.org/10.1016/j.foreco.2007.03.026.
- Smith, P. 2004. “Carbon Sequestration in Croplands: The Potential in Europe and the Global Context.” Eur J Agron 20 (3): 229–236. doi:https://doi.org/10.1016/j.eja.2003.08.002.
- Sodhi, N. S., L. P. Koh, B. W. Brook, and P. K. L. Ng. 2004. “Southeast Asian Biodiversity: An Impending Disaster.” Trends in Ecology & Evolution 19 (12): 654–660. doi:https://doi.org/10.1016/j.tree.2004.09.006.
- Tan, Z., Y. Zhang, Q. Song, W. Liu, X. Deng, J. Tang, Y. Deng, et al. 2011. “Rubber Plantations Act as Water Pumps in Tropical China Rubber Plantations Act as Water Pumps in Tropical China.” Geophysical Research Letter 38. https://doi.org/https://doi.org/10.1029/2011GL050006
- Tao, Y., F. Li, R. Wang, and D. Zhao. 2015. “Effects of Land Use and Cover Change on Terrestrial Carbon Stocks in Urbanized Areas: A Study from Changzhou, China.” Journal of Cleaner Production 103: 651–657. doi:https://doi.org/10.1016/j.jclepro.2014.07.055.
- Udawatta, R. P., and S. Jose. 2012. “Agroforestry Strategies to Sequester Carbon in Temperate North America.” Agrofor Syst 86 (2): 225–242. doi:https://doi.org/10.1007/s10457-012-9561-1.
- Van Noordwijk, M., H. L. Tata, J. Xu, S. Dewi, and P. Minang. 2012. “Segregate or Integrate for Multifunctionality and Sustained Change through Landscape Agroforestry Involving Rubber in Indonesia and China.” In Agroforestry: The Future of Global Land Use, edited by P. K. R. Nair and D. P. Garrity, 69-104. The Netherlands: Springer.
- Warren-Thomas, E., P. M. Dolman, and D. P. Edwards. 2015. “Increasing Demand for Natural Rubber Necessitates a Robust Sustainability Initiative to Mitigate Impacts on Tropical Biodiversity.” Conserv Lett 8 (4): 230–241. doi:https://doi.org/10.1111/conl.12170.
- Wu, S., J. Li, W. Zhou, B. J. Lewis, D. Yu, L. Zhou, L. Jiang, and L. Dai. 2018. “A Statistical Analysis of Spatiotemporal Variations and Determinant Factors of Forest Carbon Storage under China’s Natural Forest Protection Program.” J For Res 29 (2): 415–424. doi:https://doi.org/10.1007/s11676-017-0462-z.
- Xu, J., J. Fox, J. B. Vogler, Z. Peifang, F. Yongshou, Y. Lixin, Q. Jie, and S. Leisz. 2005. “Land-Use and Land-Cover Change and Farmer Vulnerability in Xishuangbanna Prefecture in Southwestern China.” Environmental Management 36 (3): 404–13. https://doi.org/https://doi.org/10.1007/s00267-003-0289-6
- Xu, J., and D. R. Melick. 2007. “Rethinking the Effectiveness of Public Protected Areas in Southwestern China.” Conservation Biology : The Journal of the Society for Conservation Biology 21 (2): 318–328. doi:https://doi.org/10.1111/j.1523-1739.2006.00636.x.
- Xu, J., J. Fox, L. Xing N. Podger, S. Leisz, and A. Xihui. 1999. “Effects of Swidden Cultivation, State Policies, and Customary Institutions on Land Cover in a Hani Village, Yunnan, China.” Mountain Research and Development 19 (2): 123–132. DOI:https://doi.org/10.2307/3674253.
- Xu, J., R. E. Grumbine, and P. Beckschäfer. 2014a. “Landscape Transformation through the Use of Ecological and Socioeconomic Indicators in Xishuangbanna, Southwest China, Mekong Region.” Ecological Indicators 36: 749–756. doi:https://doi.org/10.1016/j.ecolind.2012.08.023.
- Xu, J., R. E. Grumbine, and P. Beckschäfer. 2014b. “Landscape Transformation through the Use of Ecological and Socioeconomic Indicators in Xishuangbanna, Southwest China, Mekong Region.” Ecological Indicators 36: 749–756. doi:https://doi.org/10.1016/j.ecolind.2012.08.023.
- Yang, X., S. Blagodatskiy, J. Xu, and G. Cadisch (2015) Meet the Balance of Carbon Emission and Land Use Productivity - Case Study from Naban National Nature Reserve, Xishuangbanna. In: Tropentag, “Management of land use systems for enhanced food security: conflicts, controversies and resolutions”. Berlin
- Yang, X., S. Blagodatsky, M. Lippe, F. Liu, J. Hammond, J. Xu, and G. Cadisch. 2016. “Land-use Change Impact on Time-averaged Carbon Balances: Rubber Expansion and Reforestation in a Biosphere Reserve, South-West China.” Forest Ecology and Management 372 :149–163. doi:https://doi.org/10.1016/j.foreco.2016.04.009.
- Yi, Z., C. H. Cannon, J. Chen, C. Ye, and R. D. Swetnam. 2014a. “Developing Indicators of Economic Value and Biodiversity Loss for Rubber Plantations in Xishuangbanna, Southwest China : A Case Study from Menglun Township.” Ecological Indicators 36 :788–797. doi:https://doi.org/10.1016/j.ecolind.2013.03.016.
- Yi, Z., G. Wong, C. H. Cannon, J. Xu, P. Beckschäfer, and R. D. Swetnam. 2014b. “Land Use Policy Can Carbon-trading Schemes Help To Protect China ’ s most diverse forest ecosystems? A case study from Xishuangbanna, Yunnan.” Land Use Policy 38 :646–656. doi:https://doi.org/10.1016/j.landusepol.2013.12.013.
- Yu, J., S. Yao, and B. Zhang. 2014. “Designing Afforestation Subsidies That Account for the Benefits of Carbon Sequestration: A Case Study Using Data from China’s Loess Plateau.” Journal of Forest Economics 20 (1): 65–76. https://doi.org/https://doi.org/10.1016/j.jfe.2013.09.001
- Zhang, B., Q. Zhang, C. Feng, et al. 2017. “Understanding Land Use and Land Cover Dynamics from 1976 to 2014 in Yellow River Delta.” Land 6 (1): 1–20. doi:https://doi.org/10.3390/land6010020.
- Zhang, H., H. Li, and Z. Chen. 2011. “Analysis of Land Use Dynamic Change and Its Impact on the Water Environment in Yunnan Plateau Lake Area - A Case Study of the Dianchi Lake Drainage Area.” Procedia Environ Sci 10: 2709–2717. doi:https://doi.org/10.1016/j.proenv.2011.09.421.
- Zhang, J., and M. Cao. 1995. “Tropical Forest Vegetation of Xishuangbanna, SWchina and Its Secondarz Changes, with Special Reference to Some Problems in Local Nature Conservation.” Biological Conservation 73 (3): 229–238. doi:https://doi.org/10.1016/0006-3207(94)00118-A.
- Zhiyanski, M., A. Gikov, S. Nedkov, P. Dimitrov, and L. Naydenova. 2016a. “Mapping Carbon Storage Using Land Cover/Land Use Data in the Area of Beklemeto, Central Balkan.” In Sustainable Mountain Regions: Challenges and Perspectives in Southeastern Europe, edited by B. Z. G. Koulov, 53–65. Springer,Cham. https://doi.org/https://doi.org/10.1007/978-3-319-27905-3
- Zhiyanski, M., A. Gikov, S. Nedkov, et al. 2016b. “Sustainable Mountain Regions: Challenges and Perspectives in Southeastern Europe.” Sustain Mt Reg Challenges Perspect Southeast Eur 53–65. doi:https://doi.org/10.1007/978-3-319-27905-3.
- Zhou, J., J. Wu, and Y. Gong. 2020. “Valuing Wetland Ecosystem Services Based on Benefit Transfer: A Meta-analysis of China Wetland Studies.” J Clean Prod 276:. doi:https://doi.org/10.1016/j.jclepro.2020.122988.
- Ziegler, A. D., J. M. Fox, and J. Xu. 2009. “The Rubber Juggernaut.” Science 324: 1024–25. https://doi.org/https://doi.org/10.1126/science.1173833
- Zomer, R. J., J. Xu, M. Wang, A. Trabucco, and Z. Li. 2015. “Projected Impact of Climate Change on the Effectiveness of the Existing Protected Area Network for Biodiversity Conservation within Yunnan Province, China.” Biological Conservation 184 :335–345. doi:https://doi.org/10.1016/j.biocon.2015.01.031.