
 ?Mathematical formulae have been encoded as MathML and are displayed in this HTML version using MathJax in order to improve their display. Uncheck the box to turn MathJax off. This feature requires Javascript. Click on a formula to zoom.
ABSTRACT
Background and Objectives: One major source of antibiotic contamination in the sea is from aquaculture. We monitored the concentration of commonly used antibiotic classes and antibiotic resistance genes (tet(M), sul1, sul2 and sul3) in aquaculture farms in Peninsular Malaysia.
Methods: Antibiotic residues and resistance genes were quantified using high-performance liquid chromatography and real-time PCR respectively. Risk quotients in European technical guidance document on risk assessment was used to assess the potential environmental risk.
Results: We detected 23 antibiotics with tetracyclines, sulfonamides and quinolones were the most frequently detected classes, indicating a wide distribution of antibiotics in Malaysian aquaculture farms. The dendrogram and heatmap revealed three groups of antibiotic concentration patterns but with no differences in the types of antibiotics usage among aquaculture farms. The ARGs (10−3 copies/16S) were detected in >90% of the sites except for sul3. Ciprofloxacin, enrofloxacin, norfloxacin and lincomycin posed risks to cyanobacteria and algae in Kelantan, Perak and Pahang.
Conclusion: Relative to Asian aquaculture farms, the residues detected here were at low or moderate levels except for quinolones. This study will be useful to develop effective management of aquaculture wastewater in order to mitigate antibiotic pollution and transmission of ARGs to humans through the food chain.
Introduction
Aquaculture plays an important role as a main source of animal protein in global diets (FAO Citation2016; Mohd et al. Citation2017; Department of Fisheries (DOF) Citation2019). In order to meet the demand of the world’s growing population and to achieve sustainable food production and security, aquaculture production will have to be increased by an additional 46.4 million metric tons by 2030 (World Bank Citation2013). Asia is referred to as “home of aquaculture,” accounting for about 89% of global production in 2016 (FAO Citation2020). In terms of aquaculture production, Malaysia is ranked 15th in the world and 6th in Asia with an estimated production of 427,022.66 metric tonnes worth USD 731.81 million (FAO Citation2016; Dermawan Citation2019). In many Southeast Asia countries, aquaculture production has contributed significantly to their national economies [Gross Domestic Product (GDP), 0.2˗5% increase]. Therefore, aquaculture industry has been recognized as a potential pillar to strengthen economic growth (Lundgren et al. Citation2006; SEAFDEC Citation2017).
However, one of the major threats to the aquaculture industry worldwide is bacterial infection. More than USD 6 billion per annum is lost from the aquaculture industry due to disease (Stentiford et al. Citation2017). Both extensive and intensive aquaculture farming have greatly enhanced the transmission opportunities for waterborne pathogens that can spread at faster rates compared with terrestrial systems (McCallum, Harvell, and Dobson Citation2003). For example, Vibrio parahaemolyticus, the causative agent of acute hepatopancreatic necrosis disease (AHPND) and formerly known as early mortality syndrome (EMS) causes devastating losses that reached billions of dollars annually since its first outbreak in Southern China in 2009 (Lightner et al. Citation2012a, Citation2012b; Tran et al. Citation2013). This disease is rapidly spreading and has affected several countries in Southeast Asia consecutively, e.g., Vietnam in the year 2010, Malaysia (2011), Thailand (2012), Philippines (2013), and has even spread to the Americas e.g., Mexico in 2013 (Tran et al. Citation2013; Nunan et al. Citation2014; De La Peña et al. Citation2015).
In order to treat and prevent bacterial diseases in aquaculture, antibiotics are commonly used as therapeutic and/or prophylactic agents. Tetracyclines, sulfonamides, oxolinic acid and erythromycin are commonly used antibiotics in aquaculture farming (ASEAN, Citation2013). These antibiotics are permitted for use in food producing animal based on the recommended Maximum Residue Level (MRL) set by joint Food and Agriculture Organization of the United Nations and the World Health Organization (FAO/WHO), Codex Alimentarius Commission, and European Union legislation (FAO and WHO Citation2020). However, MRLs differ between geographic regions depending on the antibiotic usage profiles and local food safety regulatory agencies. Moreover, most Southeast Asian countries lack legislation, regulatory surveillance and monitoring systems on the use of antibiotics (Chuah et al. Citation2016; FAO Citation2016). Antibiotic contamination continues to be found in the environment and aquaculture products (Le and Munekage Citation2004; Lin, Yu, and Lin Citation2008; Oliveira et al. Citation2014; Xiong et al. Citation2015; Lai et al. Citation2018). Although Malaysia has banned the use of nitrofurans and chloramphenicol in aquaculture farming, the United States Food and Drug Administration (FDA) continues to detect both these residues in seafood from Malaysia, in which 44 cases were reported between 2009 and 2018 (Food and Drug Administration Citation2018).
Aquaculture waste has been identified as one of the main contributors of antibiotic pollution in the environment (De Jesus Gaffney et al. Citation2016) as the infrastructure for proper aquaculture waste management is critically lacking. Furthermore, many countries, particularly those in the developing countries have yet to develop standards on concentrations of antibiotics discharge from wastewater effluents (Sasikaladevi, Kiruthika Eswari, and Nambi Citation2020). Therefore antibiotics, antibiotic resistance bacteria (ARB) and antibiotic resistance genes (ARGs) from aquaculture are released directly to the environment. These chemical and biological pollutants can impact public health and marine ecosystems (World Health Organization (WHO) Citation2018). However, quantitative data on the residual levels of antibiotic and antimicrobial resistance in water samples from aquaculture remain scarce (Managaki et al. Citation2007; Suzuki and Hoa Citation2012; Shimizu et al. Citation2013; Yan et al. Citation2018). Current levels of antibiotic use in aquaculture worldwide are difficult to determine as different countries have different distribution and standards to assess the pollution levels (Romero, Feijoó, and Navarrete Citation2012). With limited information on the level of contamination of antibiotics in Malaysian aquaculture farms, the potential risk of residual antibiotic toward the ecosystem remains unclear. Hence, the aim of this study is to examine the distribution and composition of antibiotics in aquaculture farms, and their ecological risk, as well as determine the prevalence of ARGs in bacteria from aquaculture farms.
Materials and methods
Sampling
For this study, we obtained permission from 29 aquaculture farms located at the seven main aquaculture production states (Perak, Selangor, Pahang, Kelantan, Penang Island, Malacca and Johor) of Peninsular Malaysia (, Department of Fisheries (DOF) Citation2019). During sampling, we were only allowed to collect the surface water using a stainless-steel bucket. The water samples were then passed through a 20 μm mesh net and stored into a clean 2 L amber glass bottle. Samples were kept cold during transportation before further processing in the laboratory.
Chemical and standards
Twenty-five commonly detected antibiotics [trimethoprim (TMP), ciprofloxacin (CIP), enrofloxacin (ENRO), ofloxacin (OFX), norfloxacin (NOR), nalidixic acid (NAL), carbadox (CAR), lincomycin (LIN), azithromycin (AZM), clarithromycin (CTM), erythromycin-H2O (ETM), roxitromycin (RTM), tylosin (TYL), sulfadimethoxine (SMA), sulfapyridine (SPD), sulfathiazole (STZ), sulfamethoxazole (SMX), sulfamethazine (SMT), sulfamerazine (SMR), sulfamethizole (SMZ), doxycycline (DOX), minocycline (MNC), chlortetracycline (CTC), oxytetracycline (OTC) and tetracycline (TC)] that belong to six antibiotics classes were selected: diaminopyrimidine, quinolones, macrolides, sulfonamides, tetracyclines and others (lincomycin, carbadox), and analyzed according to Shimizu et al. (Citation2013). Standards for SPD, RTM, TC, MNC and NOR were obtained from Sigma-Aldrich Co. (St. Louis, Mo, USA), SMX, SMR, SMA, SMT, TMP, CTM, OTC, CTC, NAL, and CAR were from Wako Pure chemicals Co. (Osaka, Japan), STZ, SMZ, ETM, TYL, and LIN from Honeywell Riedel-de Haen Co. (Seelze, Germany), AZM from LKT laboratories Co. (St Paul, USA), DOX from ICN Biomedicals Co. (Santa Ana, USA), OFX and ENRO from Hayashi pure chemicals Co. (Osaka, Japan). Oxytetracycline-13C,d3, sulfamethoxazole-d4, clarithromycin-d3, roxithromycin-d9 and norfloxacin-d5 were used as surrogate standards and were purchased from Hayashi pure chemicals Co. (Osaka, Japan). All the above antibiotic standards were prepared by dissolution in methanol and kept at −20°C, and all solvents were of HPLC grade. Methanol, acetonitrile, formic acid (>99.5%) and ethylenediamine tetraacetic acid disodium (Na2EDTA) were obtained from Wako Pure Chemicals (Osaka, Japan). Ultra-pure water was used in this study (Milli-Q ultrapure water system, Millipore, Bedford, MA, USA).
Extraction and quantification of antibiotic residues in water
One to two Liter water samples were measured precisely and filtered through glass fiber filters (GF/F, Sartorius, Gӧttingen Germany) with a nominal pore size of 0.7 µm. The pH of the filtrate was then adjusted to pH 3 with 3 M sulfuric acid, followed by the addition of 0.2 g Na2EDTA as chelating agent. Targeted antibiotic was extracted by Solid Phase Extraction (SPE) using Oasis® Hydrophilic-lipophilic balance (HLB) extraction cartridges (500 mg, Waters, USA) and the VisiprepTM SPE vacuum manifold (Supelco, USA). Prior to extraction, the cartridge was pre-treated with 6 mL each of methanol, ultra-pure water and 10 mM acidified Na2EDTA buffer. Filtrate was then loaded and passed through the SPE cartridge at a flow rate of 10 min/mL. After loading the filtrate, 10 mL of acidified ultra-pure water was used to wash the cartridge followed by drying the cartridge under nitrogen flow for 30 minutes. Then, the analyte was eluted with methanol (2 mL) containing 0.1% (v/v) formic acid four times. A 50 µL of surrogate mixture (clarithrobycin-d3, norfloxacin-d5 (500 ng/mL each, in methanol), oxytetracycline-13C, -d3, roxithromycin-d9 and sulfamethoxazole-d4,) was then spiked in the eluent. A rotary evaporator was used to concentrate the eluent to an approximate volume of 0.5 mL and kept in amber vial. The concentrated eluent was then dried completely under gentle nitrogen gas at 35°C and reconstituted with H2O/acetonitrile (94:6 v/v) containing 0.1% formic acid to a final volume approximately 20 mL – 100 mL, providing a pre-concentration factor of 10 to 100.
A liquid chromatograph (LC) (Accela, Thermo Fisher Scientific, Yokohama, Japan) was used to determine and quantify TCs. The LC system was equipped with a tandem mass spectrometer (LC-MS/MS) (Quantum Access, Thermo Fisher Scientific, Yokohama, Japan) using a positive electrospray ionization (ESI) operating in positive mode with selected reaction monitoring (SRM) mode. Separation of TCs was achieved on a Waters Xterra MS C18 column (2.1 mm ID x 50 mm with particle size 2.5 µm; Waters, USA) in combination with a Waters Xterra MS C18 guard column (2.1 mm ID x 20 mm with particle size 3.5 µm, Waters, USA). An injection of 20 µL and a binary solvent gradient system with a flow rate of 0.2 mL/min were used. Solvent A was 0.1% formic acid in water and solvent (B) was acetonitrile. The separation of TCs were carried out using the following gradient program: initiated with 5% B for 5 min, followed by increasing solvent B in a linear pattern to 95% over 11 min. A 17 min post time allowed re-equilibration of column, before the initial gradient composition was reestablished for the next analysis. The collision energy and isolation width (m/z) for precursor ion and two product ions are summarized in Table S1.
The identification and quantification of antibiotics were determined by comparing the retention times and the area ratios of the two product ions in each sample with the standard. The accepted margin of error for the retention time and the area ratio of the two product ions between the sample and standard was within 0.3 min and 20% area ratio, respectively. A seven point (1, 3, 5, 10, 30, 50 and 100 ng/mL) external calibration curves was generated for quantification and used at regular interval. The linearity correlation index (R2) was above 0.99. The final concentration for the majority of samples were within the calibration lines. If the final concentration was below the lowest standard concentration (1 ng/mL), the sample’s concentration was calculated by extrapolation. The concentration of the selected antibiotics was adjusted against the recovery of the surrogates as indicated in Table S2.
Analytical performance
Based on successive dilution of the standard mixture solution, 0.03 ng/mL was determined as the lowest concentration of reliable detection for all the target antibiotics except for TYL and tetracyclines where 0.3 ng/mL was the lowest concentration of reliable detection. Considering the highest preconcentration factor (i.e., 100), the limit of detection (LOD) was determined at 0.3 ng/L of sample water for all the target antibiotics except for TYL and tetracyclines that have a LOD of 3 ng/L. A blank was run together with each batch of sample analysis and the limit of quantification (LOQ) was established based on 10 times blank value. LOQ were normally 20 ng/L for the target antibiotics except for TYL and tetracyclines with 200 ng/L of LOQ.
Effluent from a sewage treatment plant (STP) was analyzed in triplicate to determine the reproducibility. Relative standard deviations (RSD) of concentrations of the selected antibiotics were < 30% except for tetracycline whose concentrations were below LOQ (Table S2). Higher deviations for tetracyclines were ascribed to their lower sensitivity and low concentrations in sewage effluents. For the aquaculture samples, SPE was done on-site and spiked with surrogate after elution of target compounds from SPE cartridge. Therefore, extraction efficiency on SPE was not corrected, though loss during evaporation and transfer and matrix effects on LC-MS/MS analysis were corrected by using surrogates. Thus, we checked the extraction efficiency via the analysis of sewage effluents spiked with or without native standards before SPE. Recoveries i.e., extraction efficiencies, ranged from 78% to 132% (Table S2) and our reported concentrations were reliable with this range of accuracy.
Quantitative PCR of antibiotic resistance genes (ARGs)
In this study, we assessed the ARGs for sulfonamide and tetracycline resistance genes due to the long use of these antibiotics in human and veterinary clinics. Among the tetracycline resistance genes, tet(M) was chosen as it is suspected to have the widest host range (Roberts, Schwarz, and Aarts Citation2012) and its origin date back to ancient times (Kobayashi et al. Citation2007). tet(M) also has a high genetic diversity (Rizzotti et al. Citation2009) and is highly distributed in the environment (D’Costa et al. Citation2011). For sulfonamide resistance genes, sul1, sul2 and sul3 were selected.
For ARGs quantification, the total DNA of natural assemblages of bacteria were captured on 0.2 µm polycarbonate membrane filter (Merck Millipore, Germany). The targeted ARG was extracted according to Suzuki et al. (Citation2013). Quantitative PCR (qPCR) was conducted using CFX 96TM Real-Time system (Bio-Rad, Laboratories, Hercules, CA, USA) for four selected ARGs: tet(M), sul1, sul2 and sul3. These four genes were prevalent ARGs in aquatic environments (Suzuki et al. Citation2013, Citation2015), and thus appropriate representatives of ARGs. The 16S ribosomal RNA (16S rRNA) gene was also analyzed to quantify the total bacteria in the collected samples. qPCR amplification was performed in a reaction mixture containing of 1X SsoFastTM EvaGreen® Supermix (Biorad, Laboratories, Hercules, CA, USA), 500 nM of each primer, 1 μL template DNA and sterile Milli-Q water (Merck Millipore, Germany) in a total volume of 20 μL. Each sample was measured in triplicates. The amplification condition and primer sequences are listed in . A known copy number of plasmid DNA that carried the cloned target genes was used to generate the standard curve. Ten times serial dilution was performed to generate a five-point standard curve in triplicate for each qPCR analysis. The ARGs were normalized to 16S rRNA (Copies/16S) and used to report and discuss the results.
Table 1. qPCR primer sequences, target and conditions of reactions
Ecological risk assessment
For the potential ecological effect brought by the detected antibiotic toward the environment, a Risk Quotient (RQ) calculation was formulated following the European technical guidance document on risk assessment (European Commission Citation2003). The risk quotient (RQ) was calculated with the formula shown below:
The value of assessment factor was decided based on the type of toxicity data EC50/LC50 (European Commission Citation2003). In this study, the toxicity data of each selected antibiotic on four types of aquatic live (algae, bacteria, fish and invertebrate) were used from the literature review of toxicological studies (Table S3). The predicted no-effect concentration (PNEC) is the division of EC50/LC50 and assessment factor. The RQ were classified into three levels of risk according to Hernando et al. (Citation2006) with RQ value more than 1 categorized as high risk. RQ value in the range of 0.1 and 1 is categorized as medium risk, while RQ value less than 0.1 is under the level of low risk.
Statistical analysis
Correlation and linear regression analysis were conducted to analyze the effect between antibiotic residue concentration and antibiotic resistance genes detected in aquaculture farm. Data of antibiotic residue concentration were subjected to logarithmic transformation. Data were assessed by one-way ANOVA and Tukey test using PAST version 4.03 (Hammer, Harper, and Ryan Citation2001). Significant differences between antibiotic residue concentration and ARG were evaluated, and p < 0.05 was considered statistically significant. RStudio version 1.4.1106 was used to generate dendrogram and heatmap to conduct cluster analysis and identify the distribution, the pattern of usage and concentration of antibiotic residues in aquaculture farm.
Results
Antibiotic residues
Twenty-three antibiotics belonging to six classes were detected in Malaysian aquaculture farms, including seven sulfonamides (SPD, STZ, SMR, SMT, SMZ, SMX, SMA), five quinolones (CIP, ENRO, OFX, NOR, NAL), four tetracyclines (MNC, OTC, TC, DOX), five macrolides (AZM, TYL, ETM, CTM, RTM), TMP and LIN. The concentration of detected antibiotics ranged from < LOQ to 9.58 × 10⁵ ng/L (). Tetracyclines had the highest detection frequencies (83%) followed by sulfonamides (72%) and quinolones (69%).
Table 2. The concentration of tetracyclines, sulfonamides, quinolones, macrolides, trimethoprim, lincomycin and carbadox in surface water of aquaculture farm
For the tetracycline compounds tested, OTC was the most frequently detected (41%) but the concentrations were less than LOQ. TC and MNC were detected in the range <LOQ – 73 ng/L and <LOQ – 245 ng/L, respectively. TC was detected in the farms from Johor (J6: 2.3 ng/L), Perak (P1: 2.0 ng/L and P6: 7.3 ng/L) and Pahang (PA2: 1.4 ng/L). MNC was detected in Johor (J1: < LOQ, J5: 5.1 ng/L), Malacca (M4: 2.4 ng/L), Pahang (PA2:< LOQ), Penang Island (P12: < LOQ), where the highest concentration was recorded in Perak (P6: 245 ng/L,). DOX was only detected in one farm located in Perak (P5: 234 ng/L) whereas CTC was not detected in any of the farms.
All the sulfonamide compound tested was detected (< LOQ to 282.4 ng/L) in all the states except for Selangor. SMR (41%) and STZ (21%) were the most frequently detected. The highest concentration of STZ (282.4 ng/L) and SPD (29 ng/L) were found in Pahang (PA2) and Perak (P6), respectively whereas the concentration of other sulfonamides compounds in most of the farm (95%) were less than 6 ng/L. SMT was only detected in farms located in Pahang (PA2: 5.68 ng/L and PA4: 2.21 ng/L) and Penang Island (PI1, PI2, PI3: 0.72 ng/L, 1.14 ng/L and 2.98 ng/L) whereas SMZ was present in Pahang (PA3: 1.11 ng/L and 3.63 ng/L) and Perak (P5:4.79 ng/L and P7:0. 84 ng/L).
The five tested quinolone antibiotics were detected with concentrations ranging from <LOQ – 9.58 × 10⁵ ng/L. ENRO was the most frequently detected (52%) followed by NAL (28%), OFX, (21%), CIP (14%) and NOR (14%). CIP, ENRO and NAL were found dominant in Perak while NOR and OFX were dominant in Kelantan and Pahang, respectively. The highest concentration of ENRO, CIP, NOR and NAL were detected in P6 in Perak with concentrations at 9.58 × 10⁵ ng/L, 1.31 × 10⁵ ng/L, 6.7 × 10³ ng/L and 946 ng/L, respectively.
Macrolides (AZM, ETM, CTM, TYL and RTM) were found in notably low concentrations ranging from <LOQ – 6.9 ng/L and accounted for the lowest total concentration (20 ng/L). No macrolides were detected in Pahang. TMP was only detected in Pahang (PA4), Perak (P4) and Penang Island (PI2) at concentrations of 4.7 ng/L, 0.5 ng/L and 0.4 ng/L, respectively. LIN was found in all states (<LOQ – 74.7 ng/L) with the highest concentration detected in Pahang (PA6: 74.7 ng/L). CAR was not detected in all the water samples at all sites.
Antibiotic resistance genes
The sul genes detected among the aquaculture farms ranged from 10−7– 10°copies/16S (). Among the targeted sul genes, sul2 was the most abundant (10−6– 10°copies/16S) followed by sul1 (10−5 – 10−1copies/16S). The sul3 was the least abundant (10−7–10−4 copies/16S) or not detectable at most sites. The co-existence of sul genes were observed in which both sul1 and sul2 were predominantly found in 93% of the aquaculture farms with the exception of P1, Perak where only sul1 was present and PA1, Pahang where only sul2 was present. In contrast, the abundance of tet(M) (2.36 × 10⁻⁵ – 3.12 × 100 copies/16S) was higher than sul genes. The highest abundance of tet(M) were detected in two farms located in Perak (P6: 2.42 × 100 copies/16S and P7: 3.12 × 100 copies/16S) ().
Environmental ecological risk
In this study, the detected antibiotics posed negligible risk to fish. However, for quinolones, in which CIP detected in P6 and P7, Perak, K1 in Kelantan and PA4 in Pahang, exhibited high risk to Microcystis aeruginosa. ENRO detected in Johor (J1, J2, J3), Kelantan (K1, K2), Penang Island (PI1, PI2), Perak (P2) and Pahang (PA4) posed medium risk to Vibrio fischeri whereas in Perak (P1, P6 and P7), ENRO posed high risk. NOR posed medium risk to Vibrio fischeri at Kelantan (K1) and Johor (J1) whereas at P6, Perak, high risk was detected ().
Table 3. The calculated risk quotients (RQs) for the selected antibiotic detected in aquaculture farm
In contrast, TC only posed medium risk to Microcystis aeruginosa at Perak (P1, P6), Johor (J6) and Pahang (PA2) whereas DOX posed medium risk to Synechococcus leopoliensis at P5, Perak. Among the sulfonamides, only SMX detected at Johor (J4), Malacca, (M4), Kelantan (K1), Pahang (PA3) and Penang Island (PI1) posed medium risk to Synechococcus leopoliensis. LIN and CTM posed medium to high risk to Pseudokirchneriella subcapitata at Johor (J6) and Kelantan (K2), respectively. RQ was not calculated for NAL, MNC and SMZ due to the lack of toxicology data.
Discussion
Antibiotics in aquaculture waters
In our study, 23 antibiotic residues belonging to six classes were identified (total concentration: 1.099 × 10⁶ ng/L) in which tetracyclines, sulfonamides and quinolones were the most prevalent antibiotics detected suggesting the wide usage of these antibiotics in aquaculture farms in Malaysia (). Other studies in Asia have reported the frequent use of similar antibiotic compounds in aquaculture production (Rico et al. Citation2012; Lulijwa, Rupia, and Alfaro Citation2019). The dendrogram and heatmap revealed three distinct clusters for the 23 antibiotics with different concentrations patterns (). Cluster I contained two antibiotics CIP and ENRO with higher concentrations in P6. The second cluster OTC, NAL, MNC and NOR with moderate and high concentrations while third cluster contains 17 antibiotics with the lowest concentrations. However, farms that used specific combination of various antibiotics were not specific within and across the regions. When we analyzed among the farms sampled in this study, no difference in the types of antibiotics usage among aquaculture farms (p > 0.05) were observed except for P6 farm in Perak which was notably different from the other farms with the highest concentration of antibiotics detected.
The variation in distribution, composition, detection frequency and concentration levels among the aquaculture farms may be attributed to the usage practices in aquaculture (e.g., disease, type of feed and feed additive containing antibiotic used by farmer), physicochemical reaction of antibiotic toward environmental parameters, and microbiological degradation of antibiotic by the aquatic or sediment bacteria (Hektoen et al. Citation1995; Le, Munekage, and Kato Citation2005). In this study, low or negligible concentrations of macrolides were observed as most bacterial pathogens of fish are Gram-negative bacteria (Haenen Citation2017). Macrolides are broad spectrum antibiotics that are effective against most Gram-positive bacteria, and ETM is the only macrolide used in fish farming and shrimp hatcheries in Southeast Asia (Lavilla-Pitogo Citation2017). Also, LIN was found in all the farms as it is commonly used in livestock and aquaculture infections (FAO Citation2005).
Most of the farms (n = 25, 86.2%) sampled in this study, used more than two antibiotics (average of five antibiotics). The highest total number of antibiotic compounds used in fish farms was nine, detected in four farms located at Kelantan (K2), Johor (J1) and Penang Island (PI1 and PI2), respectively. For shrimp farms, only one farm located in Perak (P6) used 11 antibiotic compounds. It is well known that there exists an extensive use of antibiotics in aquaculture around the globe (Tuševljak et al. Citation2013) with Asian countries more notable for their wider range of approved antibiotics (Serrano Citation2005). The sampled farms in Malaysia used a relatively lower and less diverse number of antibiotic compounds than the top producing countries in Asia [Thailand, (13 antibiotics used), China (33) and Vietnam (39)] (Rico et al. Citation2012; Phu et al. Citation2016; Lulijwa, Rupia, and Alfaro Citation2019). In contrast, Japan has significantly reduced antibiotic usage, and no antibiotic is reported in their aquaculture industry (Lulijwa, Rupia, and Alfaro Citation2019).
Tetracyclines
Tetracyclines were the most prevalent antibiotic detected in this study. Tetracyclines are widely used in the aquaculture industry, animal husbandry and human therapy due to their low cost and high efficacy against a broad spectrum of bacteria, parasites, and fungi (Mo et al. Citation2017). In Malaysia, tetracyclines are the second highest antibiotic used and is recently reported to reach 73,910 kg per year (Zakaria Citation2017). These antibiotics are commonly administered in feeds or dissolved in water to be absorbed by the gills. Among tetracyclines, our results showed that OTC, TC, MNC were the most commonly used tetracycline compounds among the farms but no CTC was detected. Our results contrasted with previous findings that reported OTC, TC, CTC and DOX as the most used tetracycline for treatment and prevention of diseases in aquaculture (Shamsuzzaman and Biswas Citation2012; Hazrat et al. Citation2016). However, this difference could be attributed to the different farms and the year of sampling (Table S4). In Malaysia, OTC, TC and CTC are permitted antibiotics used in aquaculture, and are registered under the National Pharmaceutical Regulatory Agency (NPRA), Ministry of Health. OTC, CTC and DOX also fall under WHO’s criteria of critically important antibiotics for human health and their usage are being restricted in veterinary and aquaculture sectors (Hassali et al. Citation2018).
Although the use of OTC as a growth promoter was banned by the EU in 2006 (Castanon Citation2007), OTC remains the most commonly used antibiotic in animal production and aquaculture and are often detected in aquaculture water in different countries (Nonaka, Ikeno, and Suzuki Citation2007; Suzuki and Hoa Citation2012). In Malaysia, pricing is one of the main reasons why OTC is more popular. In contrast, the usage of CTC and DOX is limited as they are more expensive (Treves-Brown Citation2000). As OTC is poorly absorbed in fish, and a high dosage of OTC is often required, excess OTC from aquaculture is eventually discharged to the environment (Lunestad and Goksøyr Citation1990).
When OTC concentrations were not detected in this study (<LOQ), this might be attributed to its physiochemical properties, biodegradation and photodegradation. OTC half-life ranges from 21–25 mins in aquaculture water, 2 days in freshwater, 12 days in seawater to as high as 150 days in marine sediment depending on the environmental conditions (e.g., pH, temperature, salinity, light) (Choo Citation1994; Brooks, Maul, and Belden Citation2008; Leal, Esteves, and Santos Citation2016). The degradation rates of OTC in river sediment and wastewater sludge have been reported to be higher than TC (Chang and Ren Citation2015; Yang et al. Citation2020).
Although tetracyclines remain one of the top three antibiotics used in the top producing countries in Asia, Lulijwa, Rupia, and Alfaro (Citation2019) reported a reduction from 92% to 73% in the usage of tetracyclines (Sapkota et al. Citation2008). In order to tackle the indiscriminate use of antibiotics, some Asian countries have banned the use of selected tetracyclines in aquaculture. TC was recently banned in Malaysia (The Sun Daily Citation2020) and is also not currently used in Vietnam and Singapore whereas CTC is not used in Indonesia, Singapore and Vietnam (ASEAN, Citation2013; Whitehead Citation2016). Singapore is the only country that do not use OTC (ASEAN, Citation2013) whereas CTC and OTC are prohibited in China (Liu, Steele, and Meng Citation2017). In Thailand, OTC and TC are still authorized for use in food animal (Lulijwa, Rupia, and Alfaro Citation2019).
MNC was also found in this study. MNC is a semisynthetic, second‐generation tetracycline derivative which is typically used in humans to treat acne (Garrido‐Mesa, Zarzuelo, and Gálvez Citation2013). To the best of our knowledge, no study has reported the presence of MNC residues in aquaculture water environments in worldwide. Moreover, this antibiotic is not authorized for use in aquaculture farms in Malaysia. Thus, the presence of MNC residues in seven farms with the highest concentration detected in P6, Perak (245 ng/L), suggested a misuse of antibiotic.
Sulfonamides
After tetracyclines, sulfonamides were the second most prevalent antibiotic found in aquaculture farms in this study. Sulfonamides were found in all the farms with the exception of two farms located in Selangor. The presence of sulfonamides in farm waters concurred with other studies (Jayachandran, Lleras-Muney, and Smith Citation2010). Sulfonamides are ubiquitous in the developing Asia aquatic ecosystem due to their low cost and more importantly, sulfonamides can be absorbed through gills. In addition, sulfonamides are highly soluble in water and highly mobile thus they can be easily transported and distributed in aquatic environments (Shi et al. Citation2012; Liu, Steele, and Meng Citation2017).
All the selected commonly used SAs antibiotics in animal treatment were detected in this study. SMR and STZ were the most commonly detected in Malaysia aquaculture farm. This was in contrast with other studies where SMT and SMX were commonly found in aquaculture or its adjacent environment (Giang et al. Citation2015; Hossain et al. Citation2017; Lai et al. Citation2018). Sulfonamides are commonly used alone or in combination with TMP or ormetoprim for better efficacy to combat bacterial infection. However only three farms (Pahang:PA4, Perak: P4 and Penang Island: PI2) were detected with low concentrations of TMP, suggesting that the usage of combination sulfonamides and TMP was less common in Malaysian aquaculture.
Similar to Vietnam, SMX, SMT, STZ and SMR were also detected in this study (Hoa et al. Citation2011; Giang et al. Citation2015; Harada Citation2018; Thai et al. Citation2018). The sulfonamide composition detected here is less diverse relative to China [SMX, SMT, SPD, sulfadiazine, sulfametoxydiazine, sulfomonothoxine, sulfameter, sulfaquinoxaline, sulfachloropyridazine] and Taiwan [SMX, STZ, sulfadiazine sulfaguanidine, sulfathazine, sulfamonomethoxine and sulfadimethoxine] (Lin, Yu, and Lin Citation2008; Chen et al. Citation2017; Lai et al. Citation2018; Wang et al. Citation2018a; Zhong et al. Citation2018; Yuan et al. Citation2019).
Quinolones
For quinolones, ENRO, NAL and OFX were the most commonly used. The selected quinolones were detected among the farms with the highest total concentration of 1.097 × 10⁶ ng/L. These antibiotics (ENRO, NAL and OFX) are widely administered in Asia aquaculture, and have become more popular than oxytetracycline over the last two decades (Hektoen et al. Citation1995). They are stable in water and sediment (Kümmerer Citation2004; Le and Munekage Citation2004). Lulijwa, Rupia, and Alfaro (Citation2019) revealed that about 55% of the global major aquaculture producing countries applied ENRO whereas the usage of CIP and NOR were at a lower frequency. This is distinctly different from Thailand and Vietnam (Suzuki and Hoa Citation2012) where 74% of Thailand shrimp farms primarily used NOR (Holmström et al. Citation2003). In shrimp pond areas in the mangroves of Vietnam, Le and Munekage (Citation2004) reported that NOR is detected in all shrimp ponds and surrounding canals whereas in Taiwan aquaculture, OFX, CIP and flumequine are present (Lin, Yu, and Lin Citation2008; Lai et al. Citation2018) (Table S4). In recent years, ENRO has been banned in Taiwan, Vietnam, Thailand but the ban in Malaysia only began from the year 2020 (MARD Citation2014; Tsai et al. Citation2019; The Sun Daily Citation2020). This could explain why we were still able to detect ENRO in the farms in Malaysia.
Regional comparison of antibiotic use
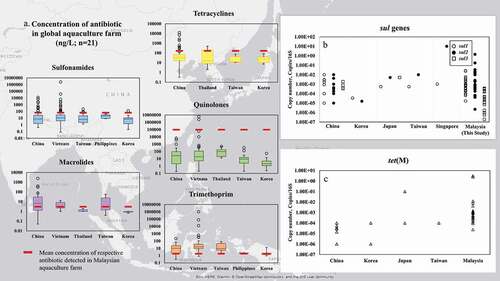
The composition of antibiotics varies between different countries showing the different practice of antibiotic administration in aquaculture. From the comparison of the published antibiotic concentrations available in aquaculture ()), the concentration of tetracyclines detected in this study were still lower than Thailand (2 -500 ng/L) and China (0.32 – 15 × 103 ng/L) but higher than Taiwan (11 – 75 ng/L) and Korea (7.1 – 95.4 ng/L). The concentrations of sulfonamides were comparable to aquaculture water in Taiwan but relatively lower compared to mariculture and aquaculture farms in China (0.4 –12429 ng/L), and Vietnam (0.08 – 2,390,000 ng/L).
For quinolones, the concentrations detected in Malaysia were higher than aquaculture farms in Thailand (13.2 – 490 ng/L), Taiwan (0.2 – 331 ng/L), Korea (0.88 - 54.5 ng/L) and Vietnam (0.2 - 60000 ng/L) ()). NOR and CIP are currently not used in Indonesia, Singapore, and Thailand (ASEAN, Citation2013). Although CIP has been banned in China and Vietnam, illegal use of this banned antibiotic is still being reported (Mo et al. Citation2017; MARD Citation2016; Chi et al. Citation2017; Tran et al. Citation2018). On the other hand, the LIN detected in this study was comparable to Vietnam (8–10 ng/L, Shimizu et al. Citation2013) and Korea (<LOQ – 14.8 ng/L, Kim, Lee, and Oh Citation2017) but lower than China and Taiwan (<LOQ – 1643 ng/L, Zhong et al. Citation2018).
A study by Segura et al. (Citation2015), suggested that the level of a country’s income has an effect on the occurrence of antibiotic in environment. However, our results revealed that the type of antibiotic measured and used will also influence the occurrence of antibiotic in environment. Our results (after excluding P6 result) showed that quinolone was two-fold higher compared to the low-income group (Ghana, India, Indonesia, Kenya, Philippines, Vietnam, Mozambique, Pakistan) whereas tetracyclines and sulfonamides measured were in the category comparable with low income group (sulfonamides: 15.5–112 ng/L tetracyclines: 29.3–289 ng/L). Our observations are in contrast to the status of Malaysia as an upper middle-income country (World Bank Citation2020).
Quantitative detection of antibiotic resistant genes
The prevalence of sul genes in Malaysian aquaculture farm was in the following frequency: sul2> sul1> sul3. Our results suggested that these genes were ubiquitous in aquaculture farms in Malaysia and was similar with marine mariculture in Japan (Suzuki et al. Citation2019) and marine mariculture in China (Chen et al. Citation2017). However, for pond aquaculture in China (Xiong et al. Citation2015; Su et al. Citation2017; Yuan et al. Citation2019) and effluent in Korea aquaculture farm (Jang et al. Citation2018), a different order of sul1> sul2> sul3 has been reported. The variation in gene distribution observed could be attributed to the difference in farming practices, bacterial population composition, types and antibiotic dosages used (Shimizu et al. Citation2013; Muñoz-Atienza et al. Citation2013; Rico et al. Citation2013). For instance, integrated fish farming practised throughout Asia is often with a closed system aquaculture where pond water does not frequently exchange. This can result in antibiotic resistance genes (ARGs) accumulating in pond water and sediment through horizontal gene transfer (Watts et al. Citation2017).
The sul1 and sul2 values detected in this study were comparable with net-pen aquaculture in Japan (Suzuki et al. Citation2019), Taiwan (Suzuki et al. Citation2019) and higher than aquaculture farm in Tianji, China (Gao et al. Citation2012), coastal aquaculture farm in South Korea (Jang et al. Citation2018) and aquaculture farm sediment (Gao et al. Citation2018). In comparison with the floating open cage aquaculture farm in Singapore, our sul2 abundance was lower (Ng et al. Citation2018). For sul3, the abundance was generally lower than China (Xiong et al. Citation2015) and Japan (Suzuki et al. Citation2019) ()).
Other than sul genes, we also measured tet(M) in this study. Our results are consistent with other findings that tet(M) was prevalent in aquaculture farms. The concentrations detected in this study were comparable with aquaculture farms in Taiwan (Suzuki et al. Citation2019), China (Gao et al. Citation2012; Xiong et al. Citation2015; Niu, Zhang, and Zhang Citation2016; Yan et al. Citation2018), South Korea (Jang et al. Citation2018) and Japan (Suzuki et al. Citation2019) ()).
In this study, no statistically significant (p > 0.05) correlation was found between concentrations of antibiotic and resistance genes. The targeted genes are historically “older” ones, which are already widely dispersed even as antibiotic contamination is reduced or non-prevalent. Similar uncoupling of ARGs and antibiotics have been reported in other areas (Takasu et al. Citation2011; Suzuki et al. Citation2015). Studies have shown that exposure to low concentrations of antibiotics for a long period can exert selective pressure and their transformation products also contribute in the development and dissemination of resistant bacteria and ARGs (Gullberg et al. Citation2011).
The prevalence of ARGs in a farm may be due to long term application of antibiotics in feed and water which may result in the accumulation of antibiotic residues at aquaculture farm. The farm then becomes a resistance hotspot to promote the growth of antibiotic resistance bacteria by exchanging resistance genes and thus altering the microbial community in water and sediment (Mohamed et al. Citation2000). The leaching of free-antibiotic, unconsumed antibiotic-feed or undegraded antibiotic-feces from aquaculture may also reach the groundwater and ocean through water circulation. This eventually end up in humans that consume antibiotic-contaminated drinks and food which pose a risk to public health.
Environmental ecological risk
For the ecological risk analysis, farms located in Kelantan, Perak and Pahang had the highest RQs. Three quinolones (ENRO, NOR, CIP) and LIN were found to have the potential to pose high risk to M. aeruginosa, S. leopoliensis, and P. subcapitata in aquaculture farms in Malaysia. Our results concurred with the findings from South Yellow Sea and aquaculture pond water around Lake Honghu in China where these antibiotics could pose high risk to cyanobacteria and algae (Du et al. Citation2017; Wang et al. Citation2017). In this study, SMX, CTM and TC were found to pose medium risk to cyanobacteria and algae. Several studies have also reported that SMX and CTM posed medium risk to various primary producers in rivers and pond waters where there are aquaculture activities (Zheng et al. Citation2012; Wang et al. Citation2017). In contrast, recent reports revealed that SMX and TC posed high risk to algae in Pearl River and Yellow Sea, China (Xu et al. Citation2013; Du et al. Citation2017; Wang et al. Citation2017).
Studies have shown that the coexistence of mixed antibiotics would pose a direct or indirect threat to the environment (González-Pleiter et al. Citation2013; Liu et al. Citation2014; Wang et al. Citation2018b). However, the risk caused by mixed antibiotics to the environment was not evaluated in this study as we employed a single-compound approach. In the future, environmental toxicity risk employing multi antibiotic approach is needed as the coexistence of mixed antibiotics can cause more significant adverse impact.
Conclusions
The present study reported on the antibiotic residues, ARGs and its associated potential ecology in the seven-main aquaculture production state in Peninsular Malaysia. Our study detected 23 antibiotics with the total concentration 1.099 × 10⁶ ng/L in which tetracyclines (83%), sulfonamides (72%) and quinolones (69%) had the highest detection frequency, indicating a wide distribution of antibiotics in aquaculture farms in Malaysia. Oxytetracycline, tetracycline, minocycline, sulfamerazine, sulfathiazole, enrofloxacin, nalidixic acid, and ofloxacin were the most abundant antibiotics. The minocycline was detected for the first time in aquaculture farms. The antibiotic residues detected were at a low or moderate level compared with Asian aquaculture farms except for quinolones. The dendrogram and heatmap showed that three antibiotic concentration patterns and no differences in the types of antibiotics usage among aquaculture farms were observed except for P6 farm in Perak. Overall, the relative abundance of resistance gene decreased according to the following frequencies: sul2> tet(M)>sul1> sul3 and no significant correlation was observed between antibiotic residue and resistance genes. Ciprofloxacin, enrofloxacin, norfloxacin and lincomycin were found to have high ecological risk to cyanobacteria and algae in Kelantan, Perak and Pahang. Overall, this study intensifies our understanding on antibiotic profile and bacterial resistome in aquaculture wastewater, as well as their potential impacts to organisms in environment. Prevention with proper environmental management should be conducted for aquaculture wastewater to mitigate the risks of antibiotic resistance to environment and public health through food chain.
Figure 1. Map of sampling sites. Red label indicates fish farm, blue label indicates prawn/shrimp farm and green label indicates prawn and fish farm
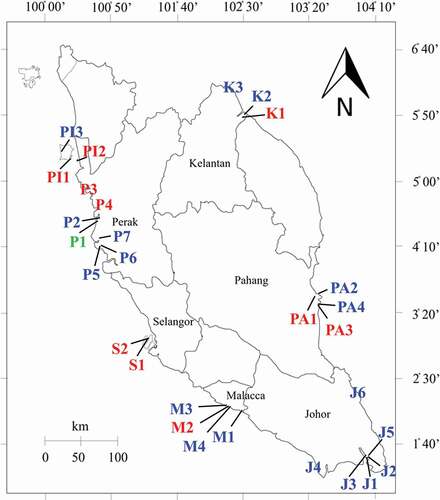
Figure 2. Relative abundance of selected antibiotic resistance genes, tet(M), sul1, sul2 and sul3 in seven main aquaculture production states. Vertical axis is copy number with normalized by 16S rRNA gene
Figure 3. Heatmap of 23 detected antibiotics clustered by concentration profiles in 29 aquaculture farms. Each cell represents the detection concentrations of antibiotic in each farm after logarithmic transformation (log ng/L). The dendrogram presented the sample site cluster analysis on the vertical axis and three antibiotic clusters on the horizontal axis (I, II and III)
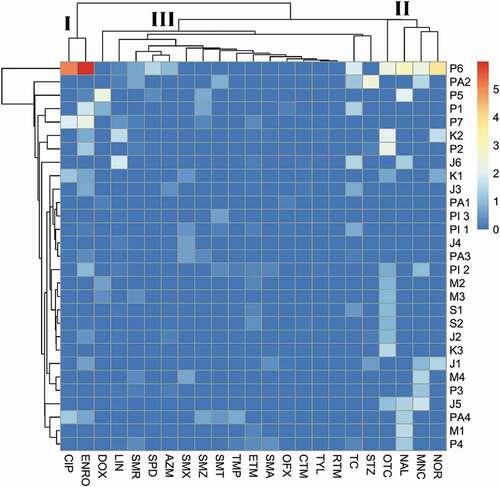
Figure 4. Comparison of antibiotic concentration (a), abundance of sul genes (b) and tet(M) (c) in aquaculture farm in East and Southeast Asia. Antibiotic concentration: China: .He et al. (Citation2012), Chen et al. (Citation2015), Xiong et al. (Citation2015), Song et al. (Citation2016), Chen et al. (Citation2017), Wang et al. (Citation2018a), Yuan et al. (Citation2019), Han et al. (Citation2020); Vietnam: Le and Munekage (Citation2004); Takasu et al. (Citation2011), Hoa et al. (Citation2011), Shimizu et al. (Citation2013), Andrieu et al. (Citation2015), Giang et al. (Citation2015), Harada (Citation2018), Thai et al. (Citation2018); Thailand: Takasu et al. (Citation2011); Shimizu et al. (Citation2013), Oliveira et al. (Citation2014); Taiwan: Lin, Yu, and Lin (Citation2008); Lai et al. (Citation2018); Philippines: Suzuki et al. (Citation2013); Korea: Kim, Lee, and Oh (Citation2017). Antibiotic resistance genes: China: Gao et al. (Citation2012), Xiong et al. (Citation2015), Gao et al. (Citation2018); Korea: Jang et al. (Citation2018); Japan and Taiwan: Suzuki et al. (Citation2019); Singapore: Ng et al. (Citation2018)
Disclosure of potential conflicts of interest
The author(s) declare that the research was conducted in the absence of any commercial or financial relationships that could be construed as a potential conflict of interest.
Supplemental Material
Download MS Word (38.1 KB)Acknowledgments
This research was supported by Malaysian Ministry of Higher Education (HiCoE Phase II (IOES-2014D), FP048-2013A, SF022-2013), University Malaya (PG309-2016A, IF030A-2017) and KAKENHI, JSPS (25257402, 16H01782, 17H04476). A part of this work was performed as collaboration project of Leading Academia in Marine and Environment Pollution Research (LaMer), Ehime University.
Supplementary material
Supplemental data for this article can be accessed here.
Additional information
Funding
References
- Andrieu, M., A. Rico, T. M. Phu, N. T. Phuong, and P. J. Van Den Brink. 2015. “Ecological Risk Assessment of the Antibiotic Enrofloxacin Applied to Pangasius Catfish Farms in the Mekong Delta, Vietnam.” Chemosphere 119: 407–18. doi:https://doi.org/10.1016/j.chemosphere.2014.06.062.
- ASEAN. (2013). “Guidelines for the Use of Chemicals in Aquaculture and Measures to Eliminate the Use of Harmful Chemicals. Jakarta: Indonesia.” Retrieved from https://www.asean.org/wp-content/uploads/images/Community/AEC/AMAF/UpdateApr2014/ASEAN%20Guideliness%20for%20Chemicals%20Final%20Draft%20Malaysia%20OK.pdf
- Bank, W. (2013). “Fish to 2030: Prospects for Fisheries and Aquaculture (English).” Retrieved from http://documents.worldbank.org/curated/en/458631468152376668/pdf/831770WP0P11260ES003000Fish0to02030.pdf
- Bank, W. (2020). “The World Bank in Malaysia.” Retrieved from https://www.worldbank.org/en/country/malaysia/overview
- Brooks, B. W., J. D. Maul, and J. B. Belden. 2008. “Antibiotics in Aquatic and Terrestrial Ecosystems.” Encyclopedia of Ecology 210–217. doi:https://doi.org/10.1016/B978-008045405-4.00370-0.
- Castanon, J. I. R. 2007. “History of the Use of Antibiotic as Growth Promoters in European Poultry Feeds.” Poultry Science 86 (11): 2466–2471. doi:https://doi.org/10.3382/ps.2007-00249.
- Chang, B. V., and Y. L. Ren. 2015. “Biodegradation of Three Tetracyclines in River Sediment.” Ecological Engineering 75: 272–277. doi:https://doi.org/10.1016/j.ecoleng.2014.11.039.
- Chen, C. Q., L. Zheng, J. L. Zhou, and H. Zhao. 2017. “Persistence and Risk of Antibiotic Residues and Antibiotic Resistance Genes in Major Mariculture Sites in Southeast China.” Science of the Total Environment 580: 1175–1184. doi:https://doi.org/10.1016/j.scitotenv.2016.12.075.
- Chen, H., S. Liu, X. R. Xu, S. S. Liu, G. J. Zhou, K. F. Sun, J. L. Zhao, and G. G. Ying. 2015. “Antibiotics in Typical Marine Aquaculture Farms Surrounding Hailing Island, South China: Occurrence, Bioaccumulation and Human Dietary Exposure.” Marine Pollution Bulletin 90 (1): 181–187. doi:https://doi.org/10.1016/j.marpolbul.2014.10.053.
- Chi, T. T. K., J. H. Clausen, P. T. Van, B. Tersbøl, and A. Dalsgaard. 2017. “Use Practices of Antimicrobials and Other Compounds by Shrimp and Fish Farmers in Northern Vietnam.” Aquaculture Reports 7: 40–47. doi:https://doi.org/10.1016/j.aqrep.2017.05.003.
- Choo, P. S. 1994. A Study of the Water Quality at A Coastal Cage-culture Site in Penang, Malaysia. Malaysia: Department of Fisheries, Ministry of Agriculture.
- Chuah, L.-O., M. E. Effarizah, A. M. Goni, and G. Rusul. 2016. “Antibiotic Application and Emergence of Multiple Antibiotic Resistance (MAR) in Global Catfish Aquaculture.” Current Environmental Health Reports 3 (2): 118–127. doi:https://doi.org/10.1007/s40572-016-0091-2.
- D’Costa, V. M., C. E. King, L. Kalan, M. Morar, W. W. L. Sung, C. Schwarz, D. Froese, et al. 2011. “Antibiotic Resistance Is Ancient.” Nature 477 (7365): 458–461. doi:https://doi.org/10.1038/nature10388.
- De Jesus Gaffney, V., V. V. Cardoso, M. J. Benoliel, and C. M. Almeida. 2016. “Chlorination and Oxidation of Sulfonamides by Free Chlorine: Identification and Behaviour of Reaction Products by UPLC-MS/MS.” Journal of Environmental Management 166: 466–477. doi:https://doi.org/10.1016/j.jenvman.2015.10.048.
- De La Peña, L. D., N. A. R. Cabillon, D. D. Catedral, E. C. Amar, R. C. Usero, W. D. Monotilla, A. T. Calpe, D. D. G. Fernandez, and C. P. Saloma. 2015. “Acute Hepatopancreatic Necrosis Disease (AHPND) Outbreaks in Penaeus Vannamei and P. Monodon Cultured in the Philippines.” Diseases of Aquatic Organisms 116 (3): 251–254. doi:https://doi.org/10.3354/dao02919.
- Department of Fisheries (DOF). (2019) “Annual Fisheries Statistic. Department of Fisheries Malaysia. Ministry of Agricultural and Agro-Based Industry, Putrajaya” Retrieved from https://www.dof.gov.my/index.php/pages/view/82
- Dermawan, A. (2019, September 9). “Fishermen Urged to Venture into Aquaculture. New Straits Times.” Retrieved from https://www.nst.com.my/news/nation/2019/09/519960/fishermen-urged-venture-aquaculture
- Du, J., H. Zhao, S. Liu, H. Xie, Y. Wang, and J. Chen. 2017. “Antibiotics in the Coastal Water of the South Yellow Sea in China: Occurrence, Distribution and Ecological Risks.” Science of the Total Environment 595: 521–527. doi:https://doi.org/10.1016/j.scitotenv.2017.03.28.
- European Commission (2003). “European Commission Technical Guidance Document in Support of Commission Directive 93//67/EEC on Risk Assessment for New Notified Substances and Commission Regulation (EC) No. 1488/94 on Risk Assessment for Existing Substance, Part II”, 100–103.
- FAO. 2005. Responsible Use of Antibiotics in Aquaculture. Rome, Italy: FAO Fisheries. Retrieved from http://www.fao.org/3/a0282e/a0282e.pdf
- FAO. 2016. The State of World Fisheries and Aquaculture 2016. Contributing to Food Security and Nutrition for All. Rome, Italy: The Food and Agriculture Organization. Retrieved from http://www.fao.org/3/i5555e/i5555e.pdf
- FAO. 2020. The State of World Fisheries and Aquaculture 2020. In Brief. Sustainability in Action. Rome, Italy: The Food and Agriculture Organization. Retrieved from http://www.fao.org/3/ca9229en/CA9229EN.pdf
- FAO and WHO. 2020. Residue evaluation of certain veterinary drugs Joint FAO/WHO Expert Committee on Food Additives - 88th Meeting 2019. Joint FAO/WHO Expert Committee on Food Additives (JECFA) Monographs No. 24. Rome, Italy: FAO and WHO. https://doi.org/https://doi.org/10.4060/ca9167en
- Food and Drug Administration. (2018). “U.S. Food and Drug Administration Import Refusals Report.” Retrieved from Food and Drug Administration website: https://www.accessdata.fda.gov/scripts/importrefusals/
- Gao, P., D. Mao, Y. Luo, L. Wang, B. Xu, and L. Xu. 2012. “Occurrence of Sulfonamide and Tetracycline-resistant Bacteria and Resistance Genes in Aquaculture Environment.” Water Research 46 (7): 2355–2364. doi:https://doi.org/10.1016/j.watres.2012.02.004.
- Gao, Q., Y. Li, Z. Qi, Y. Yue, M. Min, S. Peng, Z. Shi, and Y. Gao. 2018. “Diverse and Abundant Antibiotic Resistance Genes from Mariculture Sites of China’s Coastline.” Science of the Total Environment 630: 117–125. doi:https://doi.org/10.1016/j.scitotenv.2018.02.122.
- Garrido‐Mesa, N., A. Zarzuelo, and J. Gálvez. 2013. “Minocycline: Far beyond an Antibiotic.” British Journal of Pharmacology 169 (2): 337–352. doi:https://doi.org/10.1111/bph.12139.
- Giang, C. N. D., Z. Sebesvari, F. Renaud, I. Rosendahl, Q. H. Minh, and W. Amelung. 2015. “Occurrence and Dissipation of the Antibiotics Sulfamethoxazole, Sulfadiazine, Trimethoprim, and Enrofloxacin in the Mekong Delta, Vietnam.” PloS One 10 (7): e0131855. doi:https://doi.org/10.1371/journal.pone.0131855.
- González-Pleiter, M., S. Gonzalo, I. Rodea-Palomares, F. Leganés, R. Rosal, K. Boltes, E. Marco, and F. Fernández-Piñas. 2013. “Toxicity of Five Antibiotics and Their Mixtures Towards Photosynthetic Aquatic Organisms: Implications for Environmental Risk Assessment.” Water Research 47 (6): 2050–2064. doi:https://doi.org/10.1016/j.watres.2013.01.020.
- Gullberg, E., S. Cao, O. G. Berg, C. Ilbäck, L. Sandegren, D. Hughes, and D. I. Andersson. 2011. “Selection of Resistant Bacteria at Very Low Antibiotic Concentrations.” PLoS Pathogens 7 (7): e1002158. doi:https://doi.org/10.1371/journal.ppat.1002158.
- Haenen, O. (2017). “Major Bacterial Diseases Affecting Aquaculture [Powerpoint Slides]. In Aquatic AMR Workshop 1, Mangalore, India.” Retrieved from http://www.fao.org/fi/static-media/MeetingDocuments/WorkshopAMR/presentations/07_Haenen.pdf
- Hammer, Ø., D. A. Harper, and P. D. Ryan. 2001. “PAST: Paleontological Statistics Software Package for Education and Data Analysis.” Palaeontologia Electronica 4 (1): 9.
- Han, Q. F., S. Zhao, X. R. Zhang, X. L. Wang, C. Song, and S. G. Wang. 2020. “Distribution, Combined Pollution and Risk Assessment of Antibiotics in Typical Marine Aquaculture Farms Surrounding the Yellow Sea, North China.” Environment International 138: 105551. doi:https://doi.org/10.1016/j.envint.2020.105551.
- Harada, K. 2018. “Antibiotic Residue in Environmental Water in Vietnam.” Yakugaku Zasshi: Journal of the Pharmaceutical Society of Japan 138 (3): 271–275. doi:https://doi.org/10.1248/yakushi.17-00177-1.
- Hassali, M. A., R. Y. Ho, A. K. Verma, R. Hussain, and S. Sivaraman (2018). “Antibiotic Use in Food Animals: Malaysia Overview. Malaysia.” Retrieved from https://www.reactgroup.org/wp-content/uploads/2018/11/Antibiotic_Use_in_Food_Animals_Malaysia_Overview_2018web.pdf
- Hazrat, A., A. Rico, K. Murshed-e-jahan, and B. Belton. 2016. “An Assessment of Chemical and Biological Product Use in Aquaculture in Bangladesh.” Aquaculture 454: 199–209. doi:https://doi.org/10.1016/j.aquaculture.2015.12.025.
- He, X., Z. Wang, X. Nie, Y. Yang, D. Pan, A. O. W. Leung, Z. Cheng, Y. T. Yang, K. B. Li, and K. Chen. 2012. “Residues of Fluoroquinolones in Marine Aquaculture Environment of the Pearl River Delta, South China.” Environmental Geochemistry and Health 34 (3): 323–335. doi:https://doi.org/10.1007/s10653-011-9420-4. Chicago.
- Hektoen, H., J. A. Berge, V. Hormazabal, and M. Yndestad. 1995. “Persistence of Antibacterial Agents in Marine Sediments.” Aquaculture 133 (3–4): 175–184. doi:https://doi.org/10.1016/0044-8486(94)00310-K.
- Hernando, M. D., M. Mezcua, A. R. Fernández-Alba, and D. Barceló. 2006. “Environmental Risk Assessment of Pharmaceutical Residues in Wastewater Effluents, Surface Waters and Sediments.” Talanta 69 (2): 334–342. doi:https://doi.org/10.1016/j.talanta.2005.09.037.
- Heuer, H., A. Focks, M. Lamshöft, K. Smalla, M. Matthies, and M. Spiteller. 2008. “Fate of Sulfadiazine Administered to Pigs and Its Quantitative Effect on the Dynamics of Bacterial Resistance Genes in Manure and Manured Soil.” Soil Biology & Biochemistry 40 (7): 1892–1900. doi:https://doi.org/10.1016/j.soilbio.2008.03.014.
- Heuer, H., and K. Smalla. 2007. “Manure and Sulfadiazine Synergistically Increased Bacterial Antibiotic Resistance in Soil over at Least Two Months.” Environmental Microbiology 9 (3): 657–666. doi:https://doi.org/10.1111/j.1462-2920.2006.01185.x.
- Hoa, P. T. P., S. Managaki, N. Nakada, H. Takada, A. Shimizu, D. H. Anh, P. H. Viet, and S. Suzuki. 2011. “Antibiotic Contamination and Occurrence of Antibiotic-resistant Bacteria in Aquatic Environments of Northern Vietnam.” Science of the Total Environment 409 (15): 2894–2901. doi:https://doi.org/10.1016/j.scitotenv.2011.04.030.
- Holmström, K., S. Gräslund, A. Wahlström, S. Poungshompoo, B. E. Bengtsson, and N. Kautsky. 2003. “Antibiotic Use in Shrimp Farming and Implications for Environmental Impacts and Human Health.” International Journal of Food Science & Technology 38 (3): 255–266. doi:https://doi.org/10.1046/j.1365-2621.2003.00671.x.
- Hossain, A., S. Nakamichi, M. Habibullah-Al-Mamun, K. Tani, S. Masunaga, and H. Matsuda. 2017. “Occurrence, Distribution, Ecological and Resistance Risks of Antibiotics in Surface Water of Finfish and Shellfish Aquaculture in Bangladesh.” Chemosphere 188: 329–336. doi:https://doi.org/10.1016/j.chemosphere.2017.08.152.
- Jang, H. M., Y. B. Kim, S. Choi, Y. Lee, S. G. Shin, T. Unno, and Y. M. Kim. 2018. “Prevalence of Antibiotic Resistance Genes from Effluent of Coastal Aquaculture, South Korea.” Environmental Pollution 233: 1049–1057. doi:https://doi.org/10.1016/j.envpol.2017.10.006.
- Jayachandran, S., A. Lleras-Muney, and K. V. Smith. 2010. “Modern Medicine and the Twentieth Century Decline in Mortality: Evidence on the Impact of Sulfa Drugs.” American Economic Journal. Applied Economics 2 (2): 118–146. doi:https://doi.org/10.1257/app.2.2.118.
- Kim, H. Y., I. S. Lee, and J. E. Oh. 2017. “Human and Veterinary Pharmaceuticals in the Marine Environment Including Fish Farms in Korea.” Science of the Total Environment 579: 940–949. doi:https://doi.org/10.1016/j.scitotenv.2016.10.039.
- Kobayashi, T., L. Nonaka, F. Maruyama, and S. Suzuki. 2007. “Molecular Evidence for the Ancient Origin of the Ribosomal Protection Protein that Mediates Tetracycline Resistance in Bacteria.” Journal of Molecular Evolution 65: 228–235. doi:https://doi.org/10.1007/s00239-007-9006-z.
- Kümmerer, K. 2004. “Resistance in the Environment.” Journal of Antimicrobial Chemotherapy 54 (2): 311–320. doi:https://doi.org/10.1093/jac/dkh325.
- Lai, W. W. P., Y. C. Lin, Y. H. Wang, Y. L. Guo, and A. Y. C. Lin. 2018. “Occurrence of Emerging Contaminants in Aquaculture Waters: Cross-Contamination between Aquaculture Systems and Surrounding Waters.” Water, Air, and Soil Pollution 229 (8): 249. doi:https://doi.org/10.1007/s11270-018-3901-3.
- Lavilla-Pitogo, C. R. (2017). “Antimicrobial Usage in Aquaculture [Powerpoint Slides]. In Aquatic AMR Workshop 1, Mangalore, India.” Retrieved on from http://www.fao.org/fi/static-media/MeetingDocuments/WorkshopAMR/presentations/09_Lavilla_Pitogo.pdf
- Le, T. X., and Y. Munekage. 2004. “Residues of Selected Antibiotics in Water and Mud from Shrimp Ponds in Mangrove Areas in Vietnam.” Marine Pollution Bulletin 49 (11–12): 922–929. doi:https://doi.org/10.1016/j.marpolbul.2004.06.016.
- Le, T. X., Y. Munekage, and S. I. Kato. 2005. “Antibiotic Resistance in Bacteria from Shrimp Farming in Mangrove Areas.” Science of the Total Environment 349 (1): 95–105. doi:https://doi.org/10.1016/j.scitotenv.2005.01.006.
- Leal, J. F., V. I. Esteves, and E. B. H. Santos. 2016. “Use of Sunlight to Degrade Oxytetracycline in Marine Aquaculture’s Waters.” Environmental Pollution 213: 932–939. doi:https://doi.org/10.1016/j.envpol.2016.03.040.
- Lightner, D. V., R. M. Redman, C. R. Pantoja, B. L. Noble, and L. Tran. 2012a. “Early Mortality Syndrome Affects Shrimp in Asia.” Global Aquaculture Advocate 15 (1): 40.
- Lightner, D. V., R. M. Redman, C. R. Pantoja, K. F. J. Tang, B. L. Noble, P. Schofield, and S. A. Navarro. 2012b. “Historic Emergence, Impact and Current Status of Shrimp Pathogens in the Americas.” Journal of Invertebrate Pathology 110 (2): 174–183. doi:https://doi.org/10.1016/j.jip.2012.03.006.
- Lin, A. Y. C., T. H. Yu, and C. F. Lin. 2008. “Pharmaceutical Contamination in Residential, Industrial, and Agricultural Waste Streams: Risk to Aqueous Environments in Taiwan.” Chemosphere 74 (1): 131–141. doi:https://doi.org/10.1016/j.chemosphere.2008.08.027.
- Liu, X., J. C. Steele, and X. Z. Meng. 2017. “Usage, Residue, and Human Health Risk of Antibiotics in Chinese Aquaculture: A Review.” Environmental Pollution 223: 161–169. doi:https://doi.org/10.1016/j.envpol.2017.01.003.
- Liu, Y., J. Zhang, B. Gao, and S. Feng. 2014. “Combined Effects of Two Antibiotic Contaminants on Microcystis Aeruginosa.” Journal of Hazardous Materials 279 (148–155): 148–155. doi:https://doi.org/10.1016/j.jhazmat.2014.07.002.
- Lulijwa, R., E. J. Rupia, and A. C. Alfaro. 2019. “Antibiotic Use in Aquaculture, Policies and Regulation, Health and Environmental Risks: A Review of the Top 15 Major Producers.” Reviews in Aquaculture 12 (2): 640–663. doi:https://doi.org/10.1111/raq.12344.
- Lundgren, R., D. J. Staples, S. J. Funge-Smith, and J. Clausen. 2006. “Status and Potential of Fisheries and Aquaculture in Asia and the Pacific.” FAO Regional Office for Asia and the Pacific.” RAP PUBLICATION 2006/22. Retrieved from: http://www.fao.org/tempref/docrep/fao/009/ag110e/ag110e00.pdf
- Lunestad, B. T., and J. Goksøyr. 1990. “Reduction in the Antibacterial Effect of Oxytetracycline in Sea Water by Complex Formation with Magnesium and Calcium.” Diseases of Aquatic Organisms 9 (1): 67–72. doi:https://doi.org/10.3354/dao009067.
- Managaki, S., A. Murata, H. Takada, B. C. Tuyen, and N. H. Chiem. 2007. “Distribution of Macrolides, Sulfonamides, and Trimethoprim in Tropical Waters: Ubiquitous Occurrence of Veterinary Antibiotics in the Mekong Delta.” Environmental Science & Technology 41 (23): 8004–8010. doi:https://doi.org/10.1021/es0709021.
- MARD. (2014). “List of Drugs, Chemicals and Antibiotics of Banned or Limited Use for Aquaculture and Veterinary Purposes. Ministry of Agriculture and Rural Development, Hanoi.” Retrieved from https://vanbanphapluat.co/circular-no-08-vbhn-bnnptnt-2014-list-of-banned-restricted-drugs-chemicals-antibiotics
- MARD. 2016. List of Veterinary Drugs Banned from Use (Promulgated Together with Circular No. 2016/TT-BNN Dated 2016 of the Minister of Agriculture and Rural Development). Hanoi, Vietnam: ed Department of Animal Health MoAaRD.
- McCallum, H., D. Harvell, and A. Dobson. 2003. “Rates of Spread of Marine Pathogens.” Ecology Letters 6 (12): 1062–1067. doi:https://doi.org/10.1046/j.1461-0248.2003.00545.x.
- Mo, W. Y., Z. Chen, H. M. Leung, and A. O. W. Leung. 2017. “Application of Veterinary Antibiotics in China’s Aquaculture Industry and Their Potential Human Health Risks.” Environmental Science and Pollution Research 24 (10): 8978–8989. doi:https://doi.org/10.1007/s11356-015-5607-z.
- Mohamed, S., G. Nagaraj, F. H. C. Chua, and Y. G. Wang. 2000. “The Use of Chemicals in Aquaculture in Malaysia and Singapore„. In Use of Chemicals in Aquaculture in Asia: Proceedings of the Meeting on the Use of Chemicals in Aquaculture in Asia 20–22 May 1996, Tigbauan, Iloilo, Philippines (pp. 127–140). Tigbauan, Iloilo, Philippines: Aquaculture Department, Southeast Asian Fisheries Development Center.
- Mohd, F. O., H. Mazuki, M. E. Yeo, M. N. A. Amal, I. Natrah, G. C. Ho, and Z. Merican. 2017. “Transforming the Aquaculture Industry in Malaysia.” World Aquaculture 48 (2): 16–23.
- Muñoz-Atienza, E., B. Gómez-Sala, C. Araújo, C. Campanero, R. Del Campo, P. E. Hernández, C. Herranz, and L. M. Cintas. 2013. “Antimicrobial Activity, Antibiotic Susceptibility and Virulence Factors of Lactic Acid Bacteria of Aquatic Origin Intended for Use as Probiotics in Aquaculture.” BioMed Central Microbiology 13 (1): 15. doi:https://doi.org/10.1186/1471-2180-13-15.
- Ng, C., H. Chen, S. G. Goh, L. Haller, Z. Wu, F. R. Charles, A. Trottet, and K. Gin. 2018. “Microbial Water Quality and the Detection of Multidrug Resistant E. Coli and Antibiotic Resistance Genes in Aquaculture Sites of Singapore.” Marine Pollution Bulletin 135: 475–480. doi:https://doi.org/10.1016/j.marpolbul.2018.07.055.
- Niu, Z. G., K. Zhang, and Y. Zhang. 2016. “Occurrence and Distribution of Antibiotic Resistance Genes in the Coastal Area of the Bohai Bay, China.” Marine Pollution Bulletin 107 (1): 245–250. doi:https://doi.org/10.1016/j.marpolbul.2016.03.064.
- Nonaka, L., K. Ikeno, and S. Suzuki. 2007. “Distribution of Tetracycline Resistance Gene, tet(M), in Gram-positive and Gram-negative Bacteria Isolated from Sediment and Seawater at a Coastal Aquaculture Site in Japan.” Microbes and Environments 22 (4): 355–364. doi:https://doi.org/10.1264/jsme2.22.355.
- Nunan, L., D. Lightner, C. Pantoja, and S. Gomez-Jimenez. 2014. “Detection of Acute Hepatopancreatic Necrosis Disease (AHPND) in Mexico.” Diseases of Aquatic Organisms 111 (1): 81–86. doi:https://doi.org/10.3354/dao02776.
- Oliveira, R. A., R. McDonough, S. Matser, A. Khatikarn, J. Satapornvanit, K. Nogueira, A. J. A. Soares, A. M. V. M. Domingues, I., and P. J. Van Den Vrink. 2014. “Use, Fate and Ecological Risks of Antibiotics Applied in Tilapia Cage Farming in Thailand.” Environmental Pollution 192: 8–16. doi:https://doi.org/10.1016/j.envpol.2014.04.002.
- Pei, R., S. C. Kim, K. H. Carlson, and A. Pruden. 2006. “Effect of River Landscape on the Sediment Concentrations of Antibiotics and Corresponding Antibiotic Resistance Genes (ARG).” Water Research 40 (12): 2427–2435. doi:https://doi.org/10.1016/j.watres.2006.04.017.
- Phu, T. M., N. T. Phuong, T. T. Dung, D. M. Hai, V. N. Son, A. Rico, J. H. Clausen, H. Madsen, F. Murray, and A. Dalsgaard. 2016. “An Evaluation of Fish Health‐management Practices and Occupational Health Hazards Associated with Pangasius Catfish (Pangasianodon Hypophthalmus) Aquaculture in the Mekong Delta, Vietnam.” Aquaculture Research 47 (9): 2778–2794. doi:https://doi.org/10.1111/are.12728.
- Rico, A., K. Satapornvanit, M. M. Haque, J. Min, P. T. Nguyen, T. C. Telfer, and P. J. Van Den Brink. 2012. “Use of Chemicals and Biological Products in Asian Aquaculture and Their Potential Environmental Risks: A Critical Review.” Reviews in Aquaculture 4 (2): 75–93. doi:https://doi.org/10.1111/j.1753-5131.2012.01062.x.
- Rico, A., T. M. Phu, K. Satapornvanit, J. Min, A. M. Shahabuddin, P. J. Henriksson, F. J. Murray, D. C. Little, A. Dalsgaard, and P. J. Van Den Brink. 2013. “Use of Veterinary Medicines, Feed Additives and Probiotics in Four Major Internationally Traded Aquaculture Species Farmed in Asia.” Aquaculture 412: 231–243. doi:https://doi.org/10.1016/j.aquaculture.2013.07.028.
- Rizzotti, L., F. La Gioia, F. Dellaglio, and S. Torriani. 2009. “Molecular Diversity and Transferability of the Tetracycline Resistance Gene tet(M), Carried on Tn916-1545 Family Transposons, in Enterococci from a Total Food Chain.” Antonie Van Leeuwenhoek 96 (1): 43–52. doi:https://doi.org/10.1007/s10482-009-9334-7.
- Roberts, M. C., S. Schwarz, and H. J. M. Aarts. 2012. “Erratum: Acquired Antibiotic Resistance Genes: An Overview.” Frontiers in Microbiology 3: 384. doi:https://doi.org/10.3389/fmicb.2012.00384.
- Romero, J., C. G. Feijoó, and P. Navarrete. 2012. “Antibiotics in Aquaculture–use, Abuse and Alternatives.” Health and Environment in Aquaculture 159. doi:https://doi.org/10.5772/28157.
- Sapkota, A., A. R. Sapkota, M. Kucharski, J. Burke, S. McKenzie, P. Walker, and R. Lawrence. 2008. “Aquaculture Practices and Potential Human Health Risks: Current Knowledge and Future Priorities.” Environment International 34 (8): 1215–1226. doi:https://doi.org/10.1016/j.envint.2008.04.009.
- Sasikaladevi, R., V. Kiruthika Eswari, and I. M. Nambi. 2020. “Antibiotic Resistance and Sanitation in India: Current Situation and Future Perspectives.” Antibiotic Resistance in the Environment: A Worldwide Overview 91: 217–244. doi: https://doi.org/10.1007/698_2020_608.
- SEAFDEC. (2017). “Southeast Asian State of Fisheries and Aquaculture 2017. Southeast Asian Fisheries Development Center, Bangkok, Thailand, 167.” Retrieved from http://repositseafdec.org/bitstream/handle/20.500.12066/1092/SeaSOFIA2017.pdf?sequence=1&isAllowed=y
- Segura, P. A., H. Takada, J. A. Correa, K. El Saadi, T. Koike, S. Onwona-Agyeman, J. Ofosu-Anim, et al. 2015. “Global Occurrence of Anti-infectives in Contaminated Surface Waters: Impact of Income Inequality between Countries.” Environment International 80: 89–97. doi:https://doi.org/10.1016/j.envint.2015.04.001.
- Serrano, P. H. (2005). “Responsible Use of Antibiotics in Aquaculture.”Fisheries Technical Paper 469, Food and Agriculture Organization of the United Nations (FAO), Rome.
- Shamsuzzaman, M. M., and T. K. Biswas. 2012. “Aqua Chemicals in Shrimp Farm: A Study from South-west Coast of Bangladesh.” The Egyptian Journal of Aquatic Research 38 (4): 275–285. doi:https://doi.org/10.1016/j.ejar.2012.12.008.
- Shi, Y., L. Gao, W. Li, J. Liu, and Y. Cai. 2012. “Investigation of Fluoroquinolones, Sulfonamides and Macrolides in Long-term Wastewater Irrigation Soil in Tianjin, China.” Bulletin of Environmental Contamination and Toxicology 89 (4): 857–861. doi:https://doi.org/10.1007/s00128-012-0761-1.
- Shimizu, A., H. Takada, T. Koike, A. Takeshita, M. Saha, N. Nakada, A. Murata, et al. 2013. “Ubiquitous Occurrence of Sulfonamides in Tropical Asian Waters.” Science of the Total Environment 452: 108–115. doi:https://doi.org/10.1016/j.scitotenv.2013.02.027.
- Song, C., C. Zhang, L. Fan, L. Qiu, W. Wu, S. Meng, G. Hu, B. Kamira, and J. Chen. 2016. “Occurrence of Antibiotics and Their Impacts to Primary Productivity in Fishponds around Tai Lake, China.” Chemosphere 161: 127–135. doi:https://doi.org/10.1016/j.chemosphere.2016.07.009.
- Stentiford, G. D., K. Sritunyalucksana, T. W. Flegel, B. A. Williams, B. Withyachumnarnkul, O. Itsathitphaisarn, and D. Bass. 2017. “New Paradigms to Help Solve the Global Aquaculture Disease Crisis.” PLoS Pathogens 13 (2): e1006160. doi:https://doi.org/10.1371/journal.ppat.1006160.
- Su, H., S. Liu, X. Hu, X. Xu, W. Xu, Y. Xu, Z. Li, W. G. Liu, Y, and Y. Cao. 2017. “Occurrence and Temporal Variation of Antibiotic Resistance Genes (Args) in Shrimp Aquaculture: ARGs Dissemination from Farming Source to Reared Organisms.” Science of the Total Environment 607: 357–366. Get rights and content. doi:https://doi.org/10.1016/j.scitotenv.2017.07.040.
- Suzuki, M. T., L. T. Taylor, and E. F. DeLong. 2000. “Quantitative Analysis of Small-subunit rRNA Genes in Mixed Microbial Populations via 5′-nuclease Assays.” Applied and Environmental Microbiology 66 (11): 4605–4614. doi:https://doi.org/10.1128/AEM.66.11.4605-4614.2000.
- Suzuki, S., M. Ogo, T. Koike, H. Takada, and B. Newman. 2015. “Sulfonamide and Tetracycline Resistance Genes in Total-and Culturable-bacterial Assemblages in South African Aquatic Environments.” Frontiers in Microbiology 6: 796. doi:https://doi.org/10.3389/fmicb.2015.00796.
- Suzuki, S., M. Ogo, T. W. Miller, A. Shimizu, H. Takada, and M. A. Siringan. 2013. “Who Possesses Drug Resistance Genes in the Aquatic Environment?: Sulfamethoxazole (SMX) Resistance Genes among the Bacterial Community in Water Environment of Metro-Manila, Philippines.” Frontiers in Microbiology 4: 102. doi:https://doi.org/10.3389/fmicb.2013.00102.
- Suzuki, S., and P. T. P. Hoa. 2012. “Distribution of Quinolones, Sulfonamides, Tetracyclines in Aquatic Environment and Antibiotic Resistance in Indochina.” Frontiers in Microbiology 3: 67. doi:https://doi.org/10.3389/fmicb.2012.00067.
- Suzuki, S., S. Nakanishi, M. Tamminen, T. Yokokawa, Y. Sato-Takabe, K. Ohta, H. Chou, W. Muziasari, and M. Virta. 2019. “Occurrence of Sul and tet(M) Genes in Bacterial Community in Japanese Marine Aquaculture Environment Throughout the Year: Profile Comparison with Taiwanese and Finnish Aquaculture Waters.” Science of the Total Environment 669: 649–656. doi:https://doi.org/10.1016/j.scitotenv.2019.03.111.
- Takasu, H., S. Suzuki, A. Reungsang, and P. H. Viet. 2011. “Fluoroquinolone (FQ) Contamination Does Not Correlate with Occurrence of FQ-resistant Bacteria in Aquatic Environments of Vietnam and Thailand.” Microbes and Environments 26 (2): 135–143. doi:https://doi.org/10.1264/jsme2.ME10204.
- Tamminen, M., A. Karkman, A. Lõhmus, W. I. Muziasari, H. Takasu, S. Wada, S. Suzuki, and M. Virta. 2011. “Tetracycline Resistance Genes Persist at Aquaculture Farms in the Absence of Selection Pressure.” Environmental Science & Technology 45 (2): 386–391. doi:https://doi.org/10.1021/es102725n.
- Thai, P. K., V. N. Binh, P. H. Nhung, P. T. Nhan, N. Q. Hieu, N. T. Dang, N. K. B. Tam, and N. T. K. Anh. 2018. “Occurrence of Antibiotic Residues and Antibiotic-resistant Bacteria in Effluents of Pharmaceutical Manufacturers and Other Sources around Hanoi, Vietnam.” Science of the Total Environment 645: 393–400. doi:https://doi.org/10.1016/j.scitotenv.2018.07.126.
- The Sun Daily. (2020, January 22). “Veterinary Dept Will Ban Six Antibiotics on Livestock on Aug 31.” Retrieved from https://www.thesundaily.my/local/veterinary-dept-will-ban-six-antibiotics-on-livestock-on-aug-31-XL1926743
- Tran, K. C., M. P. Tran, T. Van Phan, and A. Dalsgaard. 2018. “Quality of Antimicrobial Products Used in White Leg Shrimp (Litopenaeus Vannamei) Aquaculture in Northern Vietnam.” Aquaculture 482: 167–175. doi:https://doi.org/10.1016/j.aquaculture.2017.09.038.
- Tran, L., L. Nunan, R. M. Redman, L. L. Mohney, C. R. Pantoja, K. Fitzsimmons, and D. V. Lightner. 2013. “Determination of the Infectious Nature of the Agent of Acute Hepatopancreatic Necrosis Syndrome Affecting Penaeid Shrimp.” Diseases of Aquatic Organisms 105 (1): 45–55. doi:https://doi.org/10.3354/dao02621.
- Treves-Brown, K. M. 2000. “Tetracyclines.” In Applied Fish Pharmacology, pp.64–82. Springer: Dordrecht. doi: https://doi.org/10.1007/978-94-017-0761-9
- Tsai, M. Y., C. F. Lin, W. C. Yang, C. T. Lin, K. H. Hung, and G. R. Chang. 2019. “Health Risk Assessment of Banned Veterinary Drugs and Quinolone Residues in Shrimp through Liquid Chromatography–tandem Mass Spectrometry.” Applied Sciences 9 (12): 2463. doi:https://doi.org/10.3390/app9122463.
- Tuševljak, N., L. Dutil, A. Rajić, F. C. Uhland, C. McClure, S. St‐Hilaire, R. J. Reid-Smith, and S. A. McEwen. 2013. “Antimicrobial Use and Resistance in Aquaculture: Findings of a Globally Administered Survey of Aquaculture‐allied Professionals.” Zoonoses and Public Health 60 (6): 426–436. doi:https://doi.org/10.1111/zph.12017.
- Wang, W., X. Gu, L. Zhou, H. Chen, Q. Zeng, and Z. Mao. 2018a. “Antibiotics in Crab Ponds of Lake Guchenghu Basin, China: Occurrence, Temporal Variations, and Ecological Risks.” International Journal of Environmental Research and Public Health 15 (3): 548. doi:https://doi.org/10.3390/ijerph15030548.
- Wang, Z., Q. Chen, L. Hu, and M. Wang. 2018b. “Combined Effects of Binary Antibiotic Mixture on Growth, Microcystin Production, and Extracellular Release of Microcystis Aeruginosa: Application of Response Surface Methodology.” Environmental Science and Pollution Research 25 (1): 736–748. doi:https://doi.org/10.1007/s11356-017-0475-3.
- Wang, Z., Y. Du, C. Yang, X. Liu, J. Zhang, E. Li, Q. Zhang., and X. Wang. 2017. “Occurrence and Ecological Hazard Assessment of Selected Antibiotics in the Surface Waters in and around Lake Honghu, China.” Science of the Total Environment 609: 1423–1432. doi:https://doi.org/10.1016/j.scitotenv.2017.08.009.
- Watts, J. E., H. J. Schreier, L. Lanska, and M. S. Hale. 2017. “The Rising Tide of Antimicrobial Resistance in Aquaculture: Sources, Sinks and Solutions.” Marine Drugs 15 (6): 158. doi:https://doi.org/10.3390/md15060158.
- Whitehead, R. J. (2016, April 20) “Report: Almost All Vietnamese Cattle and Seafood Farms Use Antibiotics.” Food Navigator-Asia. Retrieved from https://www.foodnavigator-asia.com/Article/2016/04/21/Report-Almost-all-Vietnamese-cattle-and-seafood-farms-use-antibiotics
- World Health Organization (WHO) (2018). “Antibiotic Resistance.” Retrieved from https://www.who.int/news-room/fact-sheets/detail/antibiotic-resistance
- Xiong, W., Y. Sun, T. Zhang, X. Ding, Y. Li, M. Wang, and Z. Zeng. 2015. “Antibiotics, Antibiotic Resistance Genes, and Bacterial Community Composition in Fresh Water Aquaculture Environment in China.” Microbial Ecology 70 (2): 425–432. doi:https://doi.org/10.1007/s00248-015-0583-x.
- Xu, W., W. Yan, X. Li, Y. Zou, X. Chen, W. Huang, L. Miao, R. Zhang, G. Zhang, and S. Zou. 2013. “Antibiotics in Riverine Runoff of the Pearl River Delta and Pearl River Estuary, China: Concentrations, Mass Loading and Ecological Risks.” Environmental Pollution 182: 402–407. doi:https://doi.org/10.1016/j.envpol.2013.08.004.
- Yan, M., C. Xu, Y. Huang, H. Nie, and J. Wang. 2018. “Tetracyclines, Sulfonamides and Quinolones and Their Corresponding Resistance Genes in the Three Gorges Reservoir, China.” Science of the Total Environment 631: 840–848. doi:https://doi.org/10.1016/j.scitotenv.2018.03.085.
- Yang, Y., G. Zeng, D. Huang, C. Zhang, D. He, C. Zhou, W. Wang, et al. 2020. “Molecular Engineering of Polymeric Carbon Nitride for Highly Efficient Photocatalytic Oxytetracycline Degradation and H2O2 Production.” Applied Catalysis. B, Environmental 118970. doi:https://doi.org/10.1016/j.apcatb.2020.118970.
- Yuan, J., M. Ni, M. Liu, Y. Zheng, and Z. Gu. 2019. “Occurrence of Antibiotics and Antibiotic Resistance Genes in a Typical Estuary Aquaculture Region of Hangzhou Bay, China.” Marine Pollution Bulletin 138: 376–384. doi:https://doi.org/10.1016/j.marpolbul.2018.11.037.
- Zakaria, B. M. (2017). “Use of Antimicrobial Agent in Veterinary Medicine in Malaysia (Powerpoint Slides).” Retrieved from http://vam.org.my/home/wp-content/uploads/2017/11/Mazuki_AMU-in-Vet-Med.pdf
- Zheng, Q., R. Zhang, Y. Wang, X. Pan, J. Tang, and G. Zhang. 2012. “Occurrence and Distribution of Antibiotics in the Beibu Gulf, China: Impacts of River Discharge and Aquaculture Activities.” Marine Environmental Research 78: 26–33. doi:https://doi.org/10.1016/j.marenvres.2012.03.007.
- Zhong, Y., Z. F. Chen, X. Dai, S. S. Liu, G. Zheng, X. Zhu, S. Liu, Y. Yin, G. Liu, and Z. Cai. 2018. “Investigation of the Interaction between the Fate of Antibiotics in Aquafarms and Their Level in the Environment.” Journal of Environmental Management 207: 219–229. doi:https://doi.org/10.1016/j.jenvman.2017.11.030.