
 ?Mathematical formulae have been encoded as MathML and are displayed in this HTML version using MathJax in order to improve their display. Uncheck the box to turn MathJax off. This feature requires Javascript. Click on a formula to zoom.
ABSTRACT
Urban greenery has positive impacts on the well-being of residents and provides vital ecosystem services. A quantitative evaluation of full-view green coverage at the human scale can guide green space planning and management. We developed a still camera to collect hemisphere-view panoramas (HVPs) to obtain in situ heterogeneous scenes and established a panoramic green cover index (PGCI) model to measure human-scale green coverage. A case study was conducted in Xicheng District, Beijing, to analyze the quantitative relationships of PGCI with the normalized difference vegetation index (NDVI) and land surface temperature (LST) in different land use scenarios. The results show that the HVP is a useful quantization tool: (1) the method adaptively distinguishes the green cover characteristics of the four functional areas, and the PGCI values are ranked as follows: recreational area (29.6) > residential area (19.0) > traffic area (15.9) > commercial area (12.5); (2) PGCI strongly explains NDVI and LST, and for each unit (1%) increase in PGCI, NDVI tends to increase by 0.007, and (3) LST tends to decrease by 0.21 degrees Celsius. This research provides government managers and urban planners with tools to evaluate green coverage in complex urban environments and assistance in optimizing human-scale greenery and microclimate.
Introduction
Urban greenery has a positive effect on the health of inhabitants, and it plays a vital role in improving their mood and relieving stress (Van den Berg, Hartig, and Staats Citation2007; De Vries et al. Citation2013; Tyrväinen et al. Citation2014). The availability of green space resources for citizens is affected by many factors, such as traffic conditions, plant distribution, and urban spatial layout (Barbosa et al. Citation2007; Kabisch et al. Citation2016; Schule, Gabriel, and Bolte Citation2017; Xu, Haase, and Pauleit Citation2018). The inequality of green space resources for citizens is an urgent problem to solve in the urban development procedure (Astell-Burt et al. Citation2014; Sikorska et al. Citation2020). The urban landscape planning projects of China have made great efforts to create people-oriented environments to satisfy people’s needs. The Ministry of Housing and Urban-Rural Development in China released the “Guiding Opinions on Promoting the Development of Healthy Urban Landscapes” to accelerate the construction and availability of various types of greenbelts in metropolitan areas. In this context, the technologies required to describe and analyze human-scale green coverage in heterogeneous urban landscapes have become more important for researchers, planners and managers.
Human-scale urban space refers to the physical settings and scope that are perceptible to citizens and closely related to their production and life (Folke, Holling, and Perrings Citation1996; Zhang et al. Citation2018; Lang et al. Citation2020). Human-scale research focuses on social, economic and ecological processes at the human perception scale to obtain subtle metrics (Folke, Holling, and Perrings Citation1996). Moreover, the multi-source results can be merged to the block scale (geographic units bounded by roads, railways or rivers) to model with other statistical or open source data (Liu et al. Citation2015). Traditional human-scale research methods such as questionnaires, interviews, public scoring and auditing can be helpful to reflect the views, attitudes and perceptions of urban green space (Meitner Citation2004; Jim and Chen Citation2006; Janse and Konijnendijk Citation2007; Clarke et al. Citation2010; Griew et al. Citation2013). Nevertheless, those methods, particularly auditing and scoring, require many professionals and much time and money (Ellaway, Macintyre, and Bonnefoy Citation2005). Several studies using remote sensing images based on sky or space collection have attempted to measure green spaces at the city scale, but they cannot represent the city landscape at the human scale from a panoramic view (Alonzo et al. Citation2015; Cetin Citation2015; Li et al. Citation2015b).
Scene pictures are a reflection of the objective world and a well-recognized data medium at the human scale. Many researchers have treated pictures as the data source (referred to as stimuli in certain studies) for urban landscape research because they involve the visual memories of photographers at different geographical locations (Gandy and Meitner Citation2007; Wang, Zhao, and Meitner Citation2017; Wang et al. Citation2019). For example, Meitner (Citation2004) proposed 360-degree cylinder panoramas at the Grand Canyon and related subjective assessment ratings to locations by showing subjects the slides. The results indicated that the panoramas were suitable material for visual perception by people in real scenes and that they could be easily understood and accepted by the public. Asgarzadeh applied a fish-eye lens to take images and projected scenes through 3D-CG modeling (3DSMAX) in an experimental room (Asgarzadeh et al. Citation2012). The results indicated that trees in front of buildings could mitigate perceived oppressiveness (Asgarzadeh et al. Citation2010, Citation2012). Some studies use hemispherical projection images to perform urban environmental monitoring, such as using hemispherical photos to calculate the leaf area index (LAI) (Jonckheere et al. Citation2004) or the sky view factor (SVF), to assess the degree of greening or shading in urban roads and improve the travel safety and health of pedestrians (Li and Ratti Citation2018; Li, Ratti, and Seiferling Citation2018). However, the impact of panoramic greenery in different land use scenarios on the vegetation coverage or the surface thermal environment remains to be discussed.
Scene pictures are common data sources to measure urban physical settings. Yang et al. (Citation2009) first employed the green view index (GVI) model using pictures from a DSLR camera in four directions at the center of crossroads in Berkeley, California. The experimental results indicated that their method was feasible and effective for assessing the visibility of urban greenness at a human scale. However, Yang’s method has several limitations: (1) the captured pictures cannot cover the entire view of the pedestrians; and (2) the shooting and analysis processes rely on manual operations, which are time consuming. Subsequent studies (Li et al. Citation2015a, Citation2015b; Long, Liu, and Ma Citation2017) have improved upon Yang’s method. Recently, geo-tagged photos, especially Google Street View (GSV) pictures, have become a popular data source to study urban physical settings. GSV pictures are available to the public and cover many street segments. Li et al. (Citation2015a) used GSV pictures for urban greenery assessment and developed an automatic unsupervised classification method for green vegetation segmentation. Subsequently, Li et al. (Citation2015a) focused on the living environments of urban residents in terms of street greenery in Hartford, Connecticut, USA, and found that residents with lower income levels tend to live on streets with less greenery, whereas the rich can see more greenery in their communities. Long, Liu, and Ma (Citation2017) extended the research scale and adopted Tencent street view (TSV) pictures to the GVI calculation. In summary, the aforementioned research suggests a trend of larger spatial scale and data size, automated image processing and analyses combined with social factors, particularly socio-economic factors (Li et al. Citation2015a, Citation2016).
However, GSV and TSV pictures retain some limitations: (1) many SVPs in the same area, particularly TSV pictures in China, have a large time span, which reduces the comparability of different sites, and (2) the SVPs can hardly characterize the physical environment inside blocks because street buildings can block large parts of pedestrians’ sight (Long, Liu, and Ma Citation2017; Dong, Zhang, and Zhao Citation2018). Some blind areas remain because of the limitation of street view monitoring vehicles, especially narrow pedestrian or residential streets in the Beijing center area (Dong, Zhang, and Zhao Citation2018; Zhang and Dong Citation2018; Fu et al. Citation2019). Therefore, the on-site measurement of greenery remains necessary because of these limitations and the actual demands of site investigation and long-term observations. Moreover, the properties of GSV and TSV pictures, such as the heading angles and vertical angles, have not been standardized; they were adopted based on the understanding and experiments of researchers, which may hinder the comparisons of results (Dong, Zhang, and Zhao Citation2018). Thus, we suggest using panoramas to fully represent the entire cityscape. In this context, we developed an on-site monitoring method that can quantify green coverage simply and uniformly for users, which can supplement the literature on urban greenery.
In our study, hemisphere-view panoramas (HVPs) were developed to represent the heterogeneous environment at the human scale. Then, a typical sampling method was proposed to determine where to shoot the HVPs on site. Next, a green threshold segmentation (GTS) algorithm was designed to automatically calculate the panoramic green cover index (PGCI) of each sampling spot. Finally, by combining the conventional remote sensing metrics, normalized difference vegetation index (NDVI) and land surface temperature (LST), we discuss the relationship between the PGCI and these metrics under different land use circumstances to determine the effect of the panoramic-view green coverage on the vegetation conditions and urban surface heat. The intention of our research is to provide specialized people-oriented panoramas and a quantification tool in small-scale blocks for urban management departments to evolve urban spaces into more pleasant and comfortable places.
Materials and methods
The method for evaluating human-scale green coverage in this study involved 4 parts: acquisition of hemisphere-view panoramas, segmentation of green vegetation, a case study of the PGCI model and typical sampling in Xicheng District, Beijing, and regression analysis between the PGCI, NDVI and LST. Detailed explanations of each part are provided below.
Acquisition of the hemisphere-view panoramas
The hemisphere-view panorama acquisition procedure includes the following three steps: (1) setting up the panoramic camera; (2) fine-tuning the devices (to ensure that the panoramic camera is perpendicular to the ground); and (3) taking an HVP picture at one sampling site.
As shown in (), the HVP picture production method is divided into three parts: (1) obtaining the entire field of view (FOV) of the panoramic camera ()); (2) placing visual sensors to face 8 different directions to simultaneously capture sub-images ()); (3) stitching the sub-images into a hemisphere-view panorama ()). Once the stitching step is completed, the three-dimensional scene is compressed into a two-dimensional plane, which is referred to as an HVP ()). In addition, the top of each HVP picture is oriented toward the north.
Figure 1. Calculated panoramic green cover index (PGCI) values at a human scale using hemisphere-view panoramas (HVPs). (A-C) stitching process of the hemisphere-view panorama (HVP). (D) hemisphere-view panorama equipment, which includes (1) a 360-degree panoramic camera, (2) a laptop as the controller and data receiver, (3) a mobile power source, and (4) a specific tripod. (E) workflow to the calculate PGCI value
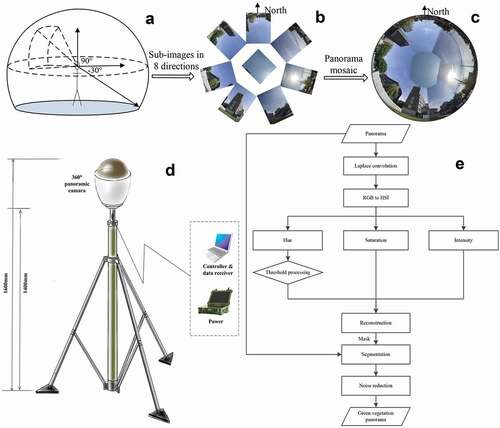
We used a custom-made camera with 8 visual sensors (1/2.5ʹ CMOS), each of which had 1.3 million pixels, as a cityscape collector. As shown in ()), 7 sensors were arranged at equal angles (approximately 51.43 degrees) in the horizontal direction, and 1 sensor was placed in the vertical direction. The FOV of the camera is −30 to 90 degrees in the vertical direction and 360 degrees in the horizontal direction. In addition, the hemisphere-view panorama has 800 × 800 pixels, and it is saved as a 24-bit TIF image.
In our experiments, two image-processing scripts were developed in MATLAB, which helped us automatically calculate the ratio of green coverage in the HVPs. The HVP stitching software could splice all sub-images captured by the visual sensors into one integrated HVP. Then, the PGCI calculation software implemented the GTS algorithm to calculate the PGCI values.
Segmentation of green vegetation in the hemisphere-view panoramas
The strategies for green vegetation segmentation between the hemisphere-view panoramas and photographs taken by a DSLR camera or SVPs are different. First, the objects that must be processed and analyzed are the pixels in the circular area of the HVPs. Second, when ambient light conditions are poor, the “blocking effect” will occur on the HVPs, and image pre-processing is necessary to reduce these side effects. Thus, we developed the GTS algorithm for integrally extracting greenery in the green spectrum from HVPs.
The flowchart for the GTS algorithm is shown in ()), and the specific explanations are as follows. First, we used the Laplace operator to convolute the HVPs to decrease the negative influence generated by the blocking effect during image stitching, and we converted the HVPs from RGB to HSI color space. Second, the HVPs were separated into the hue, saturation and intensity components (H, S and I, respectively). Third, the algorithm distinguished between green plants and the background by an H component threshold from 75 to 170 degrees (obtained through fine-tuning experiments for the HVPs by adjusting the threshold). Then, grayscale images were reconstructed from the three components and converted to binary images to mask the original HVPs. Fourth, a median filter and morphological treatment were applied to denoise the masked HVPs because some noise was created during threshold processing and image reconstruction. The speed of the GTS algorithm is very fast (approximately 0.2 s per picture with an Intel I7-8705 CPU), which also supports the multi-process acceleration.
PGCI model
The HVP, which was stitched from 8 sub-images, was processed by the aforementioned GTS algorithm to calculate the green view index. The GVI model proposed by Yang et al. (Citation2009) had to be modified for our study. We redefined the panoramic green cover index, which is the ratio of the number of pixels for green plant areas to the total number of pixels in the effective area of the panorama. The formula is as follows:
Areag is the number of pixels calculated from the green vegetation picture using the GTS algorithm, and Areac is the number of pixels of the effective area of the entire panorama, which is the circular area in the center of the panorama for HVPs. PGCI is the green coverage (containing canopies and shrubs) in a certain urban location at the human scale.
Case study of Xicheng District, Beijing
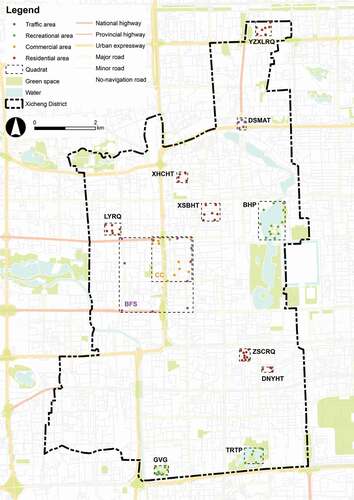
Xicheng District is a typical area in Beijing, China. It has strong political, economic, cultural and tourism elements and demonstrates that Beijing has the characteristics of an ancient civilization. From Beijing’s statistical yearbooks (Beijing Municipal Bureau of Statistics and NBS Survey Office in Beijing Citation2013, Citation2015, Citation2018), we summarized the data for the major functional areas in Xicheng District for 2013, 2015 and 2018 (). The data indicate that the total acreage of residential, recreational (places of interest, old culture parks and royal gardens), commercial, and traffic areas composed over 95% of Xicheng District in 2013, 2015 and 2018 and that the proportions of the four functional areas were very stable. In the four major functional areas, residential areas had the highest proportion (the average proportion was greater than 50% in 2013, 2015 and 2018). Therefore, we used a packet sampling method to delimit the twelve quadrats in () and confirmed the approximate number of sampling points in each quadrat based on the proportions of the four functional areas. () shows a distribution map of the samples and quadrats in Xicheng District. In addition, HVPs were collected from 24–29 September 2018, and the data collection time was limited to between 10:00 and 14:00 to ensure the consistency of the HVPs.
Table 1. Areas of the four functional types in 2013, 2015 and 2018
Table 2. Descriptive information of 12 typical quadrats in Xicheng District
Figure 2. Distribution map of samples and quadrats in Xicheng District, Beijing
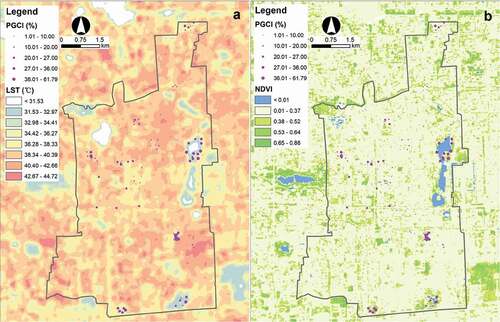
NDVI and LST calculations
In this research, the NDVI values are used to analyze their quantitative relationship with vegetation coverage (PGCI) from the “ground-to-air” perspective and explore whether PGCI will affect the LST, aiming to verify that PGCI is a potential metric for shading provision and temperature control. To match the acquisition time of the in situ HVPs, the experiment used Landsat 8 OLI/TIRS satellite images acquired on 19 September 2018, and the data were obtained from the USGS website (https://earthexplorer.usgs.gov/). The coordinate system of the layer is set to CGCS2000, and the grid resolution is 30 m. The image collection is adopted to synthesize the raster of the target study area and perform standardized operations such as cloud removal, radiation calibration, and atmospheric correction in the preparation stage. Finally, the NDVI and LST results are obtained through band calculations.
The vegetation index method is a common tool for remote sensing to monitor the growth and distribution of vegetation (Mu et al. Citation2018; Osgouei et al. Citation2019). This index is widely used to qualitatively and quantitatively evaluate vegetation coverage (Osgouei and Kaya Citation2017; Gao et al. Citation2020). At present, the most common vegetation index is the NDVI, and the formula is shown below:
In formula (2), NIR is the reflection value in the near-infrared band and R is the reflection value in the infrared band. When , the ground objects are often clouds, water and other ground objects that strongly reflect visible light; when
, it represents rock or bare soil;
indicates that there is vegetation coverage, and greater vegetation coverage corresponds to a greater NDVI value. The thematic map that characterizes PGCI and NDVI is shown in ()) below.
Figure 3. Land surface temperature (LST) and normalized difference vegetation index (NDVI) maps of Xicheng District. (A) LST map; (B) NDVI map
There are three commonly used LST inversion methods to retrieve LST from remote sensing data: single-channel, mono-window and split-window algorithms (Xiao et al. Citation2007; Guha et al. Citation2020a, Citation2020b). This research applied the single-channel method (Sobrino et al. Citation2004) and the thermal band (10.6–11.19 micrometers, Band 10 of the Landsat 8 image) to calculate LST. The digital number (DN) of the thermal band was converted to the spectral radiance:
where is the spectral radiance,
is the multiplicative rescaling factor of Band 10, and
is the band-specific additive rescaling factor from the metadata.
The next step was to convert the spectral radiance into a satellite brightness temperature (i.e., black body temperature, ) using the following conversion formula:
where is the at-satellite temperature in Kelvin (K) and
is the spectral radiance at the sensor aperture.
and
are constants in Kelvin. For Landsat 8 TIRS Band 10,
and
. The emissivity-corrected LST was computed according to Xiao et al. (Citation2007) as follows:
where ,
, and
is land surface emissivity, which was obtained using NDVI threshold methods (Sobrino et al. Citation2004). The values of emissivity are as follows:
when
;
when
;
when
. Here,
is the vegetative proportion expressed as follows:
where is the maximum value of NDVI and
is the minimum value of NDVI.
Finally, the LST map is shown in ()) to link the PGCI sample points with the pixel cells (the LST values have been converted from Kelvin to degrees Celsius). We take the sample points as the centers and make circular buffers with a radius of 30 m (to match the cell size and shape), calculate the mean NDVI and LST raster values that intersect with the buffers, and finally join them in a relationship table for subsequent regression analysis.
Results
To measure the human-scale green coverage, we introduce HVP and PGCI into the field assessment work, employing these tools to supplement traditional remote sensing measurements and to enhance ground vegetation settings for better experience. The experimental results are presented in three main respects: 1) the panoramic green vegetation segmentation quality; 2) the geographical distribution of in situ PGCI values; and 3) the regression performance between PGCI, NDVI and LST to verify the accuracy, feasibility and effectiveness of our method and explore the connections of different perspective metrics (“ground-to-air:” PGCI; “air-to-ground:” NDVI and LST).
Panoramic green vegetation segmentation results
()) show the segmentation results for four HVPs in different functional areas. The HVPs in ()) represent the residential, recreational, commercial and traffic areas. ((II)) shows the initial green vegetation results obtained by the workflow in ). Compared to those in the original HVP pictures ()), most of the pixels in the green spectrum are correctly represented in the initial green vegetation results. However, some salt-and-pepper noise (Chan, Ho, and Nikolova Citation2005) and burrs, which can be mistakenly identified as green pixels, remain in the initial green vegetation results and should be excluded. Therefore, we use a median filter and a morphological processing method to filter out the noise and burrs. ((III)) shows the refined vegetation segmentation results of our methods. ((IV)) shows the green vegetation results that were manually segmented by Adobe Photoshop CS5 (Adobe Systems, Inc., San Jose, California). ((IV)) is used as a reference picture or the so-called “ground truth” in computer vision to compare with the original HVPs.
Figure 4. Green vegetation segmentation results and ground truth: I original HVP pictures; II initial segmentation results; III refined segmentation results; IV ground truth. The area in the red circle is variable Areac in formula (1), which is called the effective area of the HVP
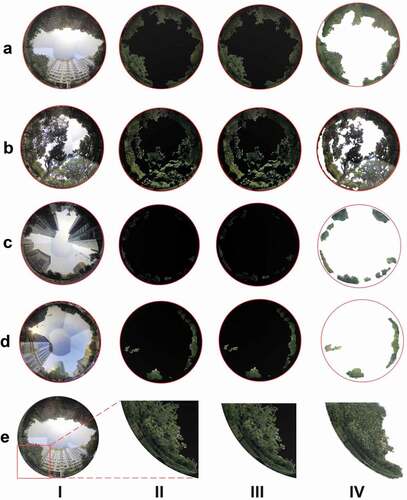
The area within the red rectangular line in ()) was enlarged to better visualize the detailed green vegetation segmentation results. The enlarged GTS result is shown in ((II,e)), and the refined GTS result is shown in ((III,e)). ((IV,E)) shows the results manually extracted by Photoshop. The comparison of the four images illustrates that the GTS algorithm can precisely segment vegetation in the HVP. Compared with semantic segmentation at the pixel level in deep learning, our method has the advantages of low cost and rapid processing (Badrinarayanan, Kendall, and Cipolla Citation2017) and avoids long-term labeling and training.
Another assessment of the accuracy of the GTS results was performed when 20 randomly selected HVP pictures were used by a random function in MATLAB toolkits. The correlation coefficient between the values calculated by the PGCI model and the reference results calculated by the ground truth is 0.95, p < 0.000, and the formula of the regression line is y= 0.83x+4.44. These results demonstrate that the two variables are highly similar. In addition, the root mean square error (RMSE) is 3.5, suggesting that our method can precisely segment the proportion of green vegetation in HVPs.
PGCI distribution of the four functional types in Xicheng District
The histogram in ()) shows the distribution of the PGCI results for all 97 HVP pictures using formula (1) in Xicheng District. ()) shows the distribution of the PGCI results among the four different function types. The average PGCI value for all samples is 20.6 ()). There are 22 PGCI values greater than 30, 21 of which occur in residential and recreational areas ()). ()) also shows that the highest PGCI average is 29.6, which is in a recreational area.
Figure 5. Statistics and spatial distribution of the panoramic green cover index (PGCI) in the study area. (A) histogram plot of all 97 sample points; (B) histogram plots of 4 functional areas; (C) distribution map of PGCI values at the point and quadrat levels. The HVPs of different sample points represent the human-scale cityscape, and the quadrats correspond to the block scale
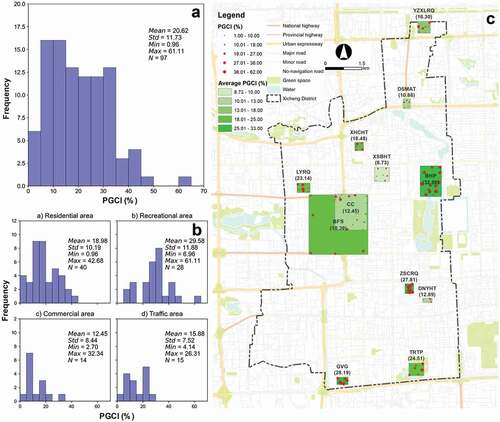
As shown in ()), we use the PGCI average to represent the quadrat with green blocks (quadrat scale) of different color depths on the map, and we use red dots with 5 increasing sizes to delineate the amount of green that people can see at the sample location (human scale). To differentiate the green degree, we classify the PGCI into 5 sub-sections at the site level: not green (≤10), slightly green (11–19), somewhat green (20–27), green (28–36), and very green (>36). The layout of the sampling sites in the 4 functional areas has the following characteristics. In the residential areas, modern communities (ZSCRQ and LYRQ) have a higher average PGCI value than the old Beijing hutongs (DNYHT, XHCHT, and XSBHT). In the recreational areas, 3 quadrats (BHP, TRTP and GVG) have an average value higher than the overall mean of the quadrats. In the BHP quadrat, the mean PGCI value in the south is higher than that in the north. In the commercial area, the only quadrat (SYZX) is located in the northeast corner of BFS. There are 2 quadrats in the traffic areas: DSMAT and BFS. DSMAT is unique because it is a historical and cultural site and an important pavement and subway hub in Xicheng District. In the BFS quadrat, 5 sample points overlap with the CC quadrat (see ), but the HVP pictures in traffic areas were photographed on the road, and the HVP pictures in commercial areas were photographed in the public space of the block. The average values of these 2 quadrats are calculated and separately discussed. In summary, the PGCI values show diversification under different land use circumstances, which reflects the unbalanced characteristics of human-scale green coverage.
Regression analysis of PGCI, NDVI and LST
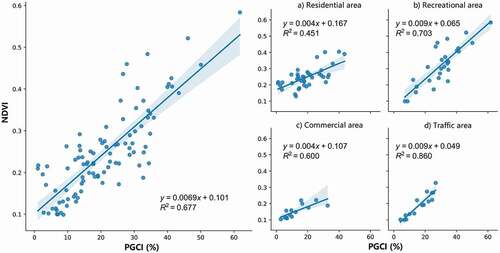
The regression results for PGCI and NDVI (see ) show that under different land use effects, there is a very significant positive correlation between PGCI and NDVI (R2 = 0.677, P < 0.000); i.e., the higher the PGCI, the higher the nearby NDVI value tends to be. According to the fitting model, a unit (1%) change in PGCI can explain a change in NDVI value of approximately 0.007. Because the HVPs reflect the same imaging space, the higher the PGCI is, the lusher the vegetation detected by the device; therefore, the NDVI value tends to be higher. The PGCI can reflect the human-scale vegetation coverage to a certain extent.
Figure 6. Relationship between panoramic green cover index (PGCI) and normalized difference vegetation index (NDVI)
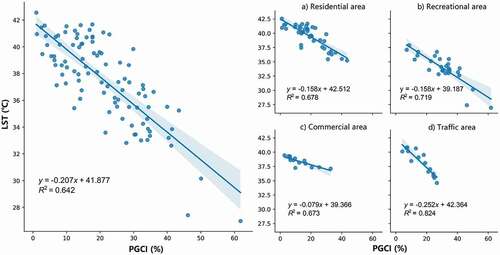
Nevertheless, the regression results between PGCI and LST (see ) show that in different land use function scenarios, PGCI and LST have a very significant negative correlation (R2 = 0.642, P < 0.000), which means that the higher the PGCI, the lower the ground thermal temperature tends to be. The regression model shows that each unit of PGCI change explains approximately 0.207 degrees Celsius of ground temperature change. This result may occur because high coverage green space can absorb and reflect sunlight and more easily provide a larger shade area to mitigate the surface temperature. In summary, the PGCI has a significant correlation with the ground green coverage and the degree of surface heat relief.
Figure 7. Relationship between panoramic green cover index (PGCI) and land surface temperature (LST)
Discussion
This research aims to provide a new metric (PGCI) and algorithm (GTS) for landscape planners to evaluate in situ green coverage in heterogeneous urban environments; this study also supplies references for understanding the quantitative relationship between hemisphere-view (PGCI) and vertical-view metrics (NDVI and LST) to further improve human-scale greenery and thermal environments. The contents of the discussion section are organized as follows: first, we illustrate the accuracy and efficiency of the PGCI model based on the HVP equipment and GTS algorithm; second, we analyze the heterogeneous PGCI of 4 functional areas in the study area; third, we explain the PGCI values of the 4 functional quadrats and the quantitative relationships with NDVI and LST; and finally, we suggest potential applications to urban greenery planning.
Accuracy of the GTS algorithm and PGCI model
The accuracy of quantitative models and equipment often determines the quality of field evaluations. Based on the quantitative model of Yang et al. (Citation2009), we proposed the PGCI model to complete the calculation of the green coverage in panoramas. A still panoramic camera was deployed to obtain HVP pictures in different urban functional areas. The HVP pictures could represent the full-view environment in the form of a hemisphere-view panorama. Furthermore, we designed and implemented the GTS algorithm to extract green vegetation precisely and quickly from HVP pictures; then, we used the PGCI model to obtain the PGCI values for all samples. In addition, unified photography devices, photography programs and image-processing software were employed such that the PGCI results were highly temporally and spatially comparable between samples or blocks. Finally, the comparison results for the three methods, i.e., (1) comparisons of the HVP pictures with the ground truth, (2) regression analysis of PGCI values obtained using the GTS algorithm versus the reference pictures obtained manually using Photoshop and (3) contrasts of enlarged pictures, demonstrated that the PGCI model calculation and GTS extraction were accurate and valid.
Characteristics of PGCI values in different functional areas
After verifying the accuracy of the PGCI calculation, we explored the spatial distribution of PGCI values under different functions: residential, recreational, commercial and traffic functional areas. The recreational areas have the highest mean PGCI among all functional areas. The quadrats in the recreation areas in () are typical places of interest, old culture parks and royal gardens in Xicheng District. These particular cityscapes have exceptional resource advantages in terms of verdurization because of national protection policies and the splendid design by ancient Chinese based on Feng Shui theory (Mak and Ng Citation2005).
The CC quadrat is the first large-scale overall directional development functional zone of the financial industry and business center in Beijing, and it integrates many core Chinese financial institutions. Therefore, as a commercial functional area, it has a strong representation. In the CC quadrat, examination of the satellite imagery from AutoNavi indicates that the forms of building clusters can be divided into two main classes, namely, enclosed blocks and open blocks and that open block are dominant in the CC quadrat. In our study, we considered that the enclosed blocks are blocks surrounded by buildings and with public spaces inside, whereas the open blocks are the opposite. Enclosed blocks can partially hinder sight by pedestrians and decrease the amount of greenery that people can see; thus, buildings may impose oppressiveness on pedestrians. Otherwise, the HVPs in the CC quadrat suggest that the green plants are quite small and the buildings are dominant. Lange suggested that scenes where buildings are the dominant component or green vegetation is scarce will have lower preference ratings (Lange, Hehl-Lange, and Brewer Citation2008). Moreover, Asgarzadeh theorized that the configuration of trees in front of tall buildings can alleviate the psychological stress on observers and that the distance from the observers to the trees has a small effect on the result (Asgarzadeh et al. Citation2010, Citation2012, Citation2014). The virtual condition of the CC quadrat can be understood based on these theories that green coverage in front of high-rise buildings is scarce and that high buildings oppress pedestrians. Therefore, increasing the number and coverage of trees and shrubs in front of high-rise buildings can alleviate the oppressiveness and unpleasantness in commercial areas.
Before the residential quadrats were selected and the experiment began, we investigated accessibility, i.e., whether a residential property allowed on-site investigation to be conducted, since most residential areas in Beijing have adopted the so-called “sealed management” pattern. In the residential area quadrats, the modern communities have higher PGCI values than the old Beijing hutongs (see ). Our case study indicates that the surroundings of the old quadrangles and hutongs in the study area lack greenery, although the housing prices in those areas are extremely high. Otherwise, the evidence shows that the YZXLRQ quadrat has the lowest PGCI value among the modern communities. This quadrat has high-rise apartments and high-density building clusters. The configuration of green coverage is low shrubs and spire-shaped evergreen trees distributed in strips between the buildings, and few public green spaces are available in the community. We carefully assessed the HVP pictures and found that the HVP pictures of YZXLRQ are highly similar to those of CC. The common characteristics of YZXLRQ and CC are high proportions of artificial construction and low PGCI values in the HVP pictures. Therefore, municipal administrative departments must pay more attention to the negative effects of configurations with little greenery and high-rise and high-density apartment buildings.
Regarding the quadrats in traffic areas, the spatial distributions of the DSMAT and BFS quadrats are discussed in the results section. In the DSMAT quadrat, the PGCI values in the north (15.3) are higher than those in the south (6.1). Small greenbelts are located on both sides of the roads around Deshengmen Archery Tower, and there are very few trees and shrubs in the turntable for the two samples in the south. The sample interval in the BFS quadrat is approximately 700 meters, and the BFS is mainly composed of four major roads – the south-north major roads and west-east national roads that enclose the block. ()) shows that the national roads have a higher PGCI value (22.7) than the major roads (13.4) in the BFS. In general, the GVI value tends to be low along wide streets, particularly at crossroads, because of foreshortening effects (Yang et al. Citation2009). Some important roads (such as national roads or walking streets in the city center) may have more greening construction resources due to the high road utilization rate or even strategic value in the economy. Esthetically, these roads may better represent the cityscape; thus, the government places greater importance on the construction and greening of these roads. Therefore, the green cover index in traffic areas could be affected by not only conventional factors such as road width, shooting angle and distance but also economic factors such as government attention to road greening and construction, which should be further considered and verified in the future. In summary, the results of this study show that our method can be applied in various functional areas; it also helps planners and managers understand the amount of green coverage on site and assists in human-scale urban greening.
Impact of full-view green vegetation coverage on the thermal environment
Urbanization promotes population development and agglomeration and significantly improves socio-economic benefits and resource utilization efficiency (Dissanayake et al. Citation2019). However, it contributes to forest deterioration and triggers the formation of urban heat islands (Dissanayake et al. Citation2018) and the degradation of ecosystem services (Qu et al. Citation2020). There is a complex dynamic relationship between the landscape pattern of public green space and the surface thermal environment (Weng, Lu, and Schubring Citation2004). The configuration and coverage of small green patches make an important contribution to alleviating the urban heat island effect, but their importance is often overlooked (Li, Zhou, and Ouyang Citation2013).
The traditional remote sensing method uses the “air-to-ground” perspective to control the coverage of different green landscapes from a macro perspective (Mushore et al. Citation2016). Some urban-oriented case studies in arid regions have shown that NDVI and LST have a significantly negative correlation (Dissanayake et al. Citation2018, Citation2019; Guha et al. Citation2020a). This correlation occurs because population and economic activities produce more carbon emissions and the expansion of built-up areas, causing heterogeneous gradients in NDVI and urban heat islands (Dissanayake et al. Citation2019). Case studies from the Yangtze River Basin in China show that ecological restoration projects (especially ecological afforestation projects) have improved the level of vegetation cover at the regional scale (Qu et al. Citation2018, Citation2020), but human-scale greening and microclimate control should receive more attention, especially in high-density built-up areas.
This article uses HVPs to supplement the traditional remote sensing paradigm from a “ground-to-air” perspective, conducts field measurements of urban miniaturization and full-view vegetation coverage, and then explores the impact of PGCI on the greenery coverage and land surface temperature in different functional quadrats. Using PGCI as an indicator to analyze its associations with NDVI and LST, we can estimate the temperature control magnitude of green cover from a human-scale perspective and provide a fine metric for improving the urban microclimate. The relationship model between PGCI and NDVI (see ) is established by coupling the PGCI value of each sample point and the NDVI pixel interpretation by remote sensing from space. The regression results show that PGCI can explain the NDVI to a certain extent. The higher the PGCI of the sample point is, the denser the vegetation coverage under the panoramic view angle, and the higher the NDVI of the plant tends to be. The PGCI reflects the vegetation growth coverage on the human scale in terms of ecosystem services, which has a quantitative reference value for fine-scale green space planning.
The model results show that PGCI and LST (see ) present a very significant negative correlation; i.e., an increase in PGCI can alleviate the surface thermal environment. This relationship is due to the significant positive correlation between PGCI and NDVI and the significant effect of vegetation coverage in high-density built-up areas on controlling the surface LST (Mbuh, Wheeler, and Cook Citation2019; Guha et al. Citation2020a, Citation2020b). Using HVPs, landscape planners can quantify and regulate the ground microclimate from the perspective of citizens, which is helpful to optimize the surrounding or internal environmental quality of residential communities. The shading function of the urban green tree canopy provides protection for urban residents and pedestrians (Olsen, Kennedy, and Vanos Citation2019). The canopy acts as an umbrella by absorbing and reflecting solar radiation, reduces the risk of pedestrian heatstroke, and forms a relatively comfortable buffer space for humans to work, relax or perform other activities. In particular, it can provide protection for groups who need to work outdoors for a long time. In summary, HVPs and PGCI can provide on-site analysis tools for human-scale green coverage and can be used as a method of observation for studying the effects of urban ground green coverage and temperature control.
Potential applications for human-scale green space planning
Based on the accuracy verification, spatial variation, and thermal environment correlation of PGCI, we find that our method can provide management support as auxiliary information for urban planners and policy makers who strive to achieve pleasant and comfortable urban spaces. First, additional details about a city can be obtained through the panoramic information from HVPs and the PGCI distribution map at the block level, and a revised plan for ecological greenery can be established. Furthermore, the physical settings in HVPs are sequential and heterogeneous. These characteristics make the HVP pictures suitable for objectively quantifying urban green coverage. Second, this research can serve as a reference and tool for the government in greenbelt planning, pocket park construction, microclimate adaptation and shade provision. Third, for certain locations with heavily damaged green vegetation and a dramatic decline in the PGCI caused by accidents, such as fire or man-made sabotage, our tool can be used to quantifiably measure the PGCI on site, providing evidence to a law court or supervision department and advancing justice in the urban green environment (Wang et al. Citation2007). Finally, our approach is more convenient for the urban environment supervision department to obtain internal area PGCI data on site at different locations. These data can be used as an objective quantitative tool for government greening programmes and landscape planning. The PGCI can be used as an indicator when measuring in situ urban greenery to enhance greening services and provide guidance to adapt the microclimates. From the citizen’s viewpoint, regulators can give reasonable and specific advice regarding low-PGCI areas, optimize green infrastructures and construct a green, harmonious and environmentally friendly city that prioritizes people’s experience.
Some limitations remain in this research. Due to the distance and time cost of intra-city traffic movement, the HVP still lacks spatial coverage capability. Hence, some variation occurs in the acquisition times of Landsat 8 images and the HVPs, which may introduce some bias to the regression model. In addition, we plan to address long-term sequence and multi-equipment fixed-point monitoring in urban ecological monitoring stations and then quantitatively control the spatiotemporal and seasonal variations.
Conclusion
Urban greenery plays a key role in improving the well-being of residents. Creating a new quantitative method to measure the green coverage that people can access in urban environments is very important for landscape planners and managers. This paper describes a ground-based quantitative method to extract the green vegetation in HVPs using an efficient GTS algorithm and the PGCI model. Furthermore, in situ measurements were conducted in Xicheng District, Beijing, to verify the validity and feasibility. The method is adaptive, as demonstrated by the transverse contrast of the typical quadrats of 4 main functional quadrats and the contrast in PGCI values. The PGCI values of the 4 functional quadrats are ranked as follows: recreational area (29.6) > residential area (19.0) > traffic area (15.9) > commercial area (12.5). Through regression analysis, the experimental results indicate that the human-scale PGCI metric has significant correlations with the green coverage of the surroundings and the surface LST. High green coverage at the human scale is beneficial to reduce the surface LST in urban built-up areas. This result has positive importance for regulating the greening configuration, adapting the thermal environments and improving the well-being of human settlements. Using the quantitative tools of the PGCI model and HVPs, landscape planners can better understand the connection between greenery settings and citizens’ experiences to further enhance eco-environmental services.
Disclosure of potential conflicts of interest
No potential conflict of interest was reported by the author(s).
Acknowledgments
This study was supported by the National Key Research and Development Programme of China (2016YFC0503605). Special thanks to Professor Jingzhu Zhao for his guidance on this research. We thank our colleagues Siyuan Li, Tao Wang, Jiaxun Li, Tianshu Yu and Sha Qiu for their assistance and support in the field assessment process. Thank you to the anonymous reviewers for their valuable comments and suggestions.
Additional information
Funding
References
- Alonzo, M., B. Bookhagen, J. P. McFadden, A. Sun, and D. A. Roberts. 2015. “Mapping Urban Forest Leaf Area Index with Airborne Lidar Using Penetration Metrics and Allometry.” Remote Sensing of Environment 162: 141–15. doi:https://doi.org/10.1016/j.rse.2015.02.025.
- Asgarzadeh, M., T. Koga, K. Hirate, M. Farvid, and A. Lusk. 2014. “Investigating Oppressiveness and Spaciousness in Relation to Building, Trees, Sky and Ground Surface: A Study in Tokyo.” Landscape and Urban Planning 131: 36–41. doi:https://doi.org/10.1016/j.landurbplan.2014.07.011.
- Asgarzadeh, M., T. Koga, N. Yoshizawa, J. Munakata, and K. Hirate. 2010. “Investigating Green Urbanism; Building Oppressiveness.” Journal of Asian Architecture and Building Engineering 9 (2): 555–562. doi:https://doi.org/10.3130/jaabe.9.555.
- Asgarzadeh, M., A. Lusk, T. Koga, and K. Hirate. 2012. “Measuring Oppressiveness of Streetscapes.” Landscape and Urban Planning 107 (1): 1–11. doi:https://doi.org/10.1016/j.landurbplan.2012.04.001.
- Astell-Burt, T., X. Feng, S. Mavoa, H. M. Badland, and B. Giles-Corti. 2014. “Do Low-Income Neighbourhoods Have the Least Green Space? A Cross-Sectional Study of Australia’s Most Populous Cities.” BMC Public Health 14 (1): 292. doi:https://doi.org/10.1186/1471-2458-14-292.
- Badrinarayanan, V., A. Kendall, and R. Cipolla. 2017. “SegNet: A Deep Convolutional Encoder-Decoder Architecture for Image Segmentation.” IEEE Transactions on Pattern Analysis and Machine Intelligence 39 (12): 2481–2495. doi:https://doi.org/10.1109/TPAMI.2016.2644615.
- Barbosa, O., J. A. Tratalos, P. R. Armsworth, R. G. Davies, R. A. Fuller, P. Johnson, and K. J. Gaston. 2007. “Who Benefits from Access to Green Space? A Case Study from Sheffield, UK.” Landscape and Urban Planning 83 (2–3): 187–195. doi:https://doi.org/10.1016/j.landurbplan.2007.04.004.
- Beijing Municipal Bureau of Statistics and NBS Survey Office in Beijing. 2013.
- Beijing Municipal Bureau of Statistics and NBS Survey Office in Beijing. 2015.
- Beijing Municipal Bureau of Statistics and NBS Survey Office in Beijing. 2018.
- Cetin, M. 2015. “Using GIS Analysis to Assess Urban Green Space in Terms of Accessibility: Case Study in Kutahya.” International Journal of Sustainable Development & World Ecology 22 (5): 420–424. doi:https://doi.org/10.1080/13504509.2015.1061066.
- Chan, R. H., C. W. Ho, and M. Nikolova. 2005. “Salt-and-Pepper Noise Removal by Median-Type Noise Detectors and Detail-Preserving Regularization.” IEEE Transactions on Image Processing : A Publication of the IEEE Signal Processing Society 14 (10): 1479–1485. doi:https://doi.org/10.1109/tip.2005.852196.
- Clarke, P., J. Ailshire, R. Melendez, M. Bader, and J. Morenoff. 2010. “Using Google Earth to Conduct a Neighborhood Audit: Reliability of a Virtual Audit Instrument.” Health & Place 16 (6): 1224–1229. doi:https://doi.org/10.1016/j.healthplace.2010.08.007.
- De Vries, S., S. M. Van Dillen, P. P. Groenewegen, and P. Spreeuwenberg. 2013. “Streetscape Greenery and Health: Stress, Social Cohesion and Physical Activity as Mediators.” Social Science & Medicine 94: 26–33. doi:https://doi.org/10.1016/j.socscimed.2013.06.030.
- Dissanayake, D., T. Morimoto, Y. Murayama, and M. Ranagalage. 2019. “Impact of Landscape Structure on the Variation of Land Surface Temperature in Sub-Saharan Region: A Case Study of Addis Ababa Using Landsat Data (1986–2016).” Sustainability 11 (8): 2257. doi:https://doi.org/10.3390/su11082257.
- Dissanayake, D., T. Morimoto, Y. Murayama, M. Ranagalage, and H. H. Handayani. 2018. “Impact of Urban Surface Characteristics and Socio-Economic Variables on the Spatial Variation of Land Surface Temperature in Lagos City, Nigeria.” Sustainability 11 (1): 25. doi:https://doi.org/10.3390/su11010025.
- Dong, R., Y. Zhang, and J. Zhao. 2018. “How Green are the Streets within the Sixth Ring Road of Beijing? An Analysis Based on Tencent Street View Pictures and the Green View Index.” International Journal of Environmental Research and Public Health 15 (7): 1367. doi:https://doi.org/10.3390/ijerph15071367.
- Ellaway, A., S. Macintyre, and X. Bonnefoy. 2005. “Graffiti, Greenery, and Obesity in Adults: Secondary Analysis of European Cross Sectional Survey.” BMJ 331 (7517): 611–612. doi:https://doi.org/10.1136/bmj.38575.664549.F7.
- Folke, C., C. S. Holling, and C. Perrings. 1996. “Biological Diversity, Ecosystems, and the Human Scale.” Ecological Applications 6 (4): 1018–1024. doi:https://doi.org/10.2307/2269584.
- Fu, X., T. Jia, X. Zhang, S. Li, Y. Zhang, and S. Fu. 2019. “Do Street-Level Scene Perceptions Affect Housing Prices in Chinese Megacities? An Analysis Using Open Access Datasets and Deep Learning.” PLoS One 14 (5): e0217505. doi:https://doi.org/10.1371/journal.pone.0217505.
- Gandy, R., and M. J. Meitner. 2007. “The Effects of an Advanced Traveler Information System on Scenic Beauty Ratings and the Enjoyment of a Recreational Drive.” Landscape and Urban Planning 82 (1–2): 85–93. doi:https://doi.org/10.1016/j.landurbplan.2007.01.018.
- Gao, L., X. Wang, B. A. Johnson, Q. Tian, Y. Wang, J. Verrelst, X. Mu, and X. Gu. 2020. “Remote Sensing Algorithms for Estimation of Fractional Vegetation Cover Using Pure Vegetation Index Values: A Review.” ISPRS Journal of Photogrammetry and Remote Sensing 159: 364–377. doi:https://doi.org/10.1016/j.isprsjprs.2019.11.018.
- Griew, P., M. Hillsdon, C. Foster, E. Coombes, A. Jones, and P. Wilkinson. 2013. “Developing and Testing a Street Audit Tool Using Google Street View to Measure Environmental Supportiveness for Physical Activity.” International Journal of Behavioral Nutrition and Physical Activity 10 (1): 103. doi:https://doi.org/10.1186/1479-5868-10-103.
- Guha, S., H. Govil, A. Dey, and N. Gill. 2020a. “A Case Study on the Relationship between Land Surface Temperature and Land Surface Indices in Raipur City, India.” Geografisk Tidsskrift-Danish Journal of Geography 120 (1): 35–50. doi:https://doi.org/10.1080/00167223.2020.1752272.
- Guha, S., H. Govil, N. Gill, and A. Dey. 2020b. “Analytical Study on the Relationship between Land Surface Temperature and Land Use/Land Cover Indices.” Annals of GIS 26 (2): 201–216. doi:https://doi.org/10.1080/19475683.2020.1754291.
- Janse, G., and C. C. Konijnendijk. 2007. “Communication between Science, Policy and Citizens in Public Participation in Urban Forestry—Experiences from the Neighbourwoods Project.” Urban Forestry & Urban Greening 6 (1): 23–40. doi:https://doi.org/10.1016/j.ufug.2006.09.005.
- Jim, C. Y., and W. Y. Chen. 2006. “Recreation–Amenity Use and Contingent Valuation of Urban Greenspaces in Guangzhou, China.” Landscape and Urban Planning 75 (1–2): 81–96. doi:https://doi.org/10.1016/j.landurbplan.2004.08.008.
- Jonckheere, I., S. Fleck, K. Nackaerts, B. Muys, P. Coppin, M. Weiss, and F. Baret. 2004. “Review of Methods for in Situ Leaf Area Index Determination.” Agricultural and Forest Meteorology 121 (1–2): 19–35. doi:https://doi.org/10.1016/j.agrformet.2003.08.027.
- Kabisch, N., M. Strohbach, D. Haase, and J. Kronenberg. 2016. “Urban Green Space Availability in European Cities.” Ecological Indicators 70: 586–596. doi:https://doi.org/10.1016/j.ecolind.2016.02.029.
- Lang, W., E. C. M. Hui, T. Chen, and X. Li. 2020. “Understanding Livable Dense Urban Form for Social Activities in Transit-Oriented Development through Human-Scale Measurements.” Habitat International 104: 102238. doi:https://doi.org/10.1016/j.habitatint.2020.102238.
- Lange, E., S. Hehl-Lange, and M. J. Brewer. 2008. “Scenario-Visualization for the Assessment of Perceived Green Space Qualities at the Urban-Rural Fringe.” Journal of Environmental Management 89 (3): 245–256. doi:https://doi.org/10.1016/j.jenvman.2007.01.061.
- Li, X., and C. Ratti. 2018. “Mapping the Spatial Distribution of Shade Provision of Street Trees in Boston Using Google Street View Panoramas.” Urban Forestry & Urban Greening 31: 109–119. doi:https://doi.org/10.1016/j.ufug.2018.02.013.
- Li, X., C. Ratti, and I. Seiferling. 2018. “Quantifying the Shade Provision of Street Trees in Urban Landscape: A Case Study in Boston, USA, Using Google Street View.” Landscape and Urban Planning 169: 81–91. doi:https://doi.org/10.1016/j.landurbplan.2017.08.011.
- Li, X., C. Zhang, W. Li, and Y. A. Kuzovkina. 2016. “Environmental Inequities in Terms of Different Types of Urban Greenery in Hartford, Connecticut.” Urban Forestry & Urban Greening 18: 163–172. doi:https://doi.org/10.1016/j.ufug.2016.06.002.
- Li, X., C. Zhang, W. Li, Y. A. Kuzovkina, and D. Weiner. 2015a. “Who Lives in Greener Neighborhoods? The Distribution of Street Greenery and Its Association with Residents’ Socioeconomic Conditions in Hartford, Connecticut, USA.” Urban Forestry & Urban Greening 14 (4): 751–759. doi:https://doi.org/10.1016/j.ufug.2015.07.006.
- Li, X., C. Zhang, W. Li, R. Ricard, Q. Meng, and W. Zhang. 2015b. “Assessing Street-Level Urban Greenery Using Google Street View and a Modified Green View Index.” Urban Forestry & Urban Greening 14 (3): 675–685. doi:https://doi.org/10.1016/j.ufug.2015.06.006.
- Li, X., W. Zhou, and Z. Ouyang. 2013. “Relationship between Land Surface Temperature and Spatial Pattern of Greenspace: What are the Effects of Spatial Resolution?” Landscape and Urban Planning 114: 1–8. doi:https://doi.org/10.1016/j.landurbplan.2013.02.005.
- Liu, X., Y. Song, K. Wu, J. Wang, D. Li, and Y. Long. 2015. “Understanding Urban China with Open Data.” Cities 47: 53–61. doi:https://doi.org/10.1016/j.cities.2015.03.006.
- Long, Y., L. Liu, and X. Ma. 2017. “How Green are the Streets? An Analysis for Central Areas of Chinese Cities Using Tencent Street View.” PLoS One 12 (2): e0171110. doi:https://doi.org/10.1371/journal.pone.0171110.
- Mak, M. Y., and S. T. Ng. 2005. “The Art and Science of Feng Shui—A Study on Architects’ Perception.” Building and Environment 40 (3): 427–434. doi:https://doi.org/10.1016/j.buildenv.2004.07.016.
- Mbuh, M. J., R. Wheeler, and A. Cook. 2019. “Spatiotemporal Analysis of Urban Heat Island Intensification in the City of Minneapolis-St. Paul and Chicago Metropolitan Areas Using Landsat Data from 1984 to 2016.” Geocarto International 1–26. doi:https://doi.org/10.1080/10106049.2019.1655802.
- Meitner, M. J. 2004. “Scenic Beauty of River Views in the Grand Canyon: Relating Perceptual Judgments to Locations.” Landscape and Urban Planning 68 (1): 3–13. doi:https://doi.org/10.1016/s0169-2046(03)00115-4.
- Mu, X., W. Song, Z. Gao, T. R. McVicar, R. J. Donohue, and G. Yan. 2018. “Fractional Vegetation Cover Estimation by Using Multi-Angle Vegetation Index.” Remote Sensing of Environment 216: 44–56. doi:https://doi.org/10.1016/j.rse.2018.06.022.
- Mushore, T. D., O. Mutanga, J. Odindi, and T. Dube. 2016. “Assessing the Potential of Integrated Landsat 8 Thermal Bands, with the Traditional Reflective Bands and Derived Vegetation Indices in Classifying Urban Landscapes.” Geocarto International 32 (8): 886–899. doi:https://doi.org/10.1080/10106049.2016.1188168.
- Olsen, H., E. Kennedy, and J. Vanos. 2019. “Shade Provision in Public Playgrounds for Thermal Safety and Sun Protection: A Case Study across 100 Play Spaces in the United States.” Landscape and Urban Planning 189: 200–211. doi:https://doi.org/10.1016/j.landurbplan.2019.04.003.
- Osgouei, P. E., and S. Kaya. 2017. “Analysis of Land Cover/Use Changes Using Landsat 5 TM Data and Indices.” Environmental Monitoring and Assessment 189 (4): 136. doi:https://doi.org/10.1007/s10661-017-5818-5.
- Osgouei, P. E., S. Kaya, E. Sertel, and U. Alganci. 2019. “Separating Built-Up Areas from Bare Land in Mediterranean Cities Using Sentinel-2A Imagery.” Remote Sensing 11 (3): 345. doi:https://doi.org/10.3390/rs11030345.
- Qu, S., L. Wang, A. Lin, D. Yu, M. Yuan, and C. A. Li. 2020. “Distinguishing the Impacts of Climate Change and Anthropogenic Factors on Vegetation Dynamics in the Yangtze River Basin, China.” Ecological Indicators 108: 105724. doi:https://doi.org/10.1016/j.ecolind.2019.105724.
- Qu, S., L. Wang, A. Lin, H. Zhu, and M. Yuan. 2018. “What Drives the Vegetation Restoration in Yangtze River Basin, China: Climate Change or Anthropogenic Factors?” Ecological Indicators 90: 438–450. doi:https://doi.org/10.1016/j.ecolind.2018.03.029.
- Schule, S. A., K. M. A. Gabriel, and G. Bolte. 2017. “Relationship between Neighbourhood Socioeconomic Position and Neighbourhood Public Green Space Availability: An Environmental Inequality Analysis in a Large German City Applying Generalized Linear Models.” International Journal of Hygiene and Environmental Health 220 (4): 711–718. doi:https://doi.org/10.1016/j.ijheh.2017.02.006.
- Sikorska, D., E. Łaszkiewicz, K. Krauze, and P. Sikorski. 2020. “The Role of Informal Green Spaces in Reducing Inequalities in Urban Green Space Availability to Children and Seniors.” Environmental Science & Policy 108: 144–154. doi:https://doi.org/10.1016/j.envsci.2020.03.007.
- Sobrino, J. A., J. C. Jiménez-Muñoz, J. El-Kharraz, M. Gómez, M. Romaguera, and G. Sòria. 2004. “Single-Channel and Two-Channel Methods for Land Surface Temperature Retrieval from DAIS Data and Its Application to the Barrax Site.” International Journal of Remote Sensing 25 (1): 215–230. doi:https://doi.org/10.1080/0143116031000115210.
- Tyrväinen, L., A. Ojala, K. Korpela, T. Lanki, Y. Tsunetsugu, and T. Kagawa. 2014. “The Influence of Urban Green Environments on Stress Relief Measures: A Field Experiment.” Journal of Environmental Psychology 38: 1–9. doi:https://doi.org/10.1016/j.jenvp.2013.12.005.
- Van den Berg, A. E., T. Hartig, and H. Staats. 2007. “Preference for Nature in Urbanized Societies: Stress, Restoration, and the Pursuit of Sustainability.” Journal of Social Issues 63 (1): 79–96. doi:https://doi.org/10.1111/j.1540-4560.2007.00497.x.
- Wang, R., J. Zhao, and M. J. Meitner. 2017. “Urban Woodland Understory Characteristics in Relation to Aesthetic and Recreational Preference.” Urban Forestry & Urban Greening 24: 55–61. doi:https://doi.org/10.1016/j.ufug.2017.03.019.
- Wang, R., J. Zhao, M. J. Meitner, Y. Hu, and X. Xu. 2019. “Characteristics of Urban Green Spaces in Relation to Aesthetic Preference and Stress Recovery.” Urban Forestry & Urban Greening 41: 6–13. doi:https://doi.org/10.1016/j.ufug.2019.03.005.
- Wang, Y., S. Solberg, P. Yu, T. Myking, R. D. Vogt, and S. Du. 2007. “Assessments of Tree Crown Condition of Two Masson Pine Forests in the Acid Rain Region in South China.” Forest Ecology and Management 242 (2–3): 530–540. doi:https://doi.org/10.1016/j.foreco.2007.01.065.
- Weng, Q., D. Lu, and J. Schubring. 2004. “Estimation of Land Surface Temperature–Vegetation Abundance Relationship for Urban Heat Island Studies.” Remote Sensing of Environment 89 (4): 467–483. doi:https://doi.org/10.1016/j.rse.2003.11.005.
- Xiao, R. B., Z. Y. Ouyang, H. Zheng, W. F. Li, E. W. Schienke, and X. K. Wang. 2007. “Spatial Pattern of Impervious Surfaces and Their Impacts on Land Surface Temperature in Beijing, China.” Journal of Environmental Sciences 19 (2): 250–256. doi:https://doi.org/10.1016/s1001-0742(07)60041-2.
- Xu, C., D. Haase, and S. Pauleit. 2018. “The Impact of Different Urban Dynamics on Green Space Availability: A Multiple Scenario Modeling Approach for the Region of Munich, Germany.” Ecological Indicators 93: 1–12. doi:https://doi.org/10.1016/j.ecolind.2018.04.058.
- Yang, J., L. Zhao, J. McBride, and P. Gong. 2009. “Can You See Green? Assessing the Visibility of Urban Forests in Cities.” Landscape and Urban Planning 91 (2): 97–104. doi:https://doi.org/10.1016/j.landurbplan.2008.12.004.
- Zhang, F., B. Zhou, L. Liu, Y. Liu, H. H. Fung, H. Lin, and C. Ratti. 2018. “Measuring Human Perceptions of a Large-Scale Urban Region Using Machine Learning.” Landscape and Urban Planning 180: 148–160. doi:https://doi.org/10.1016/j.landurbplan.2018.08.020.
- Zhang, Y., and R. Dong. 2018. “Impacts of Street-Visible Greenery on Housing Prices: Evidence from a Hedonic Price Model and a Massive Street View Image Dataset in Beijing.” ISPRS International Journal of Geo-Information 7 (3): 104. doi:https://doi.org/10.3390/ijgi7030104.