
ABSTRACT
The aims of this study were to provide a complete inventory of wetlands in Turkey including their past status (1910–1930) in comparison to the present time (2014). The types of wetlands and their area sizes were determined by using cartographical maps of 1/200,000 in scale made between 1910s and 1920s vs. 2006 CORINE Land Cover data, which were updated with Landsat 8 satellite images in 2014. The effect of possible climate change on wetlands sizes various local, national and regional rainfall datasets were analysed by correlation and regression analysis. A hundred years ago, the total number of natural wetlands was 1299 with a total surface area of 1,376,505 hectares. In 2014, the total number of natural wetlands had decreased to 900, with a total surface area of 1,085,936 hectares, so that 21.2% of the original wetlands were lost (291,339 hectares). The observed changes in the number of wetlands and their relative sizes cannot be attributed directly to changes in climate. Wetland drainage was largely responsible for observed wetland losses, but local changes in precipitation regimes partially contributed to this loss. Urgent conservation and restoration of wetlands are recommended to avoid further loss of wetlands in Turkey.
Introduction
Wetlands are complex ecosystems and centers of biological diversity, which serve as critically important resources and ecological functions (Denny Citation1994; Erwin Citation2008). However, most wetlands are susceptible to direct and indirect interventions, which cause degradation or habitat loss (Millennium Ecosystem Assessment Citation2005; Davidson Citation2014; Davidson and Finlayson Citation2018). The most common direct intervention includes hydrological alterations in rivers (Georges and Cottingham Citation2002; Kingsford and Auld Citation2005; Ramsar Citation2005), water withdrawal (Gosselink and Maltby Citation1990; Maltby and Barker Citation2009), habitat alterations, eutrophication, pollution (Millennium Ecosystem Assessment Citation2005; Gül, Onmuş, and Sıkı Citation2013; Onmuş and Sıkı Citation2013) and climate change (IPCC Citation2018). Indirect interventions include human population growth and increasing economic development (Ramsar Citation2018; IPCC Citation2018).
Wetland drainage operations continued until the 1970s often with government support in the United States (Gosselink and Maltby Citation1990). Similarly, large-scale wetland drainage activities occurred in Turkey starting in the 1920s with the intention of combating malaria. The swamp and marsh areas in Turkey were systematically drained starting in 1926 for the purpose of malaria control and carried out only by government employees (Tuğluoğlu Citation2008). Later on, the scope and intensity of wetland drainage activities were expanded with another Malaria Combat Law issued in 1946. Men aged between 18 and 50 years living in the immediate vicinity of swamp or marsh areas were forced to work on wetland drainage activities for 5 days a year (Resmi Gazete Citation1946). A third law was enacted in 1950 and declared that dried state lands would be transferred to the property of the wetland drainage workers, and that declaration stimulated more wetland drainage activity (Resmi Gazete Citation1950). Apart from these laws, the need for more agricultural land to feed the rapidly growing population led to the drainage of a significant number of many seasonal and permanent lakes, and marsh and reed wetlands to transform them into agricultural fields.
Initially, wetland losses had provided some benefits for a period of time globally. However, during the 1960s and 1970s, many individuals and local communities began to observe deterioration in their personal health and well-being, along with the loss and degradation of former wetlands and their ecosystem services (Mitsch and Gosselink Citation2015). It was then slowly understood that wetlands are ecosystems with important societal functions, and worldwide protection studies were initiated. The Ramsar Convention became the main legal basis for the protection of wetlands all over the world during 1970s. Turkey signed the agreement in 1994 and began working on the protection of the designated Ramsar areas. Similar to other countries participating to the Ramsar Convention, direct wetland drainage operations in Turkey have been discontinued; nonetheless, the amount of water reaching wetlands has steadily decreased during this period because of increased river damming, groundwater withdrawal and irrigation demand for crops leading to wetland deterioration and loss (Yarar and Magnin Citation1997; Kılıç and Eken Citation2004). Such problems triggered “wise use” and wetland conservation efforts and initiated the formation of many national wetland inventory programs based on reliable management-oriented information. The basic information includes the location, the extent of each wetland and their major habitats and ecological features (Finlayson et al. Citation1999). Though many countries largely achieved this goal, the existing national wetland inventories in Turkey are still incomplete and in some cases erroneous. The existing information is largely biased toward stream flows for hydroelectric power plants, agricultural irrigation or drinking water use while remaining scarce for the wetland habitats. Therefore, the purpose of this project was to conduct a systematic inventory for the wetlands of Turkey.
Combining the Ramsar (Citation2010) inventory structure and wetland conservation approach, the aims of this study are therefore to (1) provide a complete wetland inventory for Turkey, (2) elaborate wetland and major habitat classifications, (3) evaluate wetland changes observed between 1910 and–1920s vs. the present time (2014), (4) provide recommendations for conservation and management activities.
Materials and methods
Study area
This wetland loss study was conducted in Turkey, which is a transcontinental country stretching between Europe and Asia with a total surface area of 780,000 km2. The country lies in a temperate climate zone with an average precipitation of 643 mm, ranging from 250 to 2500 mm (DSİ (Devlet Su İşleri) Citation2015). Similar to differences in climate, Turkey has large differences in altitude, ranging from sea level to 5137 m, with mountain ranges stretching along the Black Sea and the Mediterranean Sea coasts. The highest amounts of precipitation are seen along these mountain ranges. In the country, elevations generally increase from west to east. Differences in geography and climate have led to a very large number wetlands and aquatic diversity in Turkey (Kılıç and Eken Citation2004; Eken et al. Citation2006).
Historical maps
A total of 123 different topographical maps of 1:200,000 scale prepared between 1911 and 1929 were used to determine and delineate the boundaries of the existing wetlands in Turkey during the early 20th century. These series of maps are the first in Turkey produced with modern techniques (using triangulation points) (Türkezer and Çobanoğlu Citation2012). The maps were obtained from the offices of General Directorate of Mapping, formerly General Command of Mapping, after formal permissions. These maps were rectified by using ArcMap 10.4 software. Some inconsistencies and measurement errors were discovered during the examination of these maps. Among the problems were that even though karstic troughs and lakes are known to be relatively widespread in central and East Anatolia, we discovered that a few and small temporary lakes located in the karstic troughs in the higher parts of the Toros Mountains were not consistently drawn on all map sheets. Some of the indicated wetlands were not drawn to scale and were shown with very small hachures. As a result, some of the higher elevation lakes in the Toros Mountains were not included because these small temporary lakes could have created bias. Also, we discovered measuement errors in the basin of Van Lake (the biggest lake in Turkey, located in the east). When we looked at the timing of the mapping procedure, we discovered that the mapping studies first started in the eastern part of Turkey and continued westward. Possible lack of experience at the beginning of the mapping studies during these years may be the reason why there are measurement errors in the east (Türkezer and Çobanoğlu Citation2012). The measurement errors in Lake Van region were mostly located in mountainous areas. In particular, there were very visible slips in the lake boundaries in the maps showing Van Lake and the surrounding lakes. Although the area covered by the islands on Van Lake is consistent with today’s conditions, the boundaries of Van Lake were drawn to be about 5% larger than today. Therefore, the boundaries of Van Lake and Nazik Lake, at the northwest of Van Lake, were obtained from Landsat 8 satellite images in 2014.
All wetlands (lakes, seasonal lakes, marshes, reeds, wet meadows, salinas) shown on the maps were converted into polygon vector data by manual digitization method and then converted into Lambert Conformal Conic projections using appropriate parameters (central meridian: 36°E, standard parallels: 37.5° N and 40.5° N). Finally, their surface areas were calculated. The minimum mappable unit (MMU) ranged from 0.5 to 1.0 ha.
Current maps and habitat classification
For the current wetland data, the Coordination of Information on the Environment (CORINE) Land Cover data prepared for the European Union member and candidate countries in 2006 were used. The CORINE methodology does not use general image classification methods of remote sensing software but instead false color images are obtained from satellite images and then computer-aided photointerpretation is applied. Finally, the CORINE classifications were constructed using manual digitalization in vector mode (EEA Citation2000).
The CORINE data consist of a minimum of 25 ha of land and produced with a scale of 1:100,000. The CORINE dataset is produced throughout the European countries, without paying attention to national boundaries. There are transboundary wetlands that lie between Turkey and its surrounding countries such as Greece, Bulgaria, Georgia. These transboundary wetlands were divided or clipped into pieces by using officially approved national border lines. This process led to the acquisition of wetlands whose surface areas were smaller than 25 ha in size, which is different than the CORINE methodology. The standard CORINE Land Cover data consist of 44 different land cover classes. These classes are divided into five groups: Group 1, artificial surfaces; Group 2, agricultural areas; Group 3, forests and semi-natural areas; Group 4, wetlands; and Group 5, water bodies. In this study, the fourth and fifth group land cover classes were used. These, with their CORINE code numbers, are Inland marshes (411), Salt marshes (421), Salinas (422), waterbodies (512), Coastal lagoons (521), and Estuaries (522). There are no defined areas in Turkey in the categories of Peat bogs (412) and Intertidal flats (423). Water courses (511) and sea and ocean (523) categories were not included in the calculations. In the CORINE data, dammed lakes are given the water mass code (512) as are natural lakes. In order to calculate the area of the dammed lakes separately, it was necessary to define a new code number for dammed lakes in the CORINE data. Wet meadows are not included in the CORINE classification with a separate code number because pasture areas with the code number 231 also include wet meadows. Therefore, the pastures overlapping with wet meadows in the 1:200,000 maps of the CORINE data were classified as wet meadows.
The wetland classification in the historical maps and the CORINE data were not exactly the same. Both data sources had lake, lagoon and salina classifications; however, seasonal lakes, marshes, reeds, sedge classes shown on the historical maps are classified as inland marshes in the CORINE classification. Salt marsh is another type of habitat classification provided by the CORINE dataset; however, old topographical maps do not include this habitat classification. Salt marsh as indicated by the CORINE habitat classification are therefore compared with the geographically corresponding wetlands obtained from the old topographical maps.
The existing code numbers for wetlands in the 2006 CORINE data classified were each considered at the watershed/basin scale with the 2014 Landsat 8 images and validated. If a structural change existed in a specific area between the 2006 data and the 2014 Landsat images, the field classification was updated with the same CORINE methodology. Wetland boundaries given in the CORINE 2006 data were also controlled by using Landsat 8 satellite images for 2014. The wetlands in the 2006 data that were observed to be dried and developed into residential or industrial areas in 2014 were updated as wetland loss, and the flooded areas upstream from dams completed in the same period were added as wetland gain. Acquisition dates for 2014 Landsat images used in this study are between April and October. Satellite images obtained during the winter period were not used because these would have created bias because the historical maps also used summer and autumn field studies. The MMU was in the range of 1 to 1.5 ha. Lambert Conformal Conic projection was used for area calculations. All data were grouped according to Turkey’s 26 major river basin boundaries to determine changes in wetlands per river basin.
Meteorological data and North Atlantic Oscillation index
We have obtained the mean annual amount of rainfall of Turkey between 1941 and 2014 and the North Atlantic Oscillation (NAO) index between 1900 and 2014. Meteorological stations were established in Turkey mostly during 1940s; therefore, we did not have direct data to acquire information about the precipitation conditions in the early 20th century. However, the NAO index values may provide important information for periods when precipitaton was not measured in Turkey.
Statistical analysis
The existing surface areas of wetlands in both study periods (1911–1929 and 2014) and the observed changes in surface areas were calculated and presented. The areal extent of many wetlands in general correlate with the amount of rainfall in a specific year or period (Gereta et al. Citation2004). The mean annual rainfall of Turkey (1941–2014), the mean annual rainfall of the seven different climate zones of Turkey (Unal et al Citation2003), and the mean annual rainfall of the 26 large river basins of Turkey were seperately compared with the NAO index by using correlation analysis. The results were used to estimate the spatial size of wetlands in Turkey during the period 1911–1929, when these cartographic maps were prepared. A linear regression was run to predict the trend of the mean annual rainfall in Turkey between 1900 and 2014. Seperate linear regressions were run to predict the trend of the mean annual rainfall in Turkey between 1900 and 2014. There were homoscedasticity and normality of the residuals. No outliers were identifed. Durbin–Watson independence of residuals were checked. There were independence of residuals, as assessed by a Durbin–Watson statistic of a range between 1.689 and 2.089. Ninety-five percent confidence limits and prediction limits are provided. Similar linear regressions were run to understand the trend of the mean annual rainfall in the seven different climate zones and 26 different river basins during the period between 1941 and 2006. Predicted changes, lower bound (LB) and upper bound of 95% confidence limits in rainfall regimes are provided.
Results and discussion
Wetland losses
In the 1910s–1920s vs. 2014, the total number of wetlands was 1299 vs. 1651, respectively, with surface areas of 1,376,505 and 1,499,697 ha, respectively (; ). According to this initial assessment, the number of wetlands and their surface area have increased over time in Turkey. However, the estimated increase may be due to the inclusion of dammed floodplains as wetlands, noting that these were not built until after these initial assessments in 1910–1920.
Table 1. The change in aerial extent of wetlands in 1911–1929 vs. 2014, in Turkey
Figure 1. Distributions and changes of natural and artificial (dams/reservoirs) wetlands in Turkey in 1911–1929 vs. 2014
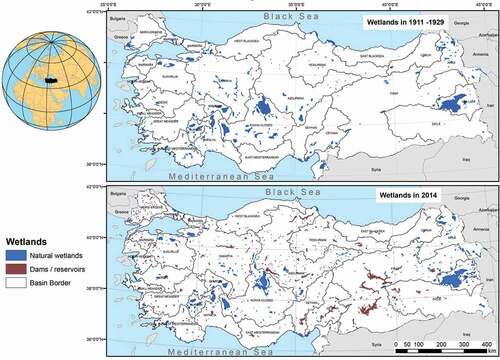
As of 2014, the total surface area of dams and reservoirs in Turkey was 414,761 ha (), with the first dam built near Ankara in 1930 and other large dams built around 1956 (Yiğitbaşıoğlu Citation1996). Today, the largest dams occupy the Euphrates Basin (185,106 ha), and followed by the Kızılırmak Basin (62,664 ha). The total surface area covered by dams in these two basins is more than half of the total area covered by dams in Turkey. If dams and reservoirs are considered as wetlands, it can be concluded that there is an increase in wetlands of 27.1% (corresponding to 352 different wetlands) numerically and of 8.9% (123,192.7 ha) in surface area. Dams and reservoirs are often considered as artificial wetlands and their impact on natural wetlands is negative rather than positive, and in many cases, cause irreversible losses in wetland ecosystems and wetland-dependent species (Ramsar Citation2002). Dams modify the environments in which local ecosystems have adapted so that the overall effect of a dam is almost always reduces species diversity (McCully Citation1996). Therefore, these artificial wetlands are recommended to be evaluated separately from natural wetlands. After removing dammed floodplains from the estimates, the total number of natural wetland sites has decreased in number by 30.7% (399) which corresponds to a 21.2% (291,568.4 ha) decrease in surface area in total (). Among those wetland losses, the largest loss is observed in waterbodies (natural lakes). A total of 555 different natural lakes, with a surface area of 179,167 ha, were lost during the study period. The second largest type of wetland habitat loss was for inland marshes, with a total surface area of 105,921.5 ha. In addition to this loss, some of the former large fresh and salty marshes are today so fragmented due to urban or agricultural development that these can no longer be considered to be part of the same wetlands. This situation gives a false impression that the number of wetland habitats has increased. Although, these fragments are accepted no longer as a part of the larger system as they were in the past, most likely the fragments might have some interbasin connection by streams or during floods. Therefore, we believe that our study will most probably serve as basis information for possible future restoration and rehabilitation plannings.
Table 2. Total surface areas of dams per river basins in Turkey in 2014
The total surface area of dams and reservoirs operated in Turkey is more than the area of the wetlands lost during the 20th century. Wetland loss is associated with changes in local climatic conditions in conjunction with hydrologic changes. In the areas where wetlands are lost, the land has dried, while the land is flooded behind dams. In both cases, these changes are related to hydrologic and vegetation changes in those areas (Brock, Smith, and Jarman Citation1999).
Detailed results for each of the 26 major river basins in Turkey of all wetland changes identified between the research periods are given in , and Appendix 1 gives information for 1910–1920 vs. 2014. Wetland losses were identified in 20 out of 26 major river basins in Turkey. The Konya Closed-River Basin in central Turkey had 387,839.2 ha in surface area of wetlands 100 years ago. However, it has lost 52% of its former wetland habitats (140,000 ha). This is the largest amount of observed loss of wetland in a river basin. Today, Van Lake Closed-Basin in eastern Turkey has the highest total wetland surface area. In terms of wetland loss as surface area lost, Sakarya (located at the west of central north) and Asi (located in Hatay/Antioch, north west of Syria) basins are ranked in the second and the third places, with a loss of more than 30,000 ha each. Asi Basin has the highest wetland loss rate with a proportional loss of 95.5%. According to the water bird census conducted in Lake Amik (even more than 35 year after drainage), this lake was still harboring more than 170 thousand waterfowl in the winter of 1967–1968 (Ornithological Society of Turkey Citation1968). Therefore, Amik Lake, among the other wetlands located in the Western Palearctic region, was probably one of the most important wetland used by migratory birds during wintering and/or stopover purposes during migration, before it was drained (Onmuş et al. Citation2011). Other basins, such as Ergene (located at the northwest), Akarcay (located at the central west), and Yeşilırmak (located at the central north) basins have lost over 15,000 ha of wetland. The losses in the Western Mediterranean, Ceyhan, and Antalya basins are in the range of 10,000–15,000 ha. The basin with the least wetland area lost is the Eastern Black Sea Basin with 75 ha. Although it is the most rain-fed basin in Turkey, the basin is not suitable for formation of wetlands due to its topographic features, except for narrow but deep embankment of rivers, and glacial lakes over high mountains. Since the lakes in this basin have surface areas smaller than 25 ha, they are neither found in the CORINE data nor in the Landsat images. So, we concluded that these wetlands were drawn larger than their actual sizes on the maps to make them visible. Thus, this loss estimate is not reliable.
Table 3. The change in aerial extent of natural wetlands in the 26 major river basins in Turkey in 1911–1929 vs. 2014)
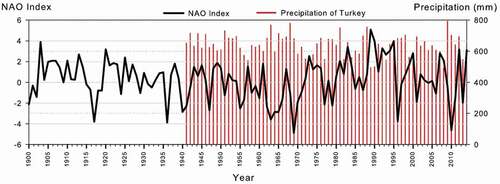
The NAO index (from 1900 to 2014) and the mean amount of annual rainfall (from 1941 to 2014) observed in Turkey are given in . There was a negative medium/moderate correlation between the NAO index and the mean annual amount of precipitation in Turkey (r = −0.364, p < 0.001, n = 74). In other words, the periods in which the index values were positive correspond to the years when Turkey was relatively more arid, and the periods in which the index values were negative correspond to the years when Turkey had relatively more precipitation (). This finding is also supported by Turkes and Erlat (2003). However, the NAO index statistically explained 14% (r2, the coefficient of determination) of the variability in the mean amount of annual variability. In line with our findings, Sousa et al. (Citation2011) indicated that the inter-annual variability of Turkey during the period between 1911 and 1929, and between 2006 and 2014 have both dry and wet periods. Turkey as a whole has very heterogeneous drought regimes with no evidence of a clear trend for dryness throughout the 20th century (Turkeş Citation1998, Turkeş, Koc, and Saris Citation2009; Sousa et al. Citation2011). However, the mean precipitation data of such a big and heterogeneous land mass in Turkey between two different seas and high mountain ranges may not be the appropriate dataset to infer relationships precipitation changes and their potential consequences for wetlands. It is possible that reductions and/or increase in precipitation might have occurred in some regions.
Figure 2. Mean annual amount of precipitation in Turkey between 1941 and 2014 (Source: Turkish State Meteorological Service) and the Hurrel North Atlantic Oscillation (NAO) index (DJF) between 1900 and 2014 (Source: Hurrel. 1995 ve Climate Analysis Section. NCAR. Boulder. USA). The NAO index is negatively correlated with the mean annual amount of precipitation in Turkey (r = −0.364, p < 0.001)
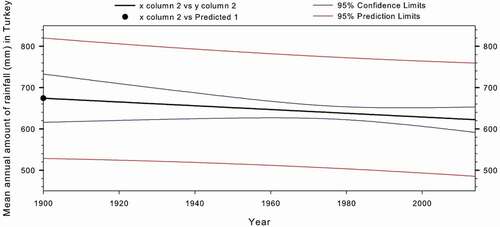
In contrast to the negative correlation found between the NAO index and the mean annual amount of rainfall in Turkey, individual comparisons made between the NAO index with the mean annual amount of rainfalls in seven climatic regions and with the 26 different river basins revealed a slightly different picture. No statistically significant correlation was found between the NAO index and any of the seven different climate regions. Therefore, the NAO index cannot be used to predict the precipitation regime observed in the climate zones during the cartographic mapping period. However, the NAO index was found to be correlated with the 11 out 26 major river basins: ten were negatively and one was positively correlated. These are Asi Basin (r = 0.248, p = 0.044), Burdur Basin (r = −0.389, p = 0.001), Ergene Basin (r = −0.325, p = 0.008), Great Meander Basin (r = −0.355, p = 0.003), North Aegean Basin (r = −0.384, p = 0.001), Sakarya Basin (r = −0.296, p = 0.016), Susurluk Basin (r = −0.418, p < 0.001), West Mediterranean (r = −0.315, p = 0.010), Gediz Basin (r = −0. 298, p = 0.015), Akarçay Basin (rs = −0.287, p = 0.019), and Marmara Basin (rs = −0.285, p = 0.020). Regression analysis predicted an overall decrease of 0.5 mm/year in rainfall in Turkey but this decrease was not statistically significant () Although the regression line and confidence limits revealed a decreasing relationship, the lack of statistically significant result may be due to the large fluctuations observed in precipitation regimes in Turkey (Sousa et al. Citation2011). No significant change was detected in the mean annual amount of rainfall among the seven climate regions. On the other hand, basin-based Regression Analyses predicted significant trends in the average annual amount of precipitation in seven different major river basins out of 26, over the period 1941–2006: three were decreasing and four were increasing trends. The rest of the basins revealed no significant trends (). It can be concluded, therefore, that the observed countrywide changes in the number of wetlands and their relative sizes can not directly be attributed to differences in climate between the two study periods. It seems therefore that negative effects of precipitation regimes on wetland losses are only observable at smaller and/or regional scales. On the other hand, precipitation is not the only water source for some of the regions in Turkey. Many of these regions receive also snowfall during winter. To be able to claim that climate change has no significant impact on wetland losses in Turkey, the effect of snowfall regimes and/or temperature changes are needed to be investigated, by using larger data sets.
Table 4. The predicted trend observed in the mean annual amount of rainfall in the 26 major river basins and overall trend observed in Turkey during the period between 1941 and 2014
Figure 3. Predicted trend (r2 = 0.037) of the mean annual amount of rainfall in Turkey during the period between 1900 and 2014
Identified sources of wetland loss
Upon examining the satellite images of areas where wetlands have been completely lost, we identified numerous numbers of drainage channels, which indicate that these wetlands have been drained either to combat malaria and/or to gain agricultural land. The largest lake that was dried by this method was Lake Amik. More than 28,000 ha of natural wetland were dried including open water lake and swamp area at Lake Amik.
Partal and Kahya (Citation2006) analyzed Turkey’s long-term regional annual and monthly mean total rainfall and found a change especially in January, February and September. Furthermore, a noticeable decrease in the annual mean precipitation was detected in some of the regions. These regions are located in western and southern Turkey, as well as along the coasts of the Black Sea. Therefore, a locally decreasing trend in precipitation might have also contributed to the loss of some of the coastal wetlands in those regions. However, Partal and Kahya (Citation2006) found no significant trends in areas where closed river basins exist (mainly in Central Anatolia, and partially in East Anatolia). Therefore, a different process was observed in the closed river basins. The increasing water demand with changing agricultural crops or increased production in agriculture has been met with dams to utilize surface water as well as intense underground water withdrawals in many regions. These interventions have led to the regression and/or salinification of many wetlands in Konya, Akarçay, and Burdur basins without direct intervention and destruction (Yarar and Magnin 1987; Kılıç and Eken Citation2004).
Limitations of the study
Due to the scale used in this study, it is possible that some small wetlands did not appear on 1:200,000 scale maps. Also, some wetlands may have not have been mapped because of differences in seasonal apparentness of seasonal wetlands. During the examination of cartographical maps, we discovered that these maps omitted coastal flood/mud plains and/or estuaries at the outlet of river deltas, especially in western Anatolia. Nevertheless, these maps are the only source of information that can be used to get information about the wetland existence of the period 100 years ago, a period before dam construction and wetland drainage. Actually, the purpose of these early maps was primarily to guide the Turkish army during war periods (Türkezer and Çobanoğlu Citation2012), so that great care was given to the mapping of wetlands to prevent hindered army shipments. The second reason we chose those cartographical maps is that most of the wetlands in Turkey had already disappeared long before the first satellite images were obtained during 1960s; therefore, the usage of these satellite images would bias the results.
Another missing point of this study is the exclusion of seasonal wetland habitats. Onmuş, Ağaoğlu, and Gül (Citation2012) indicate that the main wetland ecosystems that disappeared in the Susurluk Basin area were floodplains with lengthy inundation periods during the spring. According to this study, flooded areas once covered 16.8% of all the surface areas of one district; however, flood control measures were applied to transform this land for agriculture. We contacted the National Water Works Agency (DSI) and learned that most of the floodplain control activities have been implemented in the past along with other drainage works. We also learned that information on these flood control studies can be obtained from the old archives of DSI’s provincial local offices.
Yarar and Magnin (Citation1997), in the supplementary part of the book Turkey’s Important Bird Areas, state that 1,300,000 ha of wetland habitat were lost in Turkey during the 20th century. However, the given value is not based on actual measurements. They used separate area losses of wetlands due to flood control, drainage, and dam constructions to produce a rough estimates of wetland loss. The total amount of surface area of wetland loss found by Yarar and Magnin is almost the total area covered by Turkey’s wetlands 100 years ago that is found in this study.
Conclusions
It was found that 291,339 (21.2%) ha of total natural wetland areas were lost from the 1920s to 2014. However, the actual loss of wetlands is likely much larger. During the 1920s, there were no dams in Turkey; however, today there are a total of 751 dams with surface area of 414,761 ha constructed in floodplains and stream valleys (tallied as artificial wetlands). Existing data indicate that wetland loss in Turkey is probably less than those in developed countries. In the USA, it was determined that 53% of the wetlands were lost in 1780–1980 (Alaska and Hawaii were excluded) (Dahl Citation1990). In large European countries (Netherlands, Germany, Spain, Greece, Italy, France and parts of Portugal) the loss of wetlands is over 50% (Jones and Hughes Citation1993; Commission of the European Communities Citation1995). The predominant cause of wetland regression in Turkey is human activity, but the observed decrease in rainfall in Turkey most probably has also contributed to this loss. Wetland drainage activities were first initiated to combat malaria, and then continued with the purpose of gaining new agricultural lands. Later, along with the operation of the dams and the consequent increase in the irrigated areas, the amount of water in the wetlands decreased accordingly, and intense wetland losses occurred, especially in closed basins in Turkey. Habitat degradation and losses of wetlands are still widespread problems in Turkey. Many wetlands in Turkey are still in danger of being destroyed due to construction of dams, drainage (Eken et al. Citation2006) and climate change (Abolafya et al. Citation2013).
Despite the limitations of the study, we have provided the most complete national wetland inventory made so far in Turkey. We provided information on the areal extent and loss of wetlands during the 20th century. It is recommended that future studies should include riparian wetlands and the outlets of river deltas.
Acknowledgments
This article was positively contributed by two anonymous reviewers and editors of the journal. We appreciate their contributions.
Disclosure statement
No potential conflict of interest was reported by the author(s).
Additional information
Funding
References
- Abolafya, M., O. Onmuş, Ş. Çh, and R. Bilgin. 2013. “Using Citizen Science Data to Model the Distributions of Common Turkish Songbirds under Different Global Climatic Change Scenarios.” PLoS ONE 8 (1–12): e68037. doi:https://doi.org/10.1371/journal.pone.0068037.
- Brock, M. A., R. G. B. Smith, and P. J. Jarman. 1999. “Drain It, Dam It: Alteration of Water Regime in Shallow Wetlands on the New England Tableland of New South Wales, Australia.” Wetlands Ecology and Management 7 (1–2): 37–13. doi:https://doi.org/10.1023/A:1008416925403.
- Commission of the European Communities. 1995. “Wise Use and Conservation of Wetlands.” Communication from the commission to the council and the European Parliament. 55.
- Dahl, T. E. 1990. Wetland Losses in the United States1780’s To1980’s. 13. Washington, D.C: U.S. Department of the Interior, Fish and Wildlife Service.
- Davidson, N. C. 2014. “How Much Wetland Has the World Lost? Long-term and Recent Trends in Global Wetland Area.” Marine and Freshwater Research 65: 934–941. doi:https://doi.org/10.1071/MF14173.
- Davidson, N. C., and C. M. Finlayson. 2018. “Extent, Regional Distribution and Changes in Area of Different Classes of Wetlands.” Marine and Freshwater Research 69: 1525–1533. doi:https://doi.org/10.1071/MF17377.
- Denny, P. 1994. “Biodiversity and Wetlands.” Wetlands Ecology and Management 3 (I): 55–61. doi:https://doi.org/10.1007/BF00177296.
- DSİ (Devlet Su İşleri). 2015. “DSI Genel Müdürlüğü 2015 Yılı Faaliyet Raporu.” [2015 Annual Activity Report -general Directorate of National Water Affairs].
- Eken, G., M. Bozdoğan, S. İsfendiyaroğlu, D. T. Kılıç, and Y. Lise, eds. 2006. Türkiye’nin Önemli Doğa Alanları [Key Biodiversity Areas of Turkey]. Ankara, Turkey: Doğa Derneği.
- Erwin, K. L. 2008. “Wetlands and Global Climate Change: The Role of Wetland Restoration in a Changing World.” Wetlands Ecology and Management 17 (1): 71–84. doi:https://doi.org/10.1007/s11273-008-9119-1.
- European Environment Agency. 2000. “CORINE Land Cover Technical Guide – Addendum 2000.” Technical report No 40. Copenhagen.
- Finlayson, C. M., N. C. Davidson, A. G. Spiers, and N. J. Stevenson. 1999. “Global Wetland Inventory – Current Status and Future Priorities.” Marine and Freshwater Research 50 (8): 717–727. doi:https://doi.org/10.1071/MF99098.
- Gazete, R. [Official Newspaper]. 1946. “Sıtma Savaşı Kanunu.” [Law on Malaria War]. 21.02.1946.Sayı [Number]: 6238.
- Gazete, R. [Official Newspaper]. 1950. “Bataklıkların Kurutulması Ve Bundan Elde Edilecek Topraklar Hakkında Kanun [Law on the Drainage of Swamps and the Land to Be Obtained from It].” 23.01.1950.Sayı [Number]: 7413.
- Georges, A., and P. Cottingham. 2002. “Biodiversity in Inland Waters – Priorities for Its Protection and Management.” In Recommendations from the 2001 Fenner Conference on the Environment, Australia: Cooperative Research Centre for Freshwater Ecology. Githeko A.K.
- Gereta, E., M. Geo, S. Mduma, and E. Wolanski. 2004. “The Role of Wetlands in Wildlife Migration in the Tarangire Ecosystem.” Wetlands Ecology and Management 12: 285–299. doi:https://doi.org/10.1007/s11273-005-3499-2.
- Gosselink, J. G., and E. Maltby. 1990. “Wetland Losses and Gains.” In Wetlands: A Threatened Landscape, edited by M. Williams, 296–322. Oxford, U.K.: Blackwell Publishing.
- Gül, O., O. Onmuş, and M. Sıkı. 2013. “Significant Impacts of Water Level and Human Intervention on Natural Habitats and Breeding Waterbirds in Marmara Lake.” Ekoloji 22 (89): 29–39. doi:https://doi.org/10.5053/ekoloji.2013.894.
- Hurrell, J. W. 1995. “Decadal Trends in the North Atlantic Oscillation: Regional Temperatures and Precipitation.” Science 269: 676–679. doi:https://doi.org/10.1126/science.269.5224.676.
- IPCC (Intergovernmental Panel on Climate Change). 2018. “Global Warming of 1.5°C. An IPCC Special Report on the Impacts of Global Warming of 1.5°C above Pre-industrial Levels and Related Global Greenhouse Gas Emission Pathways, in the Context of Strengthening the Global Response to the Threat of Climate Change, Sustainable Development, and Efforts to Eradicate Poverty” [Masson-Delmotte V, Zhai P, Pörtner HO, Roberts D, Skea J, Shukla PR, Pirani A, Moufouma-Okia W, Péan C, Pidcock R, Connors S, Matthews JBR, Chen Y, Zhou X, Gomis MI, Lonnoy E, Maycock T, Tignor M, Waterfield T (eds.)]. In Press.
- Jones, T. A., and J. M. R. Hughes. 1993. “Wetland Inventories and Wetland Loss Studies: A European Perspective.” In Waterfowl and Wetland Conservation in the 1990s, edited by M. Moser, R. C. Prentice, and J. Van Vessem, 164–170. Slimbridge, UK: IWRB. IWRB Special Publication No. 26.
- Kılıç, D. T., and G. Eken, eds. 2004. Türkiye’nin Önemli Kuş Alanları- 2004 Güncellemesi [Important Bird Areas of Turkey, 2004 Update]. Ankara Turkey: Doğa Derneği.
- Kingsford, R. T., and K. M. Auld. 2005. “Waterbird Breeding and Environmental Flow Management in the Macquarie Marshes, Arid Australia.” River Research and Applications 21 (2–3): 187–200. doi:https://doi.org/10.1002/rra.840.
- Maltby, E., and T. Barker, eds. 2009. The Wetlands Handbook, 2 Volume Set. John Wiley & Sons.
- McCully, P. 1996. Silenced Rivers: The Ecology and Politics of Large Dams. Zed Books.
- Millennium Ecosystem Assessment. 2005. Ecosystems and Human Well-Being: Wetlands and Water Synthesis, 80. Washington, DC: World Resources Institute. ISBN 1-56973-597-2.
- Mitsch, W. J., and J. G. Gosselink. 2015. Wetlands, 736. New Jersey: Wiley. ISBN 978-1-118-67682-0.
- Onmuş, O., Y. Ağaoğlu, and O. Gül. 2012. “Environmental Factors Affecting Nest Site Selection and Breeding Success of the White Stork (Ciconia ciconia) in Western Turkey.” The Wilson Journal of Ornithology 124 (2): 354–361. doi:https://doi.org/10.1676/11-155.1.
- Onmuş, O., and M. Sıkı. 2013. “Impacts of Anthropogenic Activities and Habitat Degradation, on Breeding Waterbirds.” Turkish Journal of Zoology 37 (3): 249–261.
- Onmuş, O., M. Sıkı, G. Sarıgül, and A. J. Crivelli. 2011. “Status and Development of the Population of the Globally Threatened Dalmatian Pelican, Pelecanus Crispus, in Turkey.” Zoology in the Middle East 54: 3–17. doi:https://doi.org/10.1080/09397140.2011.10648876.
- Ornithological Society of Turkey. 1968. Bulletin. Vol. 1. England: Bedfordshire.
- Partal, T., and E. Kahya. 2006. “Trend Analysis in Turkish Precipitation Data.” Hydrological Processes 20: 2011–2026. doi:https://doi.org/10.1002/hyp.5993.
- Ramsar. 2002. “The Report of the World Commission on Dams (WCD) and Its Relevance to the Ramsar Convention, Ramsar COP8 DOC. 10. 21 Pp. In: Wetlands: Water, Life, and Culture.” In 8th Meeting of the Conference of the Contracting Parties to the Convention on Wetlands (Ramsar, Iran, 1971). Valencia, Spain, November 26.
- Ramsar. 2005. “Regional Overview of the Implementation of the Convention and Its Strategic Plan 2003–2008 in Asia.” In Wetlands and Water: Supporting Life, Sustaining Livelihoods. 9th Meeting of the Conference of the Contracting Parties to the Convention on Wetlands (Ramsar, Iran, 1971). Kampala, Uganda, November 15.
- Ramsar. 2018. Global Wetland Outlook: State of the World’s Wetlands and Their Services to People. Gland, Switzerland: Ramsar Convention Secretariat.
- Ramsar Convention Secretariat. 2010. Wetland Inventory: A Ramsar Framework for Wetland Inventory and Ecological Character Description. Ramsar Handbooks for the Wise Use of Wetlands. Vol. 15. 4th ed. Gland, Switzerland: Ramsar Convention Secretariat.
- Sousa, P. M., R. M. Trigo, P. Aizpurua, R. Nieto, L. Gimeno, and R. Garcia-Herrera. 2011. “Trends and Extremes of Drought Indices Throughout the 20th Century in the Mediterranean.” Natural Hazards and Earth System Sciences 11: 33–51. doi:https://doi.org/10.5194/nhess-11-33-2011.
- Tuğluoğlu, F. 2008. “Combating with Malaria in Turkey.” [Türkiye’de Sıtma Mücadelesi (1924-1950)]. Türkiye Parazitoloji Dergisi 32 (4): 351–359..
- Turkeş, M. 1998. “Infuence of Geopotential Heights, Cyclone Frequency and Southern Oscillation on Rainfall Variations in Turkey.” International Journal of Climatology 18: 649–680. doi:https://doi.org/10.1002/(SICI)1097-0088(199805)18:6<649::AID-JOC269>3.0.CO;2-3.
- Turkeş, M., and E. Erlat. 2003. “Precipitation Changes and Variability in Turkey Linked to the North Atlantic Oscillation during the Period 1930–2000.” International Journal of Climatology 23: 1771–1796. doi:https://doi.org/10.1002/joc.962.
- Turkeş, M., T. Koc, and F. Saris. 2009. “Spatiotemporal Variability of Precipitation Total Series over Turkey.” International Journal of Climatology 29: 1056–1074. doi:https://doi.org/10.1002/joc.1768.
- Türkezer, A., and S. Çobanoğlu. 2012. “The History of Turkish Cartography - The maps with 1/200,000 scale.” [Türk Haritacılık Tarihi-1:200.000 Ölçekli Haritalar]. Harita Dergisi 148: 25–61.
- Unal, Y., T. Kindap, and M. Karaca. 2003. “Redefining the Climate Zones of Turkey Using Cluster Analysis.” International Journal of Climatology: A Journal of the Royal Meteorological Society 23 (9): 1045–1055. doi:https://doi.org/10.1002/joc.910.
- Yarar, M., and G. Magnin. 1997. Important Bird Areas of Turkey. Istanbul: DHKD.
- Yiğitbaşıoğlu, H. 1996. “Dams in Turkey.” [Türkiye’deki Barajlar]. Ankara Üniversitesi Türkiye Coğrafyası Araştırma ve Uygulama Merkezi Dergisi 5: 171–181.