
 ?Mathematical formulae have been encoded as MathML and are displayed in this HTML version using MathJax in order to improve their display. Uncheck the box to turn MathJax off. This feature requires Javascript. Click on a formula to zoom.
ABSTRACT
Low biological productivity causes ecosystem energy deficiency. Sansha Bay is an important spawning and nursery ground for migratory fish in the East China Sea (ECS). There is significant mariculture in this area, but stock enhancement programs and seasonal fishery closures have failed to recover populations of the commercially important species, Larimichthys crocea. We want to figure out the potential reason of unsuccessful L. crocea resource in recent 30 years. In this study, the trophic status of L. crocea, the food source proportions of L. crocea and zooplankton, and the food web structure and functioning of Sansha Bay was analyzed. A high nutrient low chlorophyll phenomenon was observed: this prevented harmful algal blooms, and phytoplankton growth was restrained by intensive macroalgal culture, resulting in a low abundance of zooplankton in Sansha Bay. Phytoplankton was the most important food source of zooplankton, and zooplankton was the greatest food source of juvenile L. crocea. Analyzed L. crocea suffered from starvation. Crucially, most of the phytoplankton was not used efficiently in the Sansha Bay ecosystem. This study suggests that trophic bottleneck, caused by food limitation, is a potential reason for unsuccessful fishery recovery in enclosed bay with macroalgal culture.
Introduction
Most of the world’s fisheries have been overexploited over the past few decades; the average trophic level of food webs has declined (Pauly et al. Citation1998), and marine ecosystems have been negatively affected (Pipitone et al. Citation2000). More than 26 billion juveniles, of 180 marine species, are released every year in more than 20 countries, for both stock enhancement and to relieve fishery pressure (Kitada Citation2020). The large yellow croaker (Larimichthys crocea) was once the most consumed commercial marine finfish in the East China Sea (ECS). However, since the 1980s, wild stock has collapsed because of the heavy exploitation of spawning and overwintering aggregations through the fishing method “Qiao Gu” (hitting the interior of the boat hull with a club, sending sound waves through the water to stun the fish). To help recovery, L. crocea stock enhancement programs have been undertaken since 1987, releasing 16,200 juvenile fish in the first year. The number of juvenile L. crocea in Sansha Bay has fluctuated but has remains above two million; in 2015, the number of released juveniles exceeded 10 million (Fig. S1). Management, including seasonal fishery closures, restocking, and mariculture, are mitigation measures that have been introduced for decades, but wild stocks of L. crocea have never recovered (Liu and De Mitcheson Citation2008).
Sansha Bay is an enclosed bay with 2.9 km-wide narrow baymouth, in Southeast China. The hydrodynamic conditions are significantly affected by intensive mariculture (Lin et al. Citation2017, Citation2019); the half-exchange time of seawater exceeds 30 days at the bay heads (Lin et al. Citation2017). Sansha Bay includes Guanjingyang, which used to be an important spawning ground for Min-Yuedong stock (three putative geographic stocks of L. crocea were initially identified in the coastal waters of China: the Daiquyang, Min-Yuedong, and Naozhou stocks). Sansha Bay is an important habitat of L. crocea because the adjacent waters are nursery grounds (Liu and De Mitcheson Citation2008; Chen and Xu Citation2012). Early life history is the crucial period for stock recruitment, and juvenile survival rate greatly affects population fluctuation (Hussy, StJohn, and Bottcher Citation1997; Murawski Citation2007). Sansha Bay is also a typical aquaculture ecosystem: the surface seawater is filled with macroalgal culture, and the near-shore area has a co-existing fish cage culture. Satellite images from 2000 to 2019 reveal the interannual variation on the mariculture scale (Fig. S2): fish (e.g., L. crocea) and macroalgae (e.g., Gracilaria lemaneiformis and Laminaria japonica) are the main culture species. Macroalgae, which are used in agar extraction (G. lemaneiformis), abalone feeding, and human consumption yielded more than 80,000 tons in 2018 (Scieszka and Klewicka Citation2019; Xie et al. Citation2020).
Although macroalgae absorbs excessive inorganic nutrients from fish cages and terrestrial sources, and prevents the proliferation of harmful algal blooms (HABs) (Wei et al. Citation2017), phytoplankton growth is restricted by nutrient competition, allelopathy, and shelter (Lurling, Van Geest, and Scheffer Citation2006; Cheng and Cheng Citation2015; Cunha et al. Citation2019). This affects the efficiency of bottom-up transfer through food webs.
In the pelagic ocean, biological dynamics are intermittent, rather than steady (Platt et al. Citation1989). Mid-trophic pelagic fish are abundant and play a crucial role in marine ecosystems (Frederiksen et al. Citation2006), which is important in bottom-up control. Furthermore, nutrient supply is a key bottom-up control of phytoplankton, and phytoplankton are critical driver of zooplankton biomass, which constitute the basic components of biological production (Matsuzaki et al. Citation2018; Anneville et al. Citation2019). Bottom-up drivers and trophic interactions during the early life history of migratory fish are important factors in recruitment stock dynamics and the decline in wild resources (Murawski Citation2007; James et al. Citation2020). McKinnell et al. (Citation2014) developed the “trophic gauntlet hypothesis,” which states that low biological productivity leads to an energy deficit. Trophic connectivity and continuity in food webs are important for ecosystem development (Claudino et al. Citation2015): in Sansha Bay, the production of phytoplankton and macroalgae is the trophic base that transfers energy to primary consumers and higher trophic consumers (Watanabe, Kawamura, and Yamashita Citation2018). Juvenile L. crocea prefer prey, such as decapoda, meso-zooplankton, and mysid, which are mostly primary consumers (Xu et al. Citation2012). Stable isotope analysis and the Ecopath model can aid ecologists in understanding trophic dynamics (Navarro et al. Citation2011). Stable isotopes (carbon: δ13C, nitrogen: δ15N) are powerful tools that reveal carbon sources and trophic positions in food webs (Post Citation2002), using the specific fractionation values (Tieszen et al. Citation1983; Hobson and Welch Citation1992). Ecopath, a module of the EwE software, is widely used in analyzing the food web structure and functioning of an aquatic ecosystem, based on energy and material flow (Heymans, Shannon, and J.&Jarre Citation2004; Coll et al. Citation2015). To determine why L. crocea recovery has been unsuccessful, the following questions were addressed in this study: (1) how are ecological characteristics affected by intensive mariculture and (2) whether juvenile L. crocea aggregations under the trophic gauntlet results in the unsuccessful wild resource recovery.
Methods and materials
Sampling area
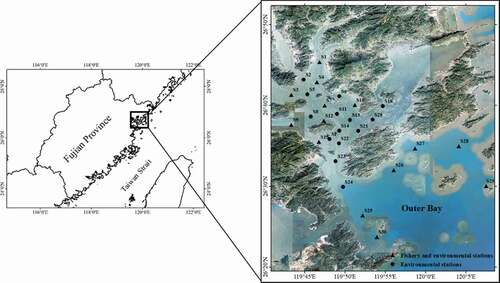
Sansha Bay is an enclosed bay with a single narrow outlet (Dongchong Channel), connecting it to the ECS. It is located on the northeast coast of the Fujian Province, China, and covers an area of approximately 675 km2. This area is an excellent natural harbor because of its deep water, low wind, and small waves (Wu et al. Citation2012). Sansha Bay is one of the most important aquaculture bases in China and an essential natural nursery and spawning ground for migratory fish species, such as L. crocea. The sampling sites of fishery and environmental surveys are shown in . The fishery survey was independent of the environmental survey. All samples (environmental and fishery) were collected in January (winter), April (spring), July (summer), and October (autumn) 2019. Historical data (dissolved inorganic nutrients, chlorophyll, and zooplankton) from 1990, 2000, 2005, 2007, 2010, and 2012 were provided by the Fujian Fisheries Resources Monitoring Center (Table S2).
Figure 1. Sampling sites for the fishery and environmental investigation in Sansha Bay. Triangle: fishery and environmental stations, circle: environmental stations
Environmental surveys
Chlorophyll a (Chl a) was measured with the fluorescence method. Specifically, 500 mL water samples were pre-filtered through a 200-μm mesh sieve for the removal of large zooplankton and debris. Filtered water was then passed through 0.7-μm GF/F filters (Whatman, England), wrapped in aluminum foil and stored at −20°C in the dark. Chl a was extracted using 10 mL 90% acetone at 0°C for 20 h in the dark, and measured using a Trilogy fluorometer (Turner Designs, Trilogy Module: CHL-A NA, Model #7200-046).
Water samples were filtered through 0.7-μm GF/F filters with filtered water and then stored at −20°C in the dark prior to dissolved nutrient analysis (nitrate [NO3−], nitrite [NO2−], ammonia [NH4+], and phosphate [PO43-]). Filtered water was analyzed through segmented flow automated colorimetry, according to the manufacturer’s standard procedures (San + + Automated Wet Chemistry Analyzer, The Netherlands). Dissolved inorganic nitrogen (DIN) content was calculated by the sum of NO3−, NO2−, and NH4+. Precision was estimated by repeated determinations of 10% of the samples, and the relative error was 3–5%. For quality control in the laboratory, a standard reference material, provided by the National Environmental Protection Agency, was used to check instrument performance within −1% to +4% deviations from the standard concentrations.
Fishery investigations
Fishery investigations were conducted in spring (April), summer (July), autumn (October), and winter (January) 2019. The sampling locations were categorized into inner and outer bay (). Stow net fishing was the most appropriate method because of the mariculture facilities inside the bay. The width and height of the net mouth were 28 and 17.5 m, respectively, and the total length of the netting gear was 50 m. The mesh sizes of the cod-net and net mouth were 1.5 and 10 cm, respectively, and the duration of each operation was approximately 12 h. Outside the bay, trawl fishing was adopted. The mesh size of the cod-net was 2 cm, the towing speed was approximately 3 kn, and the duration of each operation was 30–60 min. Every species in the catch was identified to the smallest possible unit (genera or species) and counted: weight (W) and length (L) were also recorded. The stomach fullness index of L. crocea was based on the marine biological survey of specifications for oceanographic survey, and the stomach fullness index of fish was divided into five levels, from level 0 to level 4 (integer), representing the different conditions of stomach fullness.
Stable isotope analysis
Samples for stable isotope analysis were collected in spring (April), summer (July), and autumn (October), including L. crocea, particulate organic matter (POM), sedimentary organic matter (SOM), phytoplankton, zooplankton, and shrimp. The sampling sites for POM, SOM, phytoplankton, and zooplankton were synchronized with the environmental investigation, and those for L. crocea and shrimp were synchronized with the fishery investigation.
POM samples (1 L – 2 L) were collected from the sea surface layer, and prefiltered through 200-μm mesh sieves to remove large inorganic particles and zooplankton. The prefiltered water samples were then passed through pre-combusted GF/F filters, and heated for 4 h at 450°C for organic matter removal. Phytoplankton samples were collected from 2 L of surface water that was prefiltered through 200-μm mesh sieves, and then left to stand for 24 h at an environmental temperature of approximately 25°C. The supernatant was then siphoned and passed through pre-combusted GF/F filters. POM and phytoplankton were acidified through 24-h exposure to hydrochloric acid fumes for inorganic carbon removal, rinsed with Milli-Q water, and dried at 60°C for stable isotope analysis.
The sediment was collected with a grab sediment sampler, and the SOM samples were collected approximately 1 cm from the surface layer of the sediment. An excess of 1 M HCl solution was added, and the mixture was stirred for the completion of the reaction (until no bubbles were generated for the removal of the effect of inorganic carbon). The sample was then rinsed with Milli-Q water to neutral (pH = 7). Zooplankton samples were divided into two parts, representing the specific size of zooplankton and collected vertically with a shallow water plankton net (mesh size 180 μm). First, the samples were passed through a 505-μm mesh. The organisms remaining on the mesh were flushed with Milli-Q water into a centrifuge tube. This faction represented zooplankton >505 μm. The filtrate was filtered again with a 160-μm mesh, and the organisms remaining on the mesh were flushed with Milli-Q water into a centrifuge tube. This fraction represented zooplankton between 160 and 505 μm. For the tissue samples, white muscle was collected near the first dorsal fin of fish, and abdominal muscle was collected from shrimp. After collection, all samples were washed with Milli-Q water. SOM and tissue samples were dried at 50°C for ≥48 h. The tissue samples were then ground into a fine powder prior to stable isotope analysis.
Stable isotopic signatures and elemental concentrations were determined using a continuous flow isotope ratio mass spectrometer (Delta V Advantage; Thermo Fisher Scientific, Whaltham, MA, USA). Isotopic ratios were expressed as follows:
where R represents the 13C/12C or 15N/14N ratio. The reference standards were PeeDee Belemnite and atmospheric N2 for carbon and nitrogen, respectively. Analytical precision was ± 0.2‰ for δ13C and δ15N. The mathematical normalization (2) of lipids is essential when the C:N ratio is >3.5 for aquatic organisms (Post et al. Citation2007). The effect of lipid content variation on δ13C can be determined as follows:
The contribution proportion of potential sources and visualization of L. crocea and zooplankton were calculated and drawn using the MixSIAR package in R v3.1 (Stock and Semmens Citation2016). The trophic discrimination factors (TDFs) of ∆δ15N (3.54 ± 0.74) and ∆δ13C (1.63 ± 0.63) were selected as the default data and derived by averaging TDFs across all species from the major taxonomic groups (Deniro and Epstein Citation1981; Post Citation2002).
Ecopath model
Basic principle of the EwE model
The trophic structure and energy flow of Sansha Bay ecosystem were developed by the Ecopath model, based on two main equations (Christensen, Walters, and Pauly Citation2005). The first Ecopath equation was used to explain production in each group. Production included fishery catch, predation, migration, biomass accumulation, and exports as follows:
where Bi and Bj are the biomass of prey (i) and predator (j), respectively; (P/B)i is the production/biomass ratio; EEi is the ecotrophic efficiency (); (Q/B)j is the consumption/biomass ratio of predator; DCji is the proportion of prey i in the diet composition of predator j; Yi is the total fishery catch; and Ei is the net migration; and BAi is the biomass accumulation rate of the prey i.
The second equation describes the energy balance for each group, as follows:
The production can be calculated as follows:
The Ecopath model requires at least three of four parameters, including B, P/B, Q/B, and EE. Hence, three parameters were used to estimate the unknown parameter by EwE: EE is the most difficult to obtain, and thus was calculated using the other parameters.
Modeling parameters
Input functional groups should be based on similar ecological functions or keystone species and must cover the total material flow in the ecosystem. Here, 22 functional groups were defined and are listed in Table S4. The biomass of each parameter was obtained from the 2010 fishery survey conducted by the East China Fisheries Research Institute, and the mariculture biomass data (bivalves and macroalgae) were acquired from the fishery statistical yearbook of Fujian province. Detritus biomass was estimated by the empirical formula, as follows (Pauly and Christensen Citation1993):
where D is the biomass of detritus (g C/m2); PP is the primary productivity (g C/[m2 × y]); and E is the depth of photic zone (m). The biomass of phytoplankton was estimated from Chl a concentration values, and the carbon content of 1 unit mass of Chl a 50 g C/g (Ahlgren Citation1983). P/B and Q/B values for functional groups are listed in Table S4: most parameters of P/B, Q/B, and the diet compositions for all functional groups of the Sansha Bay were based on published data from study areas close to, or within, Sansha Bay. The diet composition of the same functional group was selected for the construction of a matrix (see Table S5).
Model balance and parameter uncertainty assessment
The model should be balanced between inputs and outputs, the EE value for each group is less than 1, and the P/Q values of most groups are physiologically realistic (0.1–0.3). A “Pedigree” routine was used to quantify the uncertainties of input parameters of the Ecopath model (Christensen, Walters, and Pauly Citation2005). Ecosampler, a new module of EwE, was used to measure the effect of input parameter sensitivity on the results (Steenbeek et al. Citation2018). Monte Carlo was instructed to vary four basic Ecopath input parameters: biomass (B), production rate (P/B), consumption rate (Q/B), and Ecotrophic efficiency (EE). In this study, 1000 Monte Carlo simulation trials were executed, which evaluated the quality of the input data. The uncertainty analysis of parameters based on Ecosampler is shown in Fig. S6 and S7.
Index computation and statistical analysis
Relative fatness is an important fishery ecology index, reflecting the physiological and nutritional status of individuals (Bolger and Connolly Citation1989). Parameters a and b were condition factor and allometric factor in body weight–length relationship, respectively:
(6)
The relative fatness of L. crocea was represented by relative weight (Wrm) with weight W (g) and length L (cm), and is given by
where am and bm are the geometric mean a and mean b, respectively.
The weight (W) and length (L) of L. crocea were recorded from the fishery investigation. Parameters a and b were calculated by liner regression (Equationeq. 6)(6)
(6) . The am and bm present the mean values of parameters a and b, respectively, which included fishery investigations in the four seasons. The comparison among the relative fatness of L. crocea of the seasons was under the same length group, which was between 100 mm and 200 mm.
The sampling site figures were made with ArcGIS (version 10.2, Esri Inc., California, USA). The statistical figures were produced with Origin 2017 (OriginLab Corp., Massachusetts, USA). All statistical analyses (one-way analysis of variance, ANOVA) were performed using SPSS software (v 13.0, SPSS Inc., Chicago, IL, USA).
Results
Characterization of high nutrient low chlorophyll in Sansha Bay
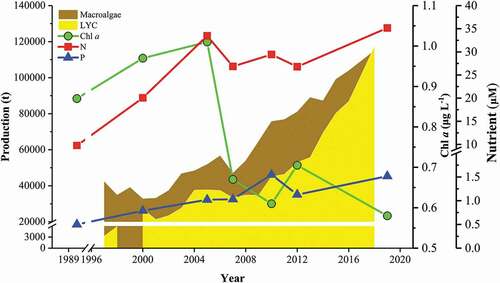
The cultured fish yields in 2005 (52,975.5 t) and 2010 (51,952.0 t) were lower than in 2000 (81,227.0 t) (). According to the aerial view figures of Sansha Bay in 2010, there were no fish cages in the central area of Sansha Bay (Fig. S2); from 2010 to 2016 the quantity of cages nearly doubled (). The aquaculture scale of macroalgae increased slowly from 2000 to 2005, but the macroalgae yield nearly doubled in 2010, and continuously increased. With the substantial increase in the scale of fish cage culture, the concentrations of DIN and soluble reactive phosphorus (SRP) did not change, and remained at approximately 30.3 and 1.2 μM, respectively (), close to the respective maximum national standards of 35.7 and 1.45 μM. Intensive fish cage culture has increased the amount of fish feed and released a large amount of dissolved nutrients; however, the concentrations of dissolved nitrogen and phosphorous did not increase, because of primary producers (macroalgae). The concentration of Chl a decreased from 0.65 µg L−1 in 2005, when the amount of macroalgal culture increased. The Chl a level in Sansha Bay was lower (0.58 µg L−1) than in other eutrophic bays () and significantly lower than in the ECS (P < 0.05, unpublished data). Therefore, the phenomenon of high nutrient low chlorophyll (HNLC) occurs in Sansha Bay with intensive macroalgal culture.
Table 1. Interannual variation in mariculture
Table 2. Concentration of Chl a in different eutrophic bays
Figure 2. Interannual dynamic of nutrients (N and P) and Chl a from 1990 to 2020
Trophic gauntlet of L. crocea
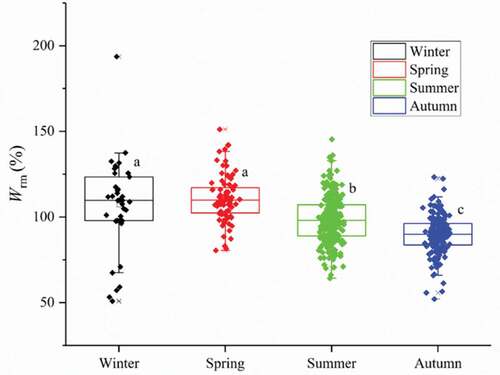
The stomach fullness indices of L. crocea were 0 and 1 in all seasons: the proportion reached 96.0% and 95.8% in autumn and summer, respectively (). These results indicate scarce food sources for L. crocea. The relative fatness of L. crocea was significantly larger during winter (106.99%) and spring (110.86%) than in summer (98.63%) (P < 0.05), with the lowest value in autumn (89.64%) ().
Figure 3. Stomach fullness index of L. crocea. The stomach fullness index of fish was divided into five levels, from level 0 to level 4 (integer), which represent the different conditions of stomach fullness as follows: Level 0, Empty stomach; Level 1, less food in stomach, the volume of food less than 1/2 of gastral cavity; Level 2, more food in stomach, the volume of food larger than 1/2 of gastral cavity; Level 3, full of food in stomach, the stomach wall does not swell; and Level 4, full of food in stomach, the stomach wall swell. The majority of L. crocea belonged to Levels 0 and 1 of the stomach fullness index
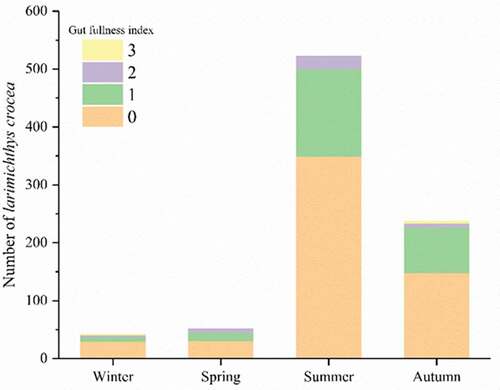
Figure 4. Seasonal variation of the relative fatness of L. crocea in Sansha Bay (a, b, and c represent significant differences among seasons)
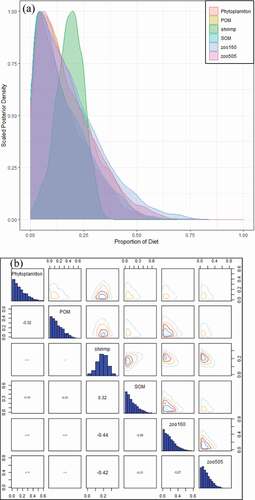
The food source component of L. crocea varied with history stage, according to the MixSIAR model: zooplankton and shrimp, which are important food sources of juvenile L. crocea, occupied 35.8% and 18.5%, of all the components of L. crocea, respectively. The source proportions of shrimp and zooplankton had an obviously negative correlation compared to other source components ().
Figure 5. (a) Posterior plot of L. crocea’s diet, MixSIAR estimated posterior distributions of source proportions; otherwise, under determination together with variability distributions for many of the proportional contribution estimates, limiting the interpretability of the results (b) Pairs plot of the posterior diet proportions of L. crocea.
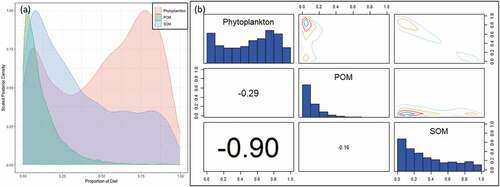
Food availability and community variation of zooplankton are important because of their crucial roles in the food supply of L. crocea. Phytoplankton and SOM were the main food sources of zooplankton in Sansha Bay, occupying 51.5% and 36.2% of all components, respectively. A negative relationship was found between phytoplankton and SOM. POM had the lowest contribution proportion and exhibited no correlation with other sources ().
Figure 6. (a) Posterior plot of zooplankton’s diet, (b) Pairs plot of the posterior diet proportions of zooplankton. POM, particulate organic matter; SOM,: sedimentary organic matter
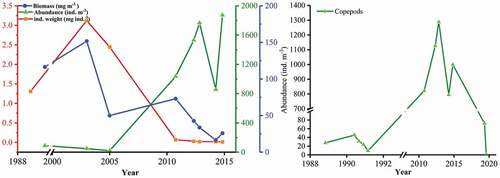
Although the abundance of zooplankton increased from 1988, and reached 1873.23 ind. m−3 in 2014, its biomass decreased dramatically over the last two decades, with the lowest value of 16.48 mg m−3 recorded in October 2014 (). The sharp decline in individual weight was accompanied by variations in abundance and biomass, indicating the individual miniaturization of the zooplankton community. Moreover, the abundance of copepods sharply decreased in the previous 5 years, along with increasing aquaculture, especially macroalgal culture, in Sansha Bay ().
Figure 7. Interannual variation in zooplankton community (a) and copepods (b)
Ecological diagnosis of Sansha Bay based on Ecopath model
The results of the uncertainty assessment of input parameters, which are based on 1000 Monte Carlo simulation trials by Ecosampler, showed the average perturbation rate was less than 10% (Fig. S6). The pedigree was 0.65, which was obviously higher than 150 previous Ecopath models (Morissete, Hammill, and Savenkoff Citation2006). The trophic levels (TLs) ranged from 1.00 to 3.18 (Table S4) and were based on energy flow transformation. The energy of phytoplankton and detritus were concentrated in TL I, the energy of zooplankton was concentrated in TL II, and the energy of L. crocea was concentrated in TLs III and IV (Table S8). These results show that the energy of phytoplankton, except the harvested energy of mariculture product (farmed fish, macroalgae, and bivalves), flows to zooplankton and anchovy, and that of zooplankton flows to shrimp and L. crocea, which are important food sources. The EEs of cultured macroalage, cultured bivalves, and zooplankton were 0.04, 0.18, and 0.15, respectively, which were relatively low. By contrast, the EEs of secondary consumers, which mostly consisted of commercial species (anchovy and Mugilidae), were obviously higher. The results of Lindeman spine () show that the flows from lower TLs to higher TLs of the grazing food chain (20.7%) were lower than those of the detrital food chain (80.4%). The mean transfer efficiencies were 5.062% and 3.903% for grazing food chain and detritus food chain, respectively, and the total transfer efficiency was 4.161% ().
Table 3. Transfer efficiency in different trophic levels from producer and detritus
Figure 8. Lindeman spine of the ecosystem of Sansha Bay. (P represents trophic flows from producers, D represents flows from detritus, TST represents total system throughput, and TE represents trophic efficiency)
The keystone species identification from Ecopath, proposed by Libralato, Christensen, and Pauly (Citation2006), indicated that zooplankton was the most important group in Sansha Bay (Fig. S9), and the important primary consumer transfers energy from primary producer and detritus to higher trophic consumers. The small variation in the zooplankton biomass would affect other ecosystem elements, such as L. crocea.
The total ecosystem throughput of Sansha Bay was 9244.49 g/m2/year. The mean trophic level (MTL) of the catch and the total catch were 1.74 and 171.57 g/m2/year, respectively. The ratio between total primary production and total respiration (TPP/TR) was 1.22. The connectance index (CI) and system omnivory index (SOI) were 0.34 and 0.08, respectively. Finn’s cycling index (FCI) and Finn’s mean path length (MPL) were 18.34 and 3.51, respectively ().
Table 4. Characteristics of the ecosystem of Sansha Bay
Discussion
Special features of aquaculture ecosystem
The TPP/TR in most aquaculture ecosystems is much greater than 1 () and presented the immature status (Odum Citation1969). The niche specialization of Sansha Bay was considerably narrower than other ecosystems, based on the lower SOI. The high CI of Sansha Bay ecosystem indicated greater robustness compared with other ecosystems, indicating that the ecosystem was not easily disturbed by environmental changes and human activities; the complex network of trophic interactions that maintain the functioning of food webs may counteract degradation (McMeans et al. Citation2016). Intensive mariculture (macroalgae and bivalves) resulted in lower MTL. Excessive and unordered aquaculture resulted in redundancy of ecosystem primary production (TPP/TR) that could not be used efficiently. The aquaculture type in Sansha Bay is more comprehensive and complex than other bays and, therefore, it needs more scientific methods to quantify the different types of aquaculture in the future, rather than maximization of economic benefits.
Table 5. Characteristics of the ecosystem of Sansha Bay compared with other aquaculture ecosystems
The high EE value of secondary consumers, such as anchovy and Mugilidae, indicate the impact of serious top-down pressure: these consumers are important predators of zooplankton. However, the EE of phytoplankton was relatively low in Ecopath and, thus, the majority of phytoplankton was inefficiently used in the system and flowed into detritus, increasing the risk of endogenous pollution (Han et al. Citation2016). The concentration of Chl a was also obviously lower than in other eutrophic bays. These factors stimulated the declining abundance and individual miniaturization of zooplankton, which is the most important food source of juvenile L. crocea under low predation pressure. Transfer efficiency was high in the most mariculture ecosystem () and higher than the 10% according to Lindeman (Lindeman Citation1942) because the cultured macroalgae and bivalves were harvested through manipulation. However, the transfer efficiency was obviously lower in Sansha Bay (4.16%) and Tapong Bay (5.50%), which were all enclosed bays with poor water exchange. In addition, large amount of fish feed was used for fish cage culture in Sansha Bay compared with other aquaculture ecosystem, which resulted in the lowest transfer efficiency of ecosystem.
Intensive macroalgae culture is a double-edged sword
Fish cage cultures in Sansha Bay require millions of tons of fish feed (Xie et al. Citation2020); mainly artificial compound feed and frozen trash fish, which constitute more than 0.8 million tons (Fig. S10). L. crocea feed diets cannot be fully utilized and are left unused and decompose, releasing inorganic nutrients into the water, especially frozen trash fish, which easily decomposes (Duan et al. Citation2001; Li et al. Citation2010). Husa et al. (Citation2014) reported the nitrogen emissions from farmed Atlantic salmon (Salmo salar): for every one ton of Atlantic salmon produced, 11 kg of DIN is discharged into the water. Based on nitrogenous waste model, the total, dissolved and particulate nitrogen outputs were estimated to be 13,351 and 82 kg N ton−1 of fish production, respectively (Cai et al. Citation2016). Intensive mariculture, especially of fish or shellfish, generates nutrient waste that increases the risk of HABs (Bouwman et al. Citation2013). A historical study in Sansha Bay reported that the concentrations of DIN and SRP in a fish cage culture zone were significantly higher than in macroalgal culture zones (Shao et al. Citation2018). The intensive macroalgal culture absorbs excessive inorganic nutrients (N and P) from fish cage cultures and terrestrial sources in Sansha Bay; no large-scale red tides have occurred in this area for the past 20 years (Wu et al. Citation2012). Large-scale macroalgal culture is an effective measure for purifying aquaculture waste, controlling eutrophication, and improving seawater utilization (Troell et al. Citation2003; Chopin et al. Citation2012; Alexander et al. Citation2015) and is an important component of integrated multitrophic aquaculture (Mao et al. Citation2018). Nutrient competition (Huang, Ou, and Yang Citation2017), allelopathy (Mulderij, Smolders, and Van Donk Citation2006; Cheng and Cheng Citation2015), and the shading effect (Fong and Zedler Citation1993) influence the growth and community structure of phytoplankton. Xing et al. (Citation2015) used a long-term moderate resolution imaging spectroradiometer and discovered that the nutrient competition between macroalgae and phytoplankton results in alterations in Chl a. In this study, the concentration of Chl a did not increase significantly with fish cage culture, and maintained a low but stable state in Sansha Bay, mainly because of the macroalgal culture. Although the macroalgal culture has effectively prevented the occurrence of HABs and improved water quality, it has also influenced ecological functions and trophic connectivity. Primary producers, such as phytoplankton, and primary consumers or zooplankton are the basic trophic levels of coastal systems (Das and Ray Citation2008). According to the concept of bottom-up control, phytoplankton stimulate zooplankton development (Wilk-Woźniak, Pociecha, and Bucka Citation2001), zooplankton are important prey for fish larvae, and “bloom” phytoplankton conditions are important for high fish recruitment, according to the coupling model (Biktashev, Brindley, and Horwood Citation2003) and Continuous Plankton Recorder (CPR) survey by NOAA (Pershing et al. Citation2005). HNLC typically occurs in enclosed bays with macroalgal culture.
Trophic bottleneck as a potential reason for unsuccessful L. crocea recovery
Resources (food and nutrients) sustain biological production and food webs in resource-limited habitats (Cloern Citation2007). Ecological connectivity, including the movements of organisms, materials, and energy, plays a crucial role in different habitats (Taylor et al. Citation1993; Sheaves Citation2009). Trophic connectivity and environmental factors are important to fishery resources, and plankton are essential prey for fish larvae in early life history stages (Daewel, Peck, and Schrum Citation2011; Kasai et al. Citation2018), influencing fish recruitment, and material and energy translation in food webs (Cowen et al. Citation2007; Xiong et al. Citation2017). The nursery role of specific marine habitats is crucial in the connectivity between juvenile and adult habitats (Gillanders et al. Citation2003). Sansha Bay is an important nursery and spawning ground of migratory fish, such as L. crocea. In spring, the spawning stock from overwintering ground accumulates in Sansha Bay for breeding; in summer and autumn, larval and juvenile fish feed in Sansha Bay and adjacent waters. The feeding in this period is important to survival, especially in the early life history stage, and influences the dynamics of recruitment stock (Murawski Citation2007; Boeing and Duffy-Anderson Citation2008; Daewel, Peck, and Schrum Citation2011; Kasai et al. Citation2018). The result of relative fatness of L. crocea indicated trophic challenge (food limitation) in the important growth seasons (summer and autumn). Zooplankton (e.g., Copepoda) is the important initial feed for L. crocea (Xu et al. Citation2012), and its abundance in Sansha Bay was significantly lower than in the ECS (unpublished data, P < 0.05). Zooplankton individuals are miniaturized in Sansha Bay, thus aggravating the living environment and resulting in food limitation of L. crocea. Evidence suggests that juvenile species that deposit feed as adults are more susceptible to food limitation than conspecific adults (Hentschel Citation1998).
Pollution and overfishing contribute to decreasing fishery resources, even directly affecting the structure and stability of diverse ecosystems (Liu, Yu, and Liu Citation1991; Foo et al. Citation2021). However, intensive mariculture in Sansha Bay prevents large-scale fishing activities (Fig. S2): trawl fishing could not be operated in the inner bay, and the Guan Jing Yang protection area (spawning ground in Sansha Bay) was established for the protection of L. crocea in 1985. Other fishery control measures, e.g., fishing moratorium seasons (Liu and De Mitcheson Citation2008), are important and efficient methods to manage fishery resources. Although there is intensive cage culturing in Sansha Bay, there has never been large-scale algae blooms because of the buffer effect of macroalgal culture (Xie et al. Citation2020). The basic environmental conditions can support L. crocea; therefore, the trophic gauntlet is, potentially, the ecological issue that contributes to the unsuccessful recovery of L. crocea resources in Sansha Bay. In addition, most enclosed bays are filled with macroalgal culture in China and are important habitats for migratory fish. Hence, the phenomena of HNLC should be taken seriously, and quantifying the macroalgal culture for ecological balance must be more reasonable and scientific.
Conclusion
Intensive mariculture has created a unique environment in Sansha Bay: HNLC occurs in Sansha Bay because of the macroalgae culture, which restrains the growth of phytoplankton. The Chl a concentration in Sansha Bay is significantly lower than that in other eutrophic bays and the ECS. Phytoplankton is the important food source of zooplankton, and zooplankton is the crucial initial feed of L. crocea. Zooplankton is the important key functional group in the ecosystem of Sansha Bay, and the abundance of zooplankton is significantly lower in Sansha Bay than in the ECS. The Sansha Bay ecosystem is redundant in primary production, resulting in low ecotrophic efficiency, the poor water exchange and massive fish feed input deteriorated total transfer efficiency in Sansha Bay. The aquaculture ecosystem is still immature and unstable within the anthropogenic activities in the Ecopath model. The gut fullness index indicated that L. crocea in Sansha Bay is under starvation. Under the influence of intensive macroalgal culture and bottom-up effect, the trophic bottleneck and connectivity in the early life history of L. crocea are the potential causes of unprosperous resource recovery. This study is limited by a lack of quantifying mariculture scale for the balance between biological production and algal blooms. Multiple aquaculture sustainability assemblages should consider HNLC in future research, which is important for sustainable aquaculture production and environmental protection.
Supplemental Material
Download MS Word (4.4 MB)Acknowledgments
Thanks to Ningde Ocean and Fisheries Bureau (Shengli Zhou) for providing stock enhancement data. Thanks to the East China Fisheries Research Institute (Zhaoli Xu) for providing fishery investigation data.
Disclosure statement
No potential conflict of interest was reported by the author(s).
Supplementary material
Supplemental data for this article can be accessed here.
Additional information
Funding
References
- Ahlgren, G. 1983. “Comparison of Methods for Estimation of Phytoplankton Carbon.” Archiv Fur Hydrobiologie 98 (4): 489–14.
- Alexander, K. A., T. P. Potts, S. Freeman, D. Israel, J. Johansen, D. Kletou, … D. L. Angel. 2015. “The Implications of Aquaculture Policy and Regulation for the Development of Integrated Multi-trophic Aquaculture in Europe.” Aquaculture 443: 16–23. (English). doi:https://doi.org/10.1016/j.aquaculture.2015.03.005.
- Anneville, O., C. W. Chang, G. Dur, S. Souissi, F. Rimet, and C. H. Hsieh. 2019. “The Paradox of Re-oligotrophication: The Role of Bottom-up versus Top-down Controls on the Phytoplankton Community.” Oikos 128 (11): 1666–1677. (English). doi:https://doi.org/10.1111/oik.06399.
- Biktashev, V. N., J. Brindley, and J. W. Horwood. 2003. “Phytoplankton Blooms and Fish Recruitment Rate.” Journal of Plankton Research 25 (1): 21–33. (English). doi:https://doi.org/10.1093/plankt/25.1.21.
- Boeing, W. J., and J. T. Duffy-Anderson. 2008. “Ichthyoplankton Dynamics and Biodiversity in the Gulf of Alaska: Responses to Environmental Change.” Ecological Indicators 8 (3): 292–302. doi:https://doi.org/10.1016/j.ecolind.2007.03.002.
- Bolger, T., and P. L. Connolly. 1989. “The Selection of Suitable Indexes for the Measurement and Analysis of Fish Condition.” Journal of Fish Biology 34 (2): 171–182. doi:https://doi.org/10.1111/j.1095-8649.1989.tb03300.x.
- Bouwman, L., A. Beusen, P. M. Glibert, C. Overbeek, M. Pawlowski, J. Herrera, M. J. Zhou, R. Yu, and M. Zhou. 2013. “Mariculture: Significant and Expanding Cause of Coastal Nutrient Enrichment.” Environmental Research Letters 8 (4). doi:https://doi.org/10.1088/1748-9326/8/4/044026.
- Cai, H., L. G. Ross, T. C. Telfer, C. Wu, A. Zhu, S. Zhao, and M. Xu. 2016. “Modelling the Nitrogen Loadings from Large Yellow Croaker (Larimichthys Crocea) Cage Aquaculture.” Environmental Science and Pollution Research 23 (8): 7529–7542. doi:https://doi.org/10.1007/s11356-015-6015-0.
- Chen, J. J., and Z. L. Xu. 2012. “Analysis of Population Division and Geographical Isolation of Larimichthys Crocea in the East China Sea and Yellow Sea.” Journal of Fishery Sciences of China 19 (2): 310–320. (Chinese). doi:https://doi.org/10.3724/SP.J.1118.2012.00310.
- Cheng, F., and Z. H. Cheng. 2015. “Research Progress on the Use of Plant Allelopathy in Agriculture and the Physiological and Ecological Mechanisms of Allelopathy.” Frontiers in Plant Science 6: 1020. (English). ARTN 1020. doi:https://doi.org/10.3389/fpls.2015.01020.
- Chopin, T., J. A. Cooper, G. Reid, S. Cross, and C. Moore. 2012. “Open-water Integrated Multi-trophic Aquaculture: Environmental Biomitigation and Economic Diversification of Fed Aquaculture by Extractive Aquaculture.” Reviews in Aquaculture 4 (4): 209–220. (English). doi:https://doi.org/10.1111/j.1753-5131.2012.01074.x.
- Christensen, V., C. Walters, and D. Pauly. 2005. “Ecopath with Ecosim: A User’s Guide”. University of British Columbia, Canada
- Claudino, M. C., A. L. M. Pessanha, F. G. Araujo, and A. M. Garcia. 2015. “Trophic Connectivity and Basal Food Sources Sustaining Tropical Aquatic Consumers along a Mangrove to Ocean Gradient.” Estuarine Coastal and Shelf Science 167: 45–55. (English). doi:https://doi.org/10.1016/j.ecss.2015.07.005.
- Cloern, J. E. 2007. “Habitat Connectivity and Ecosystem Productivity: Implications from a Simple Model.” American Naturalist 169 (1): E21–E33. (English). doi:https://doi.org/10.1086/510258.
- Coll, M., E. Akoglu, F. Arreguin-Sanchez, E. A. Fulton, D. Gascuel, J. J. Heymans, … V. Christensen. 2015. “Modelling Dynamic Ecosystems: Venturing beyond Boundaries with the Ecopath Approach.” Reviews in Fish Biology and Fisheries 25 (2): 413–424. doi:https://doi.org/10.1007/s11160-015-9386-x.
- Cowen, R. K., G. Gawarkiewic, J. Pineda, S. R. Thorrold, and F. E. Werner. 2007. “Population Connectivity in Marine Systems an Overview.” Oceanography 20 (3): 14–21. doi:https://doi.org/10.5670/oceanog.2007.26.
- Cunha, M. E., H. Quental-Ferreira, A. Parejo, S. Gamito, L. Ribeiro, M. Moreira, P. Pousao-Ferreira, F. Soares, and P. Pousão-Ferreira. 2019. “Understanding the Individual Role of Fish, Oyster, Phytoplankton and Macroalgae in the Ecology of Integrated Production in Earthen Ponds.” aquaculture 512: 734297. doi:https://doi.org/10.1016/j.aquaculture.2019.734297.
- Daewel, U., M. A. Peck, and C. Schrum. 2011. “Life History Strategy and Impacts of Environmental Variability on Early Life Stages of Two Marine Fishes in the North Sea: An Individual-based Modelling Approach.” Canadian Journal of Fisheries and Aquatic Sciences 68 (3): 426–443. doi:https://doi.org/10.1139/F10-164.
- Das, K., and S. Ray. 2008. “Effect of Delay on Nutrient Cycling in Phytoplankton-zooplankton Interactions in Estuarine System.” Ecological Modelling 215 (1–3): 69–76. (English). doi:https://doi.org/10.1016/j.ecolmodel.2008.02.019.
- Deniro, M. J., and S. Epstein. 1981. “Influence of Diet on the Distribution of Nitrogen Isotopes in Animals.” Geochimica Et Cosmochimica Acta 45 (3): 341–351. doi:https://doi.org/10.1016/0016-7037(81)90244-1.
- Duan, Q. Y., K. S. Mai, H. Y. Zhong, L. G. Si, and X. Q. Wang. 2001. “Studies on the Nutrition of the Large Yellow Croaker, Pseudosciaena Crocea R. I: Growth Response to Graded Levels of Dietary Protein and Lipid.” Aquaculture Research 32: 46–52. doi:https://doi.org/10.1046/j.1355-557x.2001.00048.x.
- Fong, P., and J. B. Zedler. 1993. “Temperature and Light Effects on the Seasonal Succession of Algal Communities in Shallow Coastal Lagoons.” Journal of Experimental Marine Biology and Ecology 171 (2): 259–272. (English). doi:https://doi.org/10.1016/0022-0981(93)90008-C.
- Foo, S. A., W. J. Walsh, J. Lecky, S. Marcoux, and G. P. Asner. 2021. “Impacts of Pollution, Fishing Pressure, and Reef Rugosity on Resource Fish Biomass in West Hawaii.” Ecological Applications 31 (1). doi:https://doi.org/10.1002/eap.2213.
- Frederiksen, M., M. Edwards, A. J. Richardson, N. C. Halliday, and S. Wanless. 2006. “From Plankton to Top Predators: Bottom-up Control of a Marine Food Web across Four Trophic Levels.” Journal of Animal Ecology 75 (6): 1259–1268. (English). doi:https://doi.org/10.1111/j.1365-2656.2006.01148.x.
- Gillanders, B. M., K. W. Able, J. A. Brown, D. B. Eggleston, and P. F. Sheridan. 2003. “Evidence of Connectivity between Juvenile and Adult Habitats for Mobile Marine Fauna: An Important Component of Nurseries.” Marine Ecology Progress Series 247: 281–295. doi:https://doi.org/10.3354/meps247281.
- Han, D. Y., Y. Xue, C. L. Zhang, and Y. P. Ren. 2017. “A Mass Balanced Model of Trophic Structure and Energy Flows of A Semi-closed Marine Ecosystem.” Acta Oceanologica Sinica 36 (10): 60–69. doi:https://doi.org/10.1007/s13131-017-1071-6.
- Han, R., Q. W. Chen, L. Wang, and X. W. Tang. 2016. “Preliminary Investigation on the Changes in Trophic Structure and Energy Flow in the Yangtze Estuary and Adjacent Coastal Ecosystem Due to the Three Gorges Reservoir.” Ecological Informatics 36: 152–161. doi:https://doi.org/10.1016/j.ecoinf.2016.03.002.
- Hentschel, B. T. 1998. “Spectrofluorometric Quantification of Neutral and Polar Lipids Suggests a Food-related Recruitment Bottleneck for Juveniles of a Deposit-feeding Polychaete Population.” Limnology and Oceanography 43 (3): 543–549. (English). doi:https://doi.org/10.4319/lo.1998.43.3.0543.
- Heymans, J. J., L. Shannon, and A. J.&Jarre. 2004. “Changes in the Northern Benguela Ecosystem over Three Decades: 1970s, 1980s, and 1990s.” Ecological Modelling 172 (2–4): 175–195. doi:https://doi.org/10.1016/j.ecolmodel.2003.09.006.
- Hobson, K. A., and H. E. Welch. 1992. “Determination of Trophic Relationships within a High Arctic Marine Food Web Using Delta-C-13 and Delta-N-15 Analysis.” Marine Ecology Progress Series 84 (1): 9–18. (English). doi:https://doi.org/10.3354/meps084009.
- Huang, Y. S., L. J. Ou, and Y. F. Yang. 2017. “Nutrient Competition between Macroalgae Gracilaria Lemaneiformis and Phytoplankton in Coastal Waters of Nan’ao Island, Guangdong.” OCEANOLOGIA ET LIMNOLOGIA SINICA 48 (4): 806–813. (Chinese).
- Husa, V., T. Kutti, A. Ervik, K. Sjotun, P. K. Hansen, and J. Aure. 2014. “Regional Impact from Fin-fish Farming in an Intensive Production Area (Hardangerfjord, Norway).” Marine Biology Research 10 (3): 241–252. (English). doi:https://doi.org/10.1080/17451000.2013.810754.
- Hussy, K., M. A. StJohn, and U. Bottcher. 1997. “Food Resource Utilization by Juvenile Baltic Cod Gadus Morhua: A Mechanism Potentially Influencing Recruitment Success at the Demersal Juvenile Stage?” Marine Ecology Progress Series 155: 199–208. doi:https://doi.org/10.3354/meps155199.
- James, S. E., E. A. Pakhomov, N. Mahara, and B. P. V. Hunt. 2020. “Running the Trophic Gauntlet: Empirical Support for Reduced Foraging Success in Juvenile Salmon in Tidally Mixed Coastal Waters.” Fisheries Oceanography 29 (3): 290–295. (English). doi:https://doi.org/10.1111/fog.12471.
- Jiang, W. M., and M. T. Gibbs. 2005. “Predicting the Carrying Capacity of Bivalve Shellfish Culture Using a Steady, Linear Food Web Model.” aquaculture 244 (1–4): 171–185. doi:https://doi.org/10.1016/j.aquaculture.2004.11.050.
- Jiang, Z. B., J. J. Liu, S. L. Li, Y. Chen, P. Du, Y. L. Zhu, … J. F. Chen. 2020. “Kelp Cultivation Effectively Improves Water Quality and Regulates Phytoplankton Community in a Turbid.” Highly Eutrophic Bay. Science of the Total Environment 707. doi:https://doi.org/10.1016/j.scitotenv.2019.135561.
- Kasai, A., T. Fuji, K. W. Suzuki, and Y. Yamashita. 2018. “Partial Migration of Juvenile Temperate Seabass Lateolabrax Japonicus: A Versatile Survival Strategy.” Fisheries Science 84 (2): 153–162. doi:https://doi.org/10.1007/s12562-017-1166-1.
- Kitada, S. 2020. “Lessons from Japan Marine Stock Enhancement and Sea Ranching Programmes over 100 Years.” Reviews in Aquaculture. doi:https://doi.org/10.1111/raq.12418.
- Leloup, F. A., N. Desroy, P. Le Mao, D. Pauly, and O. Le Pape. 2008. “Interactions between a Natural Food Web, Shellfish Farming and Exotic Species: The Case of the Bay of Mont Saint Michel (France).” Estuarine Coastal and Shelf Science 76 (1): 111–120. doi:https://doi.org/10.1016/j.ecss.2007.06.011.
- Li, Y., Q. H. Ai, K. S. Mai, W. Xu, Z. Y. Cheng, and Z. G. He. 2010. “Dietary Leucine Requirement for Juvenile Large Yellow Croaker Pseudosciaena Crocea (Richardson, 1846).” Journal of Ocean University of China 9 (4): 371–375. doi:https://doi.org/10.1007/s11802-010-1770-5.
- Libralato, S., V. Christensen, and D. Pauly. 2006. “A Method for Identifying Keystone Species in Food Web Models.” Ecological Modelling 195 (3–4): 153–171. doi:https://doi.org/10.1016/j.ecolmodel.2005.11.029.
- Lin, H. J., X. X. Dai, K. T. Shao, H. M. Su, W. T. Lo, H. L. Hsieh, … J. J. Hung. 2006. “Trophic Structure and Functioning in a Eutrophic and Poorly Flushed Lagoon in Southwestern Taiwan.” Marine Environmental Research 62 (1): 61–82. doi:https://doi.org/10.1016/j.marenvres.2006.03.003.
- Lin, H. Y., Z. Z. Chen, J. Y. Hu, A. Cucco, J. Zhu, Z. Y. Sun, and L. F. Huang. 2017. “Numerical Simulation of the Hydrodynamics and Water Exchange in Sansha Bay.” Ocean Engineering 139: 85–94. (English). doi:https://doi.org/10.1016/j.oceaneng.2017.04.031.
- Lin, H. Y., Z. Z. Chen, J. Y. Hu, A. Cucco, Z. Y. Sun, X. R. Chen, and L. F. Huang. 2019. “Impact of Cage Aquaculture on Water Exchange in Sansha Bay.” Continental Shelf Research 188. doi:https://doi.org/10.1016/j.csr.2019.103963.
- Lindeman, R. L. 1942. “The Trophic-dynamic Aspect of Ecology.” Ecology 23 (4): 399–417. doi:https://doi.org/10.2307/1930126.
- Liu, M., and Y. S. De Mitcheson. 2008. “Profile of a Fishery Collapse: Why Mariculture Failed to Save the Large Yellow Croaker.” Fish and Fisheries 9 (3): 219–242. doi:https://doi.org/10.1111/j.1467-2979.2008.00278.x.
- Liu, P. Z., Y. Q. Yu, and C. Y. Liu. 1991. “Studies on the Situation of Pollution and Countermeasures of Control of the Oceanic Environment in Zhoushan Fishing Ground - the Largest Fishing Ground in China.” Marine Pollution Bulletin 23: 281–288. (English). doi:https://doi.org/10.1016/0025-326x(91)90688-O.
- Lopez, B. D., M. Bunke, and J. A. B. Shirai. 2008. “Marine Aquaculture off Sardinia Island (Italy): Ecosystem Effects Evaluated through a Trophic Mass-balance Model.” Ecological Modelling 212 (3–4): 292–303. doi:https://doi.org/10.1016/j.ecolmodel.2007.10.028.
- Lurling, M., G. Van Geest, and M. Scheffer. 2006. “Importance of Nutrient Competition and Allelopathic Effects in Suppression of the Green Alga Scenedesmus Obliquus by the Macrophytes Chara, Elodea and Myriophyllum.” Hydrobiologia 556: 209–220. (English). doi:https://doi.org/10.1007/s10750-005-1168-3.
- Mao, Y. Z., J. Q. Li, S. Y. Xue, F. Lan, Z. J. Jiang, J. G. Fang, and Q. S. Tang. 2018. “Ecological Functions of the Kelp Saccharina Japonica in Integrated Multi-trophic Aquaculture, Sanggou Bay, China.” ACTA ECOLOGICA SINICA 38 (9): 3230–3237. (Chinese).
- Matsuzaki, S. S., K. Suzuki, T. Kadoya, M. Nakagawa, and N. Takamura. 2018. “Bottom-up Linkages between Primary Production, Zooplankton, and Fish in a Shallow, Hypereutrophic Lake.” Ecology 99 (9): 2025–2036. (English). doi:https://doi.org/10.1002/ecy.2414.
- McKinnell, S., E. Curchitser, K. Groot, M. Kaeriyama, and M. Trudel. 2014. “Oceanic and Atmospheric Extremes Motivate a New Hypothesis for Variable Marine Survival of Fraser River Sockeye Salmon.” Fisheries Oceanography 23 (4): 322–341. (English). doi:https://doi.org/10.1111/fog.12063.
- McMeans, B. C., K. S. McCann, T. D. Tunney, A. T. Fisk, A. M. Muir, N. Lester, N. Rooney, and N. Rooney. 2016. “The Adaptive Capacity of Lake Food Webs: From Individuals to Ecosystems.” Ecological Monographs 86 (1): 4–19. doi:https://doi.org/10.1890/15-0288.1.
- Morissete, L., M. O. Hammill, and C. Savenkoff. 2006. “The Trophic Role of Marine Mammals in the Northern Gulf of St. Lawrence.” Marine Mammal Science 22 (1): 74–103. (English). doi:https://doi.org/10.1111/j.1748-7692.2006.00007.x.
- Mulderij, G., A. J. P. Smolders, and E. Van Donk. 2006. “Allelopathic Effect of the Aquatic Macrophyte, Stratiotes Aloides, on Natural Phytoplankton.” Freshwater Biology 51 (3): 554–561. doi:https://doi.org/10.1111/j.1365-2427.2006.01510.x.
- Murawski, S. 2007. “Size Matters, Sometimes.” Nature 450 (7171): 794-794. doi:https://doi.org/10.1038/450794a.
- Navarro, J., M. Coll, M. Louzao, I. Palomera, A. Delgado, and M. G. Forero. 2011. “Comparison of Ecosystem Modelling and Isotopic Approach as Ecological Tools to Investigate Food Webs in the NW Mediterranean Sea.” Journal of Experimental Marine Biology and Ecology 401 (1–2): 97–104. (English). doi:https://doi.org/10.1016/j.jembe.2011.02.040.
- Odum, E. P. 1969. “The Strategy of Ecosystem Development.” Science 105: 262–270. doi:https://doi.org/10.1126/science.164.3877.262.
- Pauly, D., and V. Christensen. 1993. “Stratified Models of Large Marine Ecosystems: A General Approach and an Application to the South China Sea.” Large Marine Ecosystems: Stress, Mitigation and Sustainability. AAAS Press, Washington, DC
- Pauly, D., V. Christensen, J. Dalsgaard, R. Froese, and F. Torres. 1998. “Fishing down Marine Food Webs.” Science 279 (5352): 860–863. doi:https://doi.org/10.1126/science.279.5352.860.
- Pershing, A. J., C. H. Greene, J. W. Jossi, L. O’Brien, J. K. T. Brodziak, and B. A. Bailey. 2005. “Interdecadal Variability in the Gulf of Maine Zooplankton Community, with Potential Impacts on Fish Recruitment.” Ices Journal of Marine Science 62 (7): 1511–1523. doi:https://doi.org/10.1016/j.icesjms.2005.04.025.
- Pipitone, C., F. Badalamenti, G. D’Anna, and B. Patti. 2000. “Fish Biomass Increase after a Four-year Trawl Ban in the Gulf of Castellammare (NW Sicily, Mediterranean Sea).” Fisheries Research 48 (1): 23–30. doi:https://doi.org/10.1016/S0165-7836(00)00114-4.
- Platt, T., W. G. Harrison, M. R. Lewis, W. K. W. Li, S. Sathyendranath, R. E. Smith, and A. F. Vezina. 1989. “Biological Production of the Oceans - the Case for a Consensus.” Marine Ecology Progress Series 52 (1): 77–88. (English). doi:https://doi.org/10.3354/meps052077.
- Post, D. M. 2002. “Using Stable Isotopes to Estimate Trophic Position: Models, Methods, and Assumptions.” Ecology 83 (3): 703–718. (English). doi:https://doi.org/10.1890/0012-9658(2002)083[0703:Usitet]2.0.Co;2.
- Post, D. M., C. A. Layman, D. A. Arrington, G. Takimoto, J. Quattrochi, and C. G. Montana. 2007. “Getting to the Fat of the Matter: Models, Methods and Assumptions for Dealing with Lipids in Stable Isotope Analyses.” Oecologia 152 (1): 179–189. doi:https://doi.org/10.1007/s00442-006-0630-x.
- Scieszka, S., and E. Klewicka. 2019. “Algae in Food: A General Review.” Critical Reviews in Food Science and Nutrition 59 (21): 3538–3547. doi:https://doi.org/10.1080/10408398.2018.1496319.
- Shao, L., X. L. Xing, J. Zhou, and A. L. Shen. 2018. “Ecological Effects of the Caged-fish and Kelp Cultures in Semi-enclosed Bay: Evidence from Diatom Assemblages and Environmental Variables.” Indian Journal of Geo-Marine Sciences 47 (2): 325–335. (English).
- Sheaves, M. 2009. “Consequences of Ecological Connectivity: The Coastal Ecosystem Mosaic.” Marine Ecology Progress Series 391: 107–115. (English). doi:https://doi.org/10.3354/meps08121.
- Steenbeek, J., X. Corrales, M. Platts, and M. Coll. 2018. “Ecosampler: A New Approach to Assessing Parameter Uncertainty in Ecopath with Ecosim.” SoftwareX 7: 198–204. doi:https://doi.org/10.1016/j.softx.2018.06.004.
- Stock, B. C., and B. X. Semmens. (2016). MixSIAR GUI User Manual. Version 3.1. https://github.com/brianstock/MixSIAR
- Sun, L. Q., H. Liu, Y. P. Gao, Z. J. Jiang, F. Lin, L. R. Chang, and Y. T. Zhang. 2020. “Food Web Structure and Ecosystem Attributes of Integrated Multi-trophic Aquaculture Waters in Sanggou Bay.” Aquaculture Reports 16: ARTN 100279. doi:https://doi.org/10.1016/j.aqrep.2020.100279.
- Taylor, P. D., L. Fahrig, K. Henein, and G. Merriam. 1993. “Connectivity Is a Vital Element of Landscape Structure.” Oikos 68 (3): 571–573. (English). doi:https://doi.org/10.2307/3544927.
- Tieszen, L. L., T. W. Boutton, K. G. Tesdahl, and N. A. Slade. 1983. “Fractionation and Turnover of Stable Carbon Isotopes in Animal-Tissues - Implications for Delta-C-13 Analysis of Diet.” Oecologia 57 (1–2): 32–37. (English). doi:https://doi.org/10.1007/Bf00379558.
- Troell, M., C. Halling, A. Neori, T. Chopin, A. H. Buschmann, N. Kautsky, and C. Yarish. 2003. “Integrated Mariculture: Asking the Right Questions.” Aquaculture 226 (1–4): 69–90. (English). doi:https://doi.org/10.1016/S0044-8486(03)00469-1.
- Wang, F., W. Nishijima, Y. Uchida, A. Umehara, S. Nakai, K. Kasamo, and Y. Shiraki. 2020. “Impact of Eelgrass Bed Recovery and Expansion on Phytoplankton Growth through Nutrient Competition.” Journal of Environmental Management 260: 109898. doi:https://doi.org/10.1016/j.jenvman.2019.109898.
- Watanabe, Y., T. Kawamura, and Y. Yamashita. 2018. “Introduction: The Coastal Ecosystem Complex as a Unit of Structure and Function of Biological Productivity in Coastal Areas.” Fisheries Science 84 (2): 149–152. doi:https://doi.org/10.1007/s12562-018-1176-7.
- Wei, Z. L., J. G. You, H. L. Wu, F. F. Yang, L. J. Long, Q. Liu, P. M. He, and P. He. 2017. “Bioremediation Using Gracilaria Lemaneiformis to Manage the Nitrogen and Phosphorous Balance in an Integrated Multi-trophic Aquaculture System in Yantian Bay, China.” Marine Pollution Bulletin 121 (1–2): 313–319. doi:https://doi.org/10.1016/j.marpolbul.2017.04.034.
- Wilk-Woźniak, E., A. Pociecha, and H. Bucka. 2001. “Phytoplankton-zooplankton Interactions, Size Relations and Adaptive Responses. A Short Review.” Ecohydrology and Hydrobiology 1 (4): 511–517.
- Wu, H. Y., K. L. Chen, Z. H. Chen, Q. H. Chen, Y. P. Qiu, J. C. Wu, and J. F. Zhang. 2012. “Evaluation for the Ecological Quality Status of Coastal Waters in East China Sea Using Fuzzy Integrated Assessment Method.” Marine Pollution Bulletin 64 (3): 546–555. (English). doi:https://doi.org/10.1016/j.marpolbul.2011.12.022.
- Wu, Z. X., X. M. Zhang, H. M. Lozano-Montes, and N. R. Loneragan. 2016. “Trophic Flows, Kelp Culture and Fisheries in the Marine Ecosystem of an Artificial Reef Zone in the Yellow Sea.” Estuarine Coastal and Shelf Science 182: 86–97. doi:https://doi.org/10.1016/j.ecss.2016.08.021.
- Xie, B., J. J. Huang, C. Huang, Y. Wang, S. Y. Shi, and L. F. Huang. 2020. “Stable Isotopic Signatures (δ13C and δ15N) of Suspended Particulate Organic Matter as Indicators for Fish Cage Culture Pollution in Sansha Bay, China.” Aquaculture, 522: 735081
- Xing, Q. G., C. M. Hu, D. L. Tang, L. Q. Tian, S. L. Tang, X. H. Wang, X. L. Gao, and X. Gao. 2015. “World’s Largest Macroalgal Blooms Altered Phytoplankton Biomass in Summer in the Yellow Sea: Satellite Observations.” Remote Sensing 7 (9): 12297–12313. (English). doi:https://doi.org/10.3390/rs70912297.
- Xiong, Y., J. Yang, T. Jiang, H. B. Liu, X. M. Zhong, and J. H. Tang. 2017. “Early Life History of the Small Yellow Croaker (Larimichthys Polyactis) in Sandy Ridges of the South Yellow Sea.” Marine Biology Research 13 (9): 993–1002. doi:https://doi.org/10.1080/17451000.2017.1319067.
- Xu, J. Y., J. J. Chen, F. G. Tian, and Z. L. Xu. 2012. “Summer Diet Composition and Feeding Ecology of Large Yellow Croaker (Larimichthys Crocea) in Guanjing Yang.” Journal of Fishery Sciences of China 19 (1): 94–104. (Chinese). doi:https://doi.org/10.3724/SP.J.1118.2012.00094.
- Xu, M., L. Qi, L. B. Zhang, T. Zhang, H. S. Yang, and Y. L. Zhang. 2019. “Ecosystem Attributes of Trophic Models before and after Construction of Artificial Oyster Reefs Using Ecopath.” Aquaculture Environment Interactions 11: 111–127. doi:https://doi.org/10.3354/aei00284.
- Yoon, J. E., J. H. Lim, S. Son, S. H. Youn, H. J. Oh, J. D. Hwang, I. N. Kim, -S.-S. Kim, and I.-N. Kim. 2019. “Assessment of Satellite-Based Chlorophyll-a Algorithms in Eutrophic Korean Coastal Waters: Jinhae Bay Case Study.” Frontiers in Marine Science 6. doi:https://doi.org/10.3389/fmars.2019.00359.