
ABSTRACT
This study aims to develop and evaluate the indicators of Sustainable Development Goals (hereafter SDGs) for local governments in Gyeonggi Province, South Korea from the perspective of the glocal mainstreaming of SDGs and localization. Through surveys and focus group meetings, 35 SDGs indicators that are to be implemented by both the Gyeonggi Provincial government and 31 separate local governments were selected and an overall index was calculated by standardizing 27 indicators. Through the comparative analysis of the fuzzy-set, this paper revealed the four ideal types along with the arrangement of two variables, the socio-economic SDGs index (S) and the environmental SDGs index (E), which are derived from 31 local governments. In short, some examples of this arrangement are the Type 1 (S*E: “sustainable local gov.”) including Hanam City (fuzzy score, 0.729); Type 2 (S*e: “imbalanced local gov.(I)”) including Hwaseong City (0.862); Type 3 (s*E: “imbalanced local gov.(II)”) including Gapyeong County (0.922); and Type 4 (s*e: “unsustainable local gov.”) including Pyeongtaek City (0.650). As a result, this paper suggests policy priority should be placed on the local governments of Type 4 where all three dimensions of sustainable development pose challenges. Furthermore, it is important for Type 2 and Type 3 to enhance policy coherence for sustainability.
Introduction
More than three decades ago, the international community began to shift the values toward the future. The concept of sustainable development was first introduced through “Our Common Future” published by the World Commission on Environment and Development in 1987. Sustainable development is now used as a universal value and provides the direction for human society to pursue the balance of economy, society and environment. Thereafter, in 2015, nations around the world undertook another bold challenge. At the 70th UN General Assembly, 17 Sustainable Development Goals (SDGs) and 169 targets were defined as the common objective for the global community suffering from polarization, social conflict and climate change. Every nation worked actively and profusely to achieve this goal (UCLG Citation2018; UN Citation2016).
It is no exaggeration to say that these SDGs were also adopted by cities as well. The level of execution at the city level is very important because half of the world’s population resides in cities and two-thirds of the world’s economic activities are taking place in them. In particular, it is important to pay attention to the role of local(city) governments since the success of SDGs will grow even more if local(city) governments have sufficient authority and capacity (GRI Citation2017a; KEI Citation2017).
In fact, local governments have played an important role in establishing SDGs; and as a result, SDG Goal 11 “Sustainable Cities and Communities” was set as an independent goal to provide an opportunity for the international community to recognize the role of local/metropolitan governments in promoting sustainable development. It is true that in most countries, much of the national SDGs are under the responsibility of local governments. Given this importance, local governments should not simply implement national and global SDGs, but rather partner in creating policies and practical measures together as well as implementing and monitoring the goals and targets (KDI Citation2018; UCLG Citation2015).
This study attempts to establish and evaluate the SDG indicators for local governments particularly in the case of Gyeonggi Province in South Korea with the perspective of mainstreaming and localization of the global SDGs. Local governments have significant authority and take the initiative in implementing the regional SDGs. Just as national governments alone cannot achieve the goals of the 2030 Agenda without the engagement of local and regional governments, the same issue arises between upper governments and lower governments at the sub-national level.
In this context, this paper explores the following research question:s
How do the results of the evaluation of the selected local SDG indicators appear for each local government? What are the characteristics of sustainability in different local governments?
What are the policy implications of localized SDG indicator framework to facilitate vertical coordination between provincial government and local governments as well as mainstreaming sustainable development?
For this purpose, the Gyeonggi-do SDGs were reviewed through surveys and focus group meetings to select headline indicators that Gyeonggi provincial government and local governments should promote together. Secondly, the statistical data for the indicators were obtained to measure where cities and counties stand on the SDGs vis- à-vis their peers and the regional average.
This paper consists of five sections. Section 2 covers the mainstreaming and localization of SDGs, and the theoretical background and issues concerning the SDGs monitoring and indicator framework. Section 3 describes the method of developing and selecting the local SDGs. Section 4 presents the main analysis results for each city/county of Gyeonggi Province. Lastly, section 5 concludes with the significance and policy implications for localizing SDGs based on the case study of Gyeonggi Province.
Theoretical issue and background
Mainstreaming of SDGs, localization, and the roles of local governments
The UN’s Post-2015 Development Agenda is a new development goal to be pursued by the international community over the next 15 years by 2030 on behalf of the Millennium Development Goals(hereafter MDGs) which ended in 2015. The SDGs are a part of the Post-2015 Development agenda. The SDGs emphasize that sustainable development should be mainstreaming throughout the UN system and become a driver for its implementation, while focusing on priority areas to bring about sustainable development (UCLG Citation2018; UN Citation2016).
In particular, at the Third International Conference on Financing for Development, which was held in Addis Ababa in 2015, the emphasis was placed by the international community on regional cooperation for the implementation of SDGs as well as the participation of local governments for the localization of SDGs and their role as the principal actors for international development cooperation. According to the eleventh goal of SDGs which is the “Sustainable Cities and Communities” (Make cities and human settlements inclusive, safe, resilient and sustainable), it emphasizes the influence and its role of local government as the main actor of SDGs. Here the process of localization of SDGs refers to which local governments establish and implement policies to achieve the goals (SDGs) that are suitable for national and sub-national properties (UN Citation2016; Patole Citation2018).
Previously in the case of MDGs, which were set in a top-down approach by the United Nations Office, there were great limitations in the implementation, evaluation, and monitoring processes. The main reason for this was the failure to take into account the practical capabilities, data collection and management status of local governments (Patole Citation2018; Poku and Whitman Citation2011). In particular, the lack of regional data and indicator systems for implementation and performance evaluation was a major setback (Poku and Whitman Citation2011; SDSN Citation2015). Against this backdrop, the UN issued the SDGs in 2015, reiterating that the achievement of new global goals depends on how responsible each country is for its own economic and social development. Moreover, the UNDP and World Bank issued a report reminding the local governments and communities that voluntary participation is essential to achieve the SDGs (UNDP Citation2016a, Citation2016b).
Specifically, the concept of localization is directed toward a multi-layered, multi-directional governance system where international organizations, regional organizations, central governments, local governments and communities organically cooperate to implement the internationally agreed SDGs (KDI Citation2018; SDSN Citation2016). In other words, as a key actor in implementing SDGs, the local government is standing at the front, setting goals and targets for the regional units, establishing means of implementation, and evaluating and monitoring them (UNDP GTF Citation2016, Citation2018). In this process, the central government works closely with the international organizations to set the overall direction and to coordinate functions between local governments.
The localization of SDGs means the process of considering the regional contexts in achieving the 2030 Agenda, from setting the goals and targets to determining the means of implementation and using indicators to measure and monitor the process of implementation (UCLG Citation2018; GRI Citation2018). This process involves local/metropolitan governments supporting SDGs implementation through bottom-up actions. At the same time, SDGs are related to all top-down methods that provide a framework for regional development policies. In particular, local governments engage key regional stakeholders in SDGs planning and monitoring, create global partnerships at home and abroad, and deliver information to spread awareness (GRI Citation2018; UNDESA Citation2013). In addition, the local governments try to reflect the local needs and interests in the national SDGs strategy and have a significant role in implementing them (UNDP Citation2016a).
Meanwhile, another important reason for local governments to participate as key actors in implementing SDGs can be found in the various public functions that local governments operate. In all countries with local autonomy, local governments perform various public functions such as regional planning and regulations, provision of public services, and investment in infrastructure, repair and maintenance. Above all, as urban population increases, the demand for public services and infrastructure also increases creating a gap between the supply and demand. In order to reduce this gap, only the local government can conduct certain functions such as systematic urban planning and consequential expansion of resources as well as public investment, monitoring and public service management. In fact, local governments account for one-third of public spending in high-income countries by OECD standards and more than 50% in public investment (UCLG Citation2015; OECD Citation2015).
Monitoring system of SDGs and the indicator framework
SDGs emphasize inter-correlations among indicators, and many of the objectives are related to monitoring more than just one goal, as progressions in certain goals and targets will depend on various areas (UNDP GTF Citation2016; GRI Citation2018). Most of all, SDGs would like to ensure high-quality data by making annual reporting mandatory for all countries. It has been around 5 years after the SDGs system has been launched, and each government around the world has developed and implemented SDGs implementation plans that meet their own circumstances. Korea organized the K-SDGs (Korean-style SDGs) task force led by the Ministry of Environment to establish a master plan for implementing SDGs that will conform to the Korean environment and reported its results to the UN High Level Political Forum (hereafter HLPF) during the second half of 2019.
Follow-up measures and reviews of sustainable development goals at the global level are being conducted around the HLPF. The HLPF serves as a UN-led platform to check SDGs and its implementations. It has meetings every 4 years presided over by the UN General Assembly and holds conferences with ministers from each country every year under the auspices of the Economic and Social Council (ECOSOC) to examine their implementation (SDSN Citation2016; UNDP GTF Citation2018).
On the other hand, regards to the development and selection of indicators to monitor, the 46th UN Statistics Council in 2015 worked to modify and refine indicators by creating an SDGs indicators expert group (IAEG-SDGs: the Inter-agility and Expert Group on SDG Indicators) to develop and support the development and implementation of the Global Sustainable Development 2030 Agenda goals and targets. As a result, the global indicator framework consisting of 17 goals, 169 targets and 232 unique indicators (244 in total) was agreed upon at the 48th UN Statistical Commission in March 2017 and was later adopted by the General Assembly on 6 July 2017. The framework currently includes 231 unique SDG indicators (247 in total with 12 repeated indicators) after annual refinements and changes from the 2020 Comprehensive Review. Global indicators are utilized to examine the implementation of UN Sustainable Development goals and targets; and therefore, developing indicators that can be monitored and reported as well as establishing statistics to support them are considered to be important challenges (UNDP GTF Citation2018; GRI Citation2018).
These SDG indicators are further divided into three levels depending on the establishment of measuring methodology and the availability of the data. As of December 2020, there are 130 indicators in Tier 1, 97 indicators in Tier 2, and 4 indicators that have multiple tiers. To be more specific, Tier 1 indicators are conceptually clear, have an internationally established methodology and standards that are easily available, and the data are regularly produced by countries. Tier 2 indicators are conceptually clear, have an internationally established methodology and standards are available, but data are not regularly produced by countries. Tier 3 indicators have no internationally established methodology and standards but are being developed or tested.Footnote1
As a result, monitoring and evaluation procedure that can track implementation and ensure accountability would be the most important thing to achieve SDGs, which require strengthening regional capabilities such as governance and building the statistical database (SDSN Citation2016; UNDP GTF Citation2018).
Localization of SDGs development and measurement: the case of Gyeonggi Province
Background of development of Gyeonggi-do SDG indicators
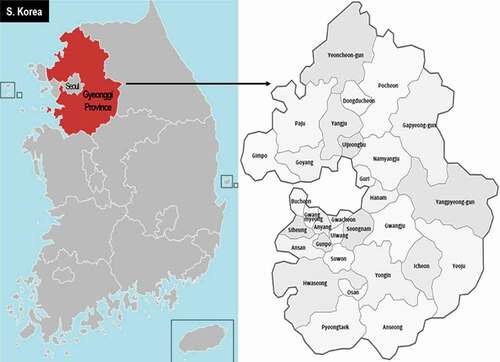
Gyeonggi Province is composed of 31 local governments with a population of about 13.24 million and a gross regional domestic product of 474 trillion won, the largest among 17 Korean regional governments (see ) (Statistics Korea Citation2018). Located in the Seoul metropolitan area, about a quarter of the nation’s population and economic activities are concentrated in this area and is equipped with excellent physical and human infrastructure such as knowledge service industry base, transportation and telecommunication network, research institutions, and universities. However, as regulations for environmental protection and military purposes are in place, there exist potential conflicts over development and environment, which leads to disproportionate development and quality of life gaps between areas (GRI Citation2017b, Citation2013; Lee and Kwon Citation2010). Due to rapid population growth and economic growth, energy consumption as well as environmental and resource utilization are continuously increasing, while forests and green space decrease, resulting in the highest greenhouse gas emissions in the country. The ecological footprint per capita has increased from 4.09 gha in 2011 to 4.24 gha in 2017 (Gyeonggi-do Council for Sustainable Development Citation2019).
Figure 1. Map of local (City/County) governments in Gyeonggi Province
Gyeonggi Province has been making efforts for sustainable development since the establishment of an organization to promote the Local Agenda 21 in 1999. Even though it has rich public-private governance experience and competence, mainstreaming of sustainable development in administration is still an overarching challenge. In 2011, therefore, the organization for Local Agenda 21(Gyeonggi-do Council for Sustainable Development) convened various stakeholders to develop the framework to monitor and assess the sustainability of Gyeonggi Province. Sixty-four indicators were selected and the results of the pilot assessment were presented at the Rio+20 conference in 2012. In 2013, to overcome the limitation of quantitative assessment by statistics, a qualitative evaluation using a questionnaire was also conducted (CNR Korea Citation2013).
These efforts led to the enactment of the [Gyeonggi-do Sustainable Development Ordinance] in September 2013, which, for the first time in Korea, stipulates the responsibilities of the governor to develop, evaluate, and report sustainable development indicators. In accordance with the institutionalization of the sustainability assessment, the framework with 6 goals, 17 strategies and 61 indicators were formulated after revision in 2014 (GRI Citation2014).
The adoption of the 2030 Agenda for Sustainable Development by all United Nations Member States in 2015 marked a turning point in Gyeonggi-do’s sustainability assessment system. Beginning with understanding and learning about the UN SDGs in 2016, the public debate process to localize SDGs for Gyeonggi Province began from 2017. In particular, much discussion was made on the relationship between the previously created framework for sustainability assessment and SDGs to be developed. Stakeholders agreed to follow the global standard UN SDGs but to fully utilize the existing indicators or indices to reflect the needs and context of the region (GRI Citation2017a; Citation2018).
The Gyeonggi-do Council for Sustainable Development organized workshops, meetings, discussion sessions, online surveys, and public hearings over a year in order to engage a broad participation of various stakeholders in the process in which residents, experts, civic groups, the Local Councils for Sustainable Development, and the administrative departments presented their opinions (GRI Citation2017a). In the first half of 2018 a pilot evaluation of Gyeonggi-do SDGs indicators was conducted to review their measurability, sustainability and relevance to the policy (GRI Citation2018). Some targets and indicators were modified to finally establish the Gyeonggi-do SDGs consisting of 17 goals, 68 targets and 138 indicators, which were declared jointly by the public and private sectors in January 2019(see )
Table 1. Progress of Gyeonggi-do SDGs development
Assessing SDGs of Local Governments in Gyeonggi Province
Selection process of headline targets and indicators for local governments
The mainstreaming of the Gyeonggi-do SDGs implementation requires vertical policy integration within 31 local governments along with horizontal policy integration among sectors (Lafferty and Hovden Citation2003; Tosun and Leininger Citation2017; Kok and Coninck Citation2007). When implementing the Gyeonggi-do SDGs, the local governments play a pivotal role as an informant to link the SDGs with local communities as well as a communicator to engage stakeholders across sectors and entities and to increase awareness of the citizens (UCLG Citation2015; UNDP GTF Citation2016; Spitz, van Ewijk, and Kamphof Citation2016).
The SDGs targets and indicators serve as a milestone for policy cooperation between Gyeonggi provincial government and 31 local governments toward sustainable development. Accordingly, core targets and indicators that they should jointly implement were selected. A set of headline indicators are useful as a monitoring tool to track and explain progress of SDGs at the regional and local level and provide a reference framework to identify priorities for policy action (Pinter, Hardi, and Bartelmus Citation2005; Lafortune et al. Citation2020; Perić, Hofmarcher, and Simon Citation2018). The shared SDGs indicators also promote mutual learning and accountability by allowing municipalities to compare performance with each other.
The selection of headline indicators was made through a three-step process. First, we identified high-priority goals based on the survey conducted on four groups: 1,000 residents, 214 civil servants, 39 experts, and 39 members from the Gyeonggi-do Council for Sustainable Development.Footnote2 All groups put high priority on Goal 8(Decent Work and Economic Growth) and Goal 11(Sustainable Cities and Communities). In addition, Goal 16, Goal 3, Goal 12, and Goal 13 were considered to be of high importance. These goals were weighted when selecting the headline indicators.
Secondly, the priorities of the 68 targets were investigated by the experts and members of the Council for Sustainable Development who participated in the process of establishing Gyeonggi-do SDGs. They scored 68 targets on a 5-point scale and ranked them in the order of highest average.
Lastly, the focus group meetings were held to discuss the outcomes of the target priority survey and to select the headline indicators. Focus groups were divided into three groups: environment (Goal 6, 7, 13, 14, 15), society (Goal 1, 3, 4, 5, 10), and economy and cities (Goal 2, 8, 9, 11, 12), and Goal 16 and 17 were reviewed in common among all the three groups. Representation, impact, and policy relevance of the key issues of sustainable development defined by each sector were considered as criteria for selecting indicators. The measurability for the local governments was also reviewed. Goal 14 among 17 goals was excluded as it was specific for only some coastal areas. Some indicators for which local statistics were not available were modified accordingly to the local features. As a result, 35 targets and indicators were selected, which showed that Goal 11 had the most indicators (five) as it was of high priority in all groups, followed by Goal 8 and Goal 3 with each three indicators.
Data and research methods
The 35 headline indicators include four qualitative indicators that do not currently have data in place and therefore need to be monitored in the future, as well as two quantitative indicators that require standard monitoring criteria. Data for 29 indicators were obtained, but the overall SDGs index was measured by normalizing the 27 indicators. Two indicators were excluded from the analysis due to excessive deviations among municipalities that might cause distortion to the results (see ). Most of the indicators are based on a single year of data from 2017 or 2018. Previous years data were utilized for some indicators.
Table 2. 35 headline SDGs targets and indicators for local governments
In this research, analysis was conducted in two stages. The first stage was a normalization process. Twenty-seven indicators were indexed to analyze the rankings by municipalities. Using the Max-Min method of scaling through polar values of data, the values of each indicator were normalized. The Max-min method is not affected by the dispersion of the data and therefore has the advantage of reducing the data distortion. The minimum value of the data is 0 and the maximum value is 1, which means the normalized values are distributed between 0 and 1. Assuming that the weighting of the 27 indicators are equal, the overall index was derived by adding the normalized scores for every indicator and then calculating the simple average.
Based on the development of the 27 indicators and index, this study utilized the fuzzy-set ideal-type analysis method (STATA (software for statistics and data science) version 16.0 used), in order to derive complex comparisons and implications beyond a simple comparison of index results by local government. Fuzzy set analysis is based on Qualitative Comparative Analysis (QCA), which is characterized by a mixed (qualitative and quantitative) research methodology and provides a special method of case studies (Ragin and Pennings Citation2005; Schneider and Rohlfing Citation2016). Based on the set theory, the difference in degree as well as partial membership is shown through the utilization of fuzzy sets with various fuzzy membership scores between 0 and 1(Ragin Citation2000, Citation2008). This study shows how close the analysis targets (31 local governments in Gyeonggi Province) are to the concept of an ideal type converted to a fuzzy set by applying the set theory through the result of the fuzzy membership score [34, 35, 36, 37]. It analyzes the degree of belonging to each ideal type by converting the original (index) values into the fuzzy set membership score (Ragin Citation2000, Citation2008; Kvist Citation1999).
The criterion for interpreting the membership score of the fuzzy-set ideal-type analysis is derived from the theory proposed by Ragin (Citation2000, Citation2008). In particular, as this study converted the scores into a fuzzy-set score system through the STATA 16.0 program’s calibration function, this paper has measured them according to three qualitative anchors: “fully in,” “fully out,” and “crossover point” as in the degree of the two (Katz, Anheier, and Lam Citation2006). In other words, any score that is above the crossover point (0.5) is given a strong membership (in the case the degree of full membership the given value possesses (FI: fully in or full membership) is higher than 95%(0.95)). Any score below the crossover point is given a low membership score(in the case the degree of full membership is not present (FO: fully out or full non-membership) is lower than 5% (0.05)) (Ragin Citation2000; Katz, Anheier, and Lam Citation2006).
The formula for calculating the Degree of Membership Score in the fuzzy-set ideal-type analysis is as follows:
Degree of Membership = exp(log odds)/(1+ exp(log odds)
Findings
Results of the overall index of local governments SDGs
According to the overall index analysis, shown in , Hanam City ranked the highest with 0.64 points, followed by Seongnam City (0.62), Osan City (0.60), Kwangju City (0.59) and Gunpo City (0.58). On the contrary, Pyeongtaek City had the lowest overall index of 0.41 points, followed by Yeoju City, Yeoncheon County, Gimpo City and Hwaseong City. Eight of the top ten cities are located in southern regions of Gyeonggi Province, while Seongnam City, Bucheon City, Anyang City and Suwon City are big cities with a population of more than half a million.
Figure 2. The overall SDG index score of local governments
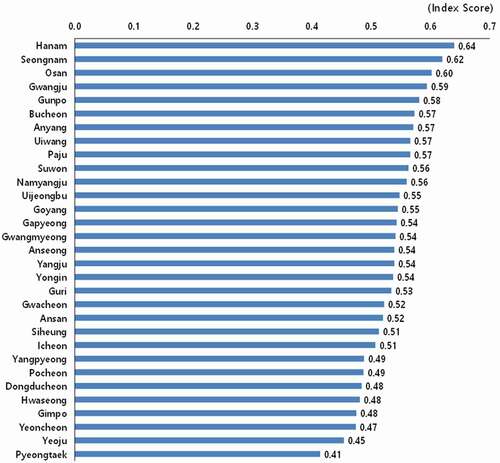
Among top 10 cities only Gwangju City and Paju City are not located in the southern regions. The bottom ten cities include Siheung City, Hwaseong City, Pyeongtaek City as well as eastern and northern areas of Gyeonggi Province, which are industrial cities or are underdeveloped due to regulations for environmental protection or military purpose.
Hanam City, a city with a population of 270,000, has the highest overall index with many indicators in social-economic sectors such as relative poverty rate, depression rate, ratio of temporary jobs, employment rate, income deciles distribution ratio, number of child abuse cases, ratio of public housing, crime rate per 1,000 person, and integrity of public institutions ranking all above average. However, health checkup rate, ratio of resident participation budget, number of community support projects, number of social economy employees, and the ratio of renewable energy generation ranked low.
Seongnam City, as a large city with a population of 940,000, differed from Hanam City by ranking high in terms of the number of social economy employees, resident participation budget, the exceedance rate of fine dust standard, share of public transportation, and number of community support projects. Moreover, most indicators were above the median except for the income deciles distribution ratio, recycle rate of municipal wastes, the amount of greenhouse gas emissions, the ratio of renewable energy generation, and the ratio of impervious area.
Meanwhile, Pyeongtaek City, an industrial city with a population of 510,000, ranks the lowest and most of the indicators were in the middle and lower range, except for the integrity of public institutions and health checkup rate. Employment and income-related indicators were relatively good (upper middle rank), but the indicators of nature conservation area, exceedance rate of fine dust standards, and traffic safety ranked the lowest. Furthermore, the amount of chemical substance emissions, amount of greenhouse gas emissions, the crime rate per 1,000 people, energy use per person, and depression rate were among the lowest range.
Yeoju City, which ranks second to last, is a city with a population of 110,000 located in the eastern region of Gyeonggi Province where development is restricted by environmental regulations to protect the water sources. Most of the indicators, except for the six indicators of ratio of environmental disease patients, ratio of impervious area, recycle rate of municipal waste, ratio of renewable energy generation, traffic safety indicator, and number of special education teachers, were among the middle-low and low range. The indicators related to many socio-economic sectors, such as income deciles distribution ratio, participation rate in life-long learning, health checkup rate, ratio of public housing, number of child abuse cases, and relative poverty rate were quite low making the city rank as one of the lowest overall in the index.
Types and characteristics of local governments by SDGs index
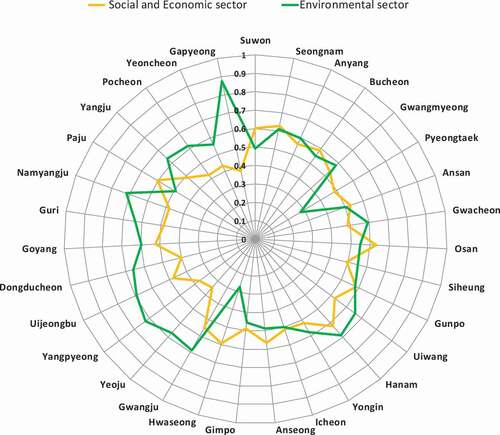
Twenty-seven SDG indicators were categorized into socio-economic and environmental sectors, and then the index was again calculated for each sector. Normalized scores of 18 indicators in the socio-economic sector and the 9 indicators in the environmental sector were computed with a simple average, and the indicators for Goal 16 were included in the socio-economic sector.
The analysis shows that socio-economic sector index is high in cities such as Osan City, Seongnam City, Hanam City, Paju City, Suwon City, and other cities, while Pocheon City, Dongducheon City, Gapyeong County, Yangpyeong County and Yeoju City scores low (see ). The metropolitan cities located in the southern region of Gyeonggi Province are generally high in their socio-economic sector index, while the environmental sector index is relatively low. On the contrary, small cities and counties, mainly located in the northeastern area with rich natural and environmental resources and underdeveloped infrastructure and economy due to various regulations, have higher environmental sector index compared to the socio-economic sector index.
Figure 3. Comparison of local SDGs index in the socio-economic and environmental sector
In particular, through the fuzzy-set ideal-type analysis, the four ideal types with the arrangement of the two variables (the socio-economic SDGs index, and the environmental SDGs index) are derived from 31 local governments. shows the results of the fuzzy membership scores (fuzzy score) of the 31 case governments for the socio-economic SDGs index (S) and the environmental SDGs index (E).
Table 3. Results of Fuzzy-set ideal-type analysis by the local governments of Gyeonggi Province
As illustrated in b, this study specifically identifies the six cities that belong to Type 1 (S*E, “sustainable local gov.”) all having high features of socio-economic sustainability (S) and environmental sustainability (E). They are Hanam City (fuzzy score, 0.729), Gwangju City (0.688), Seongnam City (0.544), Uiwang City (0.519), Goyang City (0.508), and Anyang City (0.506). On the other hand, the six cities/counties classes as Type 4 (s*e, “unsustainable local gov.”) with the features of low socio-economic sustainability (s) and environmental sustainability (e) are: Pyeongtaek City (fuzzy score, 0.650), Gimpo City (0.636), Siheung City (0.593), Yeoncheon County (0.581), Icheon City (0.530), and Gwacheon City (0.500).
Figure 4. Types of local governments’ sustainability by Fuzzy set analysis
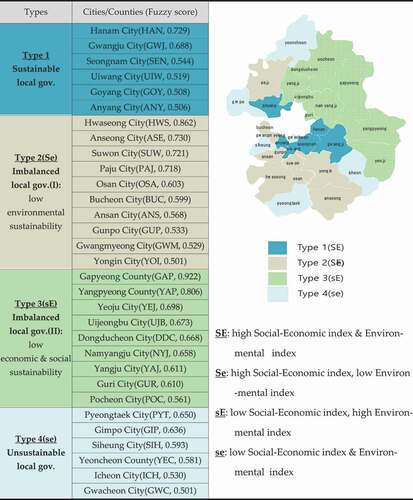
As for Type 2 (S*e, “Imbalanced local gov.(I)”), 10 cities that feature socio-economic sustainability with low environmental sustainability, including Hwaseong City (0.862), Anseong City (0.730), Suwon City (0.721), Paju City (0.718), and Osan City (0.603), are labeled. In Type 3 (s*E,, “Imbalanced local gov.(II)”) with a low feature of socio-economic sustainability and the high feature of environmental sustainability, nine cities/counties including Gapyeong County (0.922), Yangpyeong County (0.806), Yeoju City (0.698), Uijeongbu City (0.673), Dongducheon City (0.668) are categorized.
The local governments belonging to Type 2 and Type 3 through the fuzzy-set ideal-type analysis may describe results that are in line with the characteristics of conventional research results. In other words, local governments in urban areas have high socio-economic capacity (the SDGs index of social and-economic sector), while local governments in rural areas (mostly located in the eastern regions of Gyeonggi Province) have high environmental capacity (the SDGs index of environment sector). However, through the comparative analysis of the fuzzy-set ideal-type analysis (fuzzy score), it appears that the detailed results are derived differently for each local government.
In Hwaseong City (HWS) of Type 2 (S*e, “Imbalanced local gov.(I)”), the difference between the fuzzy score of socio-economic sustainability (0.862) and the fuzzy score of environmental sustainability (0.047) is the highest among Type 2 local governments and the second highest among the 19 local governments of Type 2 & 3 (“Imbalanced local gov.”). However, in Y2018 Hwaseong City had the highest GRDP (Gross Regional Product) among 31 local governments in Gyeonggi Province (approximately 69 billion US $), ranked 1st with 64.21% of fiscal independence, and fourth in fiscal budget (approximately 2 billion US $). When compared to having the highest level of economic capability, the result of Type 2 of the large gap of fuzzy scores in two sectors in Hwaseong City is significantly different from the conventional research results. In the same vein, Suwon City (SUW) also ranks 3rd in GRDP (approximately 32 billion US $), first in fiscal budget (approximately 2.3 billion US $), and fifth in financial independence (55.73%), but the difference between the social and economic fuzzy score (0.900) and the environmental fuzzy score (0.279) was significantly wide as Suwon City belongs to Type 2 (S*e, “Imbalanced local gov.(I)”).
In addition, Pyeongtaek City (fuzzy score, 0.650), Gimpo City (0.636), Siheung City (0.593), Icheon City (0.530) have the characteristics of Type 4 (s*e, “unsustainable local gov.”), despite the relatively high economic and financial capacity and conditions. For example, Pyeongtaek City ranked 4th out of 31 local governments in GRDP (approximately 31 billion US $), 7th in fiscal budget, and 10th in financial independence; Gimpo City, 13th in GRDP (approximately 12 billion US $), 11th in fiscal budget, and 13th in financial independence; Siheung City, 12th in GRDP (approximately 14.5 billion US $), 10th in fiscal budget, and 9th in financial independence; Icheon City, 7th in GRDP (approximately 22 billion US $), 14th in fiscal budget, and 7th in financial independence.
Conclusion and policy implication
This study has attempted to develop and evaluate the SDGs (Sustainable Development Goals) indicators for the local governments by looking at the case of Gyeonggi Province in South Korea with the perspective of mainstreaming and localization of the global SDGs. First of all, considering the importance of cooperation with local governments to achieve SDGs at a regional level, it is meaningful that we developed headline indicators to be jointly implemented. By aiming to provide a balanced evaluation of the diverse cities and counties, 27 indicators were taken into account with quantitative data available. In particular, through the fuzzy-set ideal-type analysis, this paper revealed the four ideal types with the arrangement of the two variables (the socio-economic SDGs index, and the environmental SDGs index) derived from 31 local governments: S*E (“sustainable local gov.”); S*e (“Imbalanced local gov.(I)”); s*E (“Imbalanced local gov.(II)”); and s*e (“unsustainable local gov.”).
Compared to the 1992 ‘Rio Declaration 27 Principles on Environment and Development,’ which served as a guideline for presenting the value of social change for sustainable development, the Sustainable Development Goals (SDGs) emphasize ensuring implementation as a concrete means of facilitating and enabling effective policy intervention for sustainability (Josephsen Citation2017; Hege et al. Citation2019). As the interlinkage between the goal and the targets being the significant feature, SDGs require systematic thinking and a nexus approach that contributes to reducing overlapping or conflicting policies and increasing policy consistency vertically as well as horizontally (Kok and de Coninck Citation2007; Le Blanc Citation2015; Timko et al. Citation2018; Griggs et al. Citation2014; Hege et al. Citation2019). This study to integrate the SDGs between the local and provincial governments, the case of Gyeonggi-do SDGs suggests significant implications for the implementing localization of SDGs.
The SDGs indicator system is a tool for monitoring progress of sustainable development and managing resource allocation, and serves as a scorecard to promote accountability of stakeholders for the goals (SDSN Citation2015; Tosun and Leininger Citation2017). It presents the status and trend of sustainability by goal and target by local governments, as well as where each city stands on the SDGs compared with its peers. The analysis shows that there is a wide gap in the overall SDG index among cities and counties. Therefore, policies to narrow it are necessary at all administrative levels. Specifically in the case of infrastructure, sustainable community goals such as the relative poverty rate, health and well-being, high-quality jobs, and public transportation, the underdeveloped northeastern region is more vulnerable than urban areas. In contrast, the environmental indicators, such as water circulation, greenhouse gas emissions and renewable energy and forest area, showed more vulnerability in urban areas. It is revealed that local SDGs indicators function as a dashboard to identify the most vulnerable and marginalized area and to ensure that no one is left behind through resource redistribution and policy prioritization. They also promote evidence-based policy intervention that leads to taking concrete and focused actions to realize the regional SDGs through addressing local sustainability challenges (Lafortune et at. Citation2020).
The UN SDGs call for a fundamental transition in the development paradigm as a transformative agenda where the goals and the targets are more interconnected requires the pursuit of an integrated and balanced solution for our society, economy and environment. The fuzzy-set ideal type analysis indicates whether cities are taking a balanced approach between socio-economic sustainability and environmental sustainability. As can be seen from the above, cities with high fuzzy scores belonged to Type 1 (S*E: “sustainable local gov.”), while cities with low fuzzy scores were included in Type 4 (s*e: “unsustainable local gov.”). However, it was found that even with a high fuzzy score, the city was characterized as Type 2 (S*e: “imbalanced local gov.(I)”) when there was a large imbalance between socio-economic sustainability and environmental sustainability. In order to achieve SDGs, an integrated approach linking goals and targets by each local government would be critical to ensure that social and economic inequalities such as poverty, income disparity and jobs, do not create greater inequality in health and well-being as well as in environmental services.
Special policy attention should be paid to the seven local governments belonging to Type 4 (s*e: “unsustainable local gov.”), including Yeoju City (fuzzy score, 0.698), Uijeongbu City (0.673), and Dongducheon City (0.668), where all three dimensions (social/economic/environmental) of sustainable development pose challenges. The evaluation result indicates that among the targets the focus of political attention and policy development should be on those relating to sustainable community building, health and poverty as well as the efficiency in energy consumption and resource use. The governments needs to promote sustainable land-use and increase investments in education and job skills to close social inequality. As for Type 2 (S*e: “imbalanced local gov.(I)”) and Type 3 (s*E: “imbalanced local gov.(II)”), it is important to enhance policy coherence so that there is no conflict among social, economic and environmental policy, which target 17.14 of the SDGs also emphasizes as a core means of implementing sustainable development. It requires meaningful coordinated actions across policy sectors and balancing short-term priorities with long-term sustainability objectives (OECD Citation2016, Citation2019a). The cities categorized into Type 2, particularly Hwasung City and Suwon City with the significant difference between the socio-economic sustainability and the environmental sustainability, should reverse the trend in natural resource degradation by strengthening control on the environmental impact of development projects as well as allocating more resources to protect ecosystems. It is essential for the cities/counties of Type 3 (including Gapyeong County (fuzzy score, 0.922), Yangpyeong County (0.806), and Yeoju City (0.698)) to enhance and mobilize the socio and economic resources in a sustainable manner by executing effective customized policies that should reflect the vulnerable socio and economic conditions of the region.
Local governments need to establish their action plans of the SDGs that reflect their needs and local characteristics while linking with Gyeonggi-do SDGs, which should be aligned with urban planning for an integrated and holistic approach. It is also important to prioritize the local SDGs and create a governance model for problem-solving so that the SDGs can spread (Republic of Korea Ministry of Environment Citation2016). Institutional foundations such as the enactment of the Sustainable Development Ordinance and the establishment of the Sustainable Development Committee are essential to ensure the policy coherence for sustainability (OECD Citation2019a). The survey results show that awareness of the SDGs is low, which is true not only of residents but also of public officials. Local governments should become a key player in education and communication for sustainable development.
Meanwhile, this study has some limitations as a pilot evaluation of local SDGs indicators. It is important to note that the overall index scores and fuzzy scores represent sustainability in relative terms, therefore even those cities with high scores are not necessarily the optimal status. Setting 2030 benchmarks would make it easier to compare where local governments are today with where they should be. Good governance affects successful implementation of the SDGs for all types of local governments in common (Glass and Newig Citation2019; Meuleman and Niestroy Citation2015). In practice, delivering on the SDGs is a huge governance challenge, which requires governments to co-ordinate and work across policy areas as well as with the business sector and civil society in a transformative way (OECD Citation2019b). Due to the lack of data, the index score was not calculated for the governance dimension. The two governance indicators, the establishment and implementation of SDGs by local governments, and the level of public–private partnerships are to be monitored by the Gyeonggi-do Council for Sustainable Development. The development of monitoring methodology and capacity building for governance measurement are needed in the future, which, in turn, would contribute to achieving the SDGs through public–private partnership. Furthermore, as SDGs emphasize the inter-target nexus, policy support for areas where the intermediary organizations lack the capacity should be targeted.
Since the analysis was conducted on a single-year quantitative data available at the local level, the establishment of a multi-year time series of statistics is necessary to understand the overarching patterns of local sustainability. Only 27 indicators among 35 were included in the analysis because of lack of available and reliable data, which could lead to credibility problem of the evaluation results. The lack of available data to monitor the progress of SDG indicators makes it difficult to reflect the universal, transformative, and inclusive characteristics of the SDGs. The spatial characteristics, especially the urban-rural development axis contributes to comparing the status of sustainable development between local governments but factors affecting their sustainable capabilities need to be identified. The identification of people and areas suffering from deprivation demands disaggregated data by income, sex, age, disability and other characteristics as well as geographic location, which is more challenging at the local level.
In regards to such limitations, it will be important to continuously supplement the targets and indicators (IEAG Citation2019). In addition, when monitoring local sustainability, the role of qualitative as well as quantitative indicators should be considered, which requires the participation and capacity building of community members. The SDGs data platform will contribute to the implementation of local SDGs by facilitating evidence-based policy design and participation of various stakeholders. Finally, the SDGs targets and indicators should not be considered fixed and therefore it is critical to constantly revise and supplement them through the participation and consensus of various stakeholders. It is important to approach this transition as a series of social learning processes.
Disclosure statement
No potential conflict of interest was reported by the author(s).
Notes
2 The resident survey sample was stratified based on the population composition by gender, age, and region. Among the respondents, 51% were male and 49% were female, and by age, 27% were in their 20s or younger, 58% in their 30s to 50s, and 15% in their 60s or older. Public officials included 71 Gyeonggi-do civil servants and 143 local government officials. The environment was the most active field for experts and agenda members, and 71.8% of respondents who had more than 10 years of experience in the field accounted for the majority.
References
- CNR Korea. 2013. Sustainability Evaluation Report Using Survey for Residents in Gyeonggi-do. Gyeonggi-do, Korea: Gyeonggi-do Council for Sustainable Development.
- Glass, L.-M., and J. Newig. 2019. “Governance for Achieving the Sustainable Development Goals: How Important are Participation, Policy Coherence, Reflexivity, Adaptation and Democratic Institutions?” Earth System Governance 2: 100031. doi:https://doi.org/10.1016/j.esg.2019.100031.
- Griggs, D., M. Stafford Smith, J. Rockström, M. C. Öhman, O. Gaffney, G. Glaser, N. Kanie, I. Noble, W. Steffen, and P. Shyamsundar. 2014. “An Integrated Framework for Sustainable Development Goals.” Ecology and Society 19 (4): 49–14. doi:https://doi.org/10.5751/ES-07082-190449.
- Gyeonggi Research Institute(GRI). 2013. A Study on Indicator Development to Monitor Gyeonggi-do’s Living Environmental Welfare. Gyeonggi-do, Korea: GRI.
- Gyeonggi Research Institute(GRI). 2014. Developing and Monitoring Indicators of Sustainable Development in Gyeonggi-Do. Gyeonggi-do, Korea: GRI.
- Gyeonggi Research Institute(GRI). 2017a. A Preliminary Study on Implementation System of Gyeonggi-do’s SDGs. Gyeonggi-do, Korea: GRI.
- Gyeonggi Research Institute(GRI). 2017b. A Preliminary Study on Analyzing the Dynamics of Quality of Life among the Residents of Gyeonggi-do. Gyeonggi-do, Korea: GRI.
- Gyeonggi Research Institute(GRI). 2018. A Pilot Evaluation of Gyeonggi-do’s SDGs Indicators. Gyeonggi-do, Korea: GRI.
- Gyeonggi-do Council for Sustainable Development. 2019. Ecological Footprint Monitoring for Gyeonggi-do. Gyeonggi-do, Korea: Gyeonggi-do Council for Sustainable Development.
- Hege, E., D. Barchiche, J. Rochette, L. Chabason, and P. Barthélemy. 2019. Initial Assessment and Conditions for Success of the 2030 Agenda for Sustainable Development. IDDRI Study N°07/2019. Paris, France: Institute for Sustainable Development and International Relations(IDDGI).
- Josephsen, L. 2017. “Approaches to the Implementation of the Sustainable Development Goals – Some Considerations on the Theoretical Underpinnings of the 2030 Agenda.” Economics Discussion Paper 60. http://www.economics-ejournal.org/economics/discussionpapers/2017-60
- Katz, H., H. Anheier, and M. Lam. 2006. “Fuzzy Set Approaches to the Study of Global Civil Society.” Global Civil Society 7: 186–196.
- Kok, M. T. J., and H. C. de Coninck. 2007. “Widening the Scope of Policies to Address Climate Change: Directions for Mainstreaming.” Environmental Science & Policy 10 (7–8): 587–599. doi:https://doi.org/10.1016/j.envsci.2007.07.003.
- Korea Development Institute(KDI). 2018. Building Partnerships of SDGs Localization among Local Governments: The Case of Republic of Korea. Sejong, Korea: KDI.
- Korea Environment Institute(KEI). 2017. Case Study and Promotion Plan for Implementation of SDGs by Local Governments. Sejong, Korea: KEI.
- Korea, S. 2018. “2018 Gross Regional Domestic Product.” Accessed 3 February 2020 http://kostat.go.kr/portal/korea/kor_nw/1/13/2/index.board
- Kvist, J. 1999. “Welfare Reform in the Nordic Countries in the 1990S: Using Fuzzy-Set Theory to Assess Conformity to Ideal Types.” Journal of European Social Policy 9 (3): 231–252. doi:https://doi.org/10.1177/095892879900900303.
- Lafferty, W., and E. Hovden. 2003. “Environmental Policy Integration: Towards an Analytical Framework.” Politics 12 (3): 1–22.
- Lafortune, G., G. Fuller, G. Schmidt-Traub, and C. Kroll. 2020. “How Is Progress Towards the Sustainable Development Goals Measured? Comparing Four Approaches for the EU.” Sustainability 12 (18): 7675. doi:https://doi.org/10.3390/su12187675.
- Le Blanc, D. 2015. “Towards Integration at Last? The Sustainable Development Goals as a Network of Targets.” DESA Working Paper No. 14. New York, US: United Nations Department of Economic and Social Affairs(DESA).
- Lee, K.-T., and K. Yong-Joo. 2010. “Measuring the Quality of Life - Focusing on Residents in Gyeonggi Province Case.” The Journal of Social Science 17 (1): 97–123.
- Meuleman, L., and N. Ingeborg. 2015. “Common but Differentiated Governance: A Metagovernance Approach to Make the SDGs Work.” Sustainability 7 (9): 12295–12321. doi:https://doi.org/10.3390/su70912295.
- Organization for Economic Cooperation and Development (OECD). 2015. OECD Development Co-operation Peer Reviews: Germany 2015. Paris, France: OECD.
- Organization for Economic Cooperation and Development (OECD). 2016. Better Policies for Sustainable Development 2016: A New Framework for Policy Coherence. Paris, France: OECD.
- Organization for Economic Cooperation and Development (OECD). 2019a. Policy Coherence for Sustainable Development 2019: Empowering People and Ensuring Inclusiveness and Equality. Paris, France: OECD.
- Organization for Economic Cooperation and Development (OECD). 2019b. Governance as an SDG Accelerator: Country Experiences and Tools. Paris: OECD Publishing. doi:https://doi.org/10.1787/0666b085-en.
- Patole, M. 2018. “Localization of SDGs through Disaggregation of KPIs.” Economies 6 (15): 1–17. doi:https://doi.org/10.3390/economies6010015.
- Perić, N., M. M. Hofmarcher, and J. Simon. 2018. “Headline Indicators for Monitoring the Performance of Health Systems: Findings from the European Health Systems_Indicator(euHSI) Survey.” Archives of Public Health 76 (1): 32. doi:https://doi.org/10.1186/s13690-018-0278-0.
- Pinter, L., P. Hardi, and P. Bartelmus. 2005. Sustainable Development Indicators: Proposals for a Way Forward. New York, US: International Institute for Sustainable Development(IISD).
- Poku, N. K., and J. Whitman. 2011. “The Millennium Development Goals and Development after 2015.” Third World Quarterly 32 (1): 181–198. doi:https://doi.org/10.1080/01436597.2011.543823.
- Ragin, C. C. 2000. Fuzzy-Set Social Science. Chicago, IL, US: University of Chicago Press.
- Ragin, C. C. 2008. Redesigning Social Inquiry Fuzzy Sets and Beyond. Chicago, IL, US: University of Chicago Press.
- Ragin, C. C., and P. Pennings. 2005. “Fuzzy Sets and Social Research.” Sociological Methods & Research 33 (4): 423–430. doi:https://doi.org/10.1177/0049124105274499.
- Republic of Korea Ministry of Environment. 2016. A Study on the Role of Regional Governance for the Implementation of the Sustainable Development Goals. Sejong, ROK: Local Sustainability Alliance of Korea(LSAK).
- Schneider, C. Q., and I. Rohlfing. 2016. “Case Studies Nested in Fuzzy-set QCA on Sufficiency: Formalizing Case Selection and Causal Inference.” Sociological Methods & Research 45 (3): 526–568. doi:https://doi.org/10.1177/0049124114532446.
- Spitz, G., E. van Ewijk, and R. Kamphof. 2016. “Global Goals, Local Action?: Approaches of Dutch Local Governments to the Sustainable Development Goals.” Kaleidos Research Discussion Paper 2. Amsterdam, Netherlands: Kaleidos Research.
- Sustainable Development Solutions Network(SDSN). 2015. Indicators and a Monitoring Framework for the Sustainable Development Goals: Launching a Data Revolution. Paris, France: SDSN.
- Sustainable Development Solutions Network(SDSN). 2016. Getting Started with the SDGs in Cities: A Guide for Stakeholders. Paris, France: SDSN.
- The UN Secretary General’s Independent Expert Advisory Group on the Data Revolution for Sustainable Development(IEAG). 2019. A World that Counts: Mobilising the Data Revolution for Sustainable Development. New York, US: UN.
- Timko, J., P. Le Billon, H. Zerriffi, J. Honey-rose´s, I. De La Roche, C. Gaston, T. C. H. Sunderland, and R. A. Kozak. 2018. “A Policy Nexus Approach to Forests and the SDGs: Tradeoffs and Synergies.” Current Opinion in Environmental Sustainability 34: 7–12. doi:https://doi.org/10.1016/j.cosust.2018.06.004.
- Tosun, J., and J. Leininger. 2017. “Governing the Interlinkages between the Sustainable Development Goals: Approaches to Attain Policy Integration.” Global Challenges. doi:https://doi.org/10.1002/gch2.201700036.
- United Cities and Local Governments (UCLG). 2018. Sustainable Cities Dialogue: Urban Governance at the Core of the Implementation of SDG 11. Barcelona, Spain: UCLG.
- United Cities and Local Governments(UCLG). 2015. The Sustainable Development Goals What Local Governments Need to Know. Barcelona, Spain: UCLG.
- United Nation(UN). 2016. The Sustainable Development Goals Report 2016. New York, US: UN.
- United Nations Department of Economic and Social Affairs(UNDESA). 2013. Global Sustainable Development Report: Building the Common Future We Want. New York, US: UN.
- United Nations Development Programme Global Taskforce of Local and Regional Governments(UNDP GTF). 2016. Roadmap for Localizing the SDGs: Implementation and Monitoring at Subnational Level. New York, US: UNDP.
- United Nations Development Programme Global Taskforce of Local and Regional Governments(UNDP GTF). 2018. “Local and Regional Governments’ Report to the 2018 HLPF.” 2nd Report: Towards the Localization of the SDGs. New York, US: UNDP.
- United Nations Development Programme(UNDP). 2016a. Transitioning from the MDGs to the SDGs. New York, US: UNDP.
- United Nations Development Programme(UNDP). 2016b. Aligning Nationally Determined Contributions and Sustainable Development Goals: Lessons Learned and Practical Guidance. New York, US: UNDP.