
 ?Mathematical formulae have been encoded as MathML and are displayed in this HTML version using MathJax in order to improve their display. Uncheck the box to turn MathJax off. This feature requires Javascript. Click on a formula to zoom.
ABSTRACT
Introduction
Payments for Ecosystem Services (PES) programs have been implemented globally to protect ecosystems while securing the well-being of affected people. Reasonable payment standards are key to successful PES programs. Although some approaches are available for determining payment standards, few studies have applied them for grassland conservation with location indicators and socioeconomic contexts properly considered.
Methods
Using China’s first pilot Grassland Ecological Compensation Policy (GECP) as an example, we analyzed the effects of payment levels, other natural and socioeconomic factors on herders’ willingness to participate in the GECP in Damao County in Inner Mongolia where grassland degradation is happening at an alarming rate due to overgrazing and cropland expansion.
Outcomes
Our results show that households with lower herding income, older age, higher education, larger grassland areas, and worse social relationships are more inclined to participate in the GECP. Conservation payment level, as well as natural and socioeconomic contextual factors, significantly affect the response of herdsmen, and a reasonable grassland payment standard with a 95% policy compliance rate should be 8.8 yuan mu−1.
Discussion and Conclusion
Our findings can inform governments to develop effective PES programs to balance the need of human well-being improvement and grassland conservation in China and beyond.
Introduction
In the past three decades, hundreds of Payments for Ecosystem Services (PES) initiatives have been designed globally to internalize negative environmental externalities (Schomers and Matzdorf Citation2013; Jiang et al. Citation2015; Bryan et al. Citation2018). For instance, early in 1996, Costa Rica pioneered the PES scheme in developing countries by setting up the Pago por Servicios Ambientales program (Pagiola Citation2008). In 2001, Mexico designed the Payment for Hydrological Environmental Services program to protect the watershed (Muñoz-Piña et al. Citation2008). Other example PES programs include the Reducing Emissions from Deforestation and Forest Degradation scheme (REDD) program in South America, the Conservation Reserve Program in the United States and Mexico’s Payments for Carbon, Biodiversity and Agroforestry Services Program (Xu et al. Citation2015). Later in 2010, the world’s largest PES experiment, reducing emissions from deforestation and degradation, conserving and enhancing forest carbon stocks, and sustainably managing forests (REDD+) was conceptualized and implemented to protect and manage forest resources (Corbera Citation2012).
PES, commonly named “ecological compensation” in China, is a popular conservation tool (Kinzig et al. Citation2011; Song et al. Citation2013). PES is an incentive and market-based mechanism, aiming to reconcile the interest conflicts among stakeholders and achieve ecological protection without worsening the well-being status of affected people (Yu and Xu Citation2016; Sun, Dang, and Zheng Citation2017). PES is “a voluntary transaction where a well-defined ES (or a land-use likely to secure that service) is being ‘bought’ by a (minimum one) ES buyer from a (minimum one) ES provider, if and only if the ES provider secures ES provision (conditionality)” (Wunder Citation2005). According to this definition, there are two major types of stakeholders involved in a PES program: the ES providers (sellers) and ES beneficiaries (buyers). In PES programs, a too high payment will be inefficient for the beneficiaries while a too low payment would be unfair for the providers. Therefore, the establishment of appropriate payment standard is the key to effective management (van Noordwijk et al. Citation2012; Matthies et al. Citation2015). A fair deal under PES needs to consider two types of values: the opportunity cost borne by ES providers and the economic value of ES. Usually, the latter is higher than the former. A fair payment standard should take the ES types, ES values, and location indicators into account to reflect the spatial heterogeneity of ES provision (Willaarts, Volk, and Aguilera Citation2012; Richards et al. Citation2015; Sarkki and Karjalainen Citation2015). Besides, a more essential determinant of payment standard is the willingness of the ES buyers and sellers to make the deal (Liu et al. Citation2014; Ren et al. Citation2020). In addition, due to the possible changes of the ES value and stakeholders’ demand under different circumstances, socioeconomic development factors (e.g., household income) should also be considered in the establishment of payment standard (Jin, Huang, and Peng Citation2009; Engel et al. Citation2015; Fan and Chen Citation2019). Respondents with higher-income occupations are more willing to participate in the PES programs and pay more (Peng et al. Citation2018). Due to those complexities, determining a fair payment standard is far from being straightforward (Jin, Yang, and Li Citation2014; Liu and Liu Citation2014). Therefore, it is crucial to develop an efficient way to determine reasonable payment standards for PES programs.
Methods for estimating payment standards for ES can be classified into three categories: the benefit compensation method, the cost compensation method, and the willingness to pay (WTP) or willingness to accept (WTA) method (Sun, Dang, and Zheng Citation2017; Ren et al. Citation2020). The benefit compensation method is based on the economic value of the ecosystem services provided. Based on the market value method (MVM), the payment standard could solve downstream-upstream problems in watersheds, working as an efficient conflict-resolution approach (Kosoy et al. Citation2007). The cost compensation method is widely used. The basis of this method is opportunity cost, which is an appropriate cost measure indicating the social cost of environmental protection (Adams, Pressey, and Naidoo Citation2010). For example, Knoke et al. (Citation2008) estimated the opportunity costs for protecting the secondary forest in Monte Carlo, Chile is 375 USD ha−1 year−1 (1 USD = 6.46 yuan as of July 2021) and the local government used that as the standard to compensate the owners of the forests. The WTP/WTA method evaluates payment standards by investigating respondents their willingness to pay/accept for environmental goods or services under different assumptions (He et al. Citation2016). Compared with WTA, WTP is often underestimated when evaluating the value of the same ecological goods or services (Viscusi and Huber Citation2012; Ren et al. Citation2020). Alcon et al. (Citation2019) investigated preferences and WTP of farmers in a choice experiment at plot and irrigation district level. To support the implementation of water saving measures, farmers were willing to pay higher water prices of 0.32 USD m−3 and 0.22 USD m−3, respectively. Mashayekhi et al. (Citation2016) showed that the coastal communities in southern Iran had a mean WTA of 2026 USD household−1 year−1 by quantifying the opportunity cost of conservation.
In China, PES has been extensively implemented at national and local scales for more than 20 years. On account of the severe drought in 1997 and the heavy floods in the Yangtze river basin during 1998, China began to implement the Sloping Land Conservation Program (SLCP) and the Natural Forest Conservation Program (NFCP) (Zhou et al. Citation2022). SLCP paid farmers for converting croplands to forests or grassland while NFCP paid county governments, local households, or state-own enterprises for activities to prevent forest loss (Yang and Lu Citation2018). Chinese scholars have also made some efforts to estimate the ecological payment standard. Zhou et al. (Citation2015) established the upper limit standard of the ecological compensation by assessing the ES value of the Middle Route Project of the South-to-North Water Transfer from 2002–2010. Sun, Dang, and Zheng (Citation2017) determined the MVM-based payment standard of 876.23 yuan mu−1 year−1 (1 ha = 15 mu) for the Middle Route Project of the South-to-North Water Diversion Project in China. Gao et al. (Citation2018) determined the payment standard of the Dongjiang River Basin was approximately 2057.90 yuan mu−1 based on ES assessment. Xu et al. (Citation2012) measured WTP and WTA of the respondents in Liaohe River Basin were 160.72 yuan person−1 year−1 and 255.97 yuan person−1 year−1 using the nonparametric and parametric methods, respectively. Liu et al. (Citation2019) developed a dynamic eco-agriculture payment standard by coupling the opportunity cost and WTA of farmers. Chu et al. (Citation2020) applied the contingent valuation method (CVM) to analyze residents’ WTA for participating in afforestation projects. The results indicated that 477.91 yuan mu−1 year−1 was an appropriate amount of compensation.
Most PES programs are government-dominated in China, which lead to poor effectiveness, low efficiency, and unfairness (Shang et al. Citation2018; Yang and Lu Citation2018). Governments often represent the ES buyers to pay the ES providers (e.g., farmers and herders), too high compensation amount is a heavy economic burden to the government, while too low conservation investments will worsen the effectiveness of PES programs by reducing the willingness to participate (Liu et al. Citation2014). Although there are many implemented PES programs in forests, wetlands, and grasslands (Gao et al. Citation2016), quantitative studies on payment standards are still relatively few, especially for grasslands. In the existing studies of grassland ecosystems, due to the inconsistent estimation methods, the calculation results of ecological payment standards in varied regions are largely different. Yang et al. (Citation2006) estimated that the average WTA for grassland grazing prohibition in Xilinguo League of Inner Mongolia was 5.73 yuan mu−1 according to the willingness survey method. The psychological compensation standard for herders in Xilinguole League was estimated as 18 yuan mu−1 with the field survey data (Qi et al. Citation2016). Using survey data, Hu et al. (Citation2017) adopted the opportunity cost method to calculate the grazing prohibition compensation standards for three counties in Inner Mongolia, with 5.97 yuan mu−1 for Siziwang County, 7.77 yuan mu−1 for Alxa Left County, and 10.90 yuan mu−1 for Old Barag County. The inconsistent results in the above studies of grasslands compensation standards might be due to the separation of compensation standard from economic and social contexts and did not adjust the impacts of socioeconomic indicators (Fan and Chen Citation2019). In addition, they reflect deficiencies in different estimation approaches. Specifically, the benefit compensation method can only calculate the upper limit of compensation; the cost compensation method requires extensive and long-term socioeconomic investigation, which easily causes incomplete and inaccurate estimation; the WTP/WTA method is difficult to adjust the contradiction between the WTP and the WTA (Liu and Yang Citation2019; Yang et al. Citation2020; Pan and Song Citation2021; Sun et al. Citation2021). Therefore, establishing a credible and reasonable grassland ecological payment standard is essential for achieving the dual goals of Grassland Ecological Compensation Policy (GECP).
Meanwhile, the current grassland ecological payment standards are based on the financial capability of the government and determined by top-level government agencies. Thus, the current payment standard cannot reflect the actual needs of herdsmen and is generally underestimated. Since the implementation of the grazing bans in 2008, the grassland area in Damao, Inner Mongolia has made progress in preventing grassland degradation. Nevertheless, in recent years, many herdsmen have moved back to the original grassland to graze again, which prompts the government to raise the existing grassland compensation standard.
To reflect the actual demands of herdsmen for GECP, we aim to: (1) understand the characteristics of relocated households (i.e., households participate in the program but still choose to graze) and non-relocated households (i.e., households participate in the program and do not graze); (2) analyze the effects of different conservation payments on the grazing willingness of herdsmen; and (3) explore the impacts of other natural and socioeconomic factors on the herdsmen’s willingness to graze. Our findings reveal the driving factors behind the herders’ returning to pasture, which may guide policymakers to formulate a more reasonable payment standard to promote grassland recovery.
Materials and methods
Study area
Damao County (N 41°20′ – 42°40′, E 109°16′ – 111°25′) is one of the 19 border counties close to the north border of Inner Mongolia (). It has a total area of 18,177 km2 and administrates 7 pastoral townships and 5 non-pastoral townships. Residents (approximately 20,000 in 6620 households) in pastoral townships live within and around the grasslands. The income of local households mainly depends on livestock husbandry (e.g., cattle, sheep, horses), cropping, and government subsidies (e.g., pasture prohibition subsidies, land acquisition subsidies, pensions and subsistence allowances).
Figure 1. Map of Damao County.
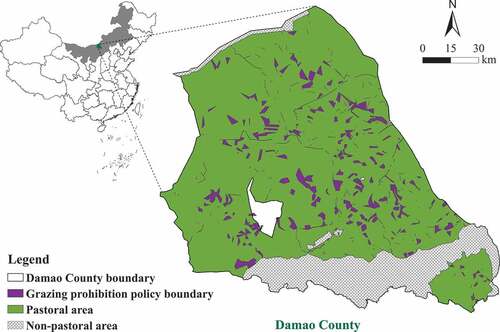
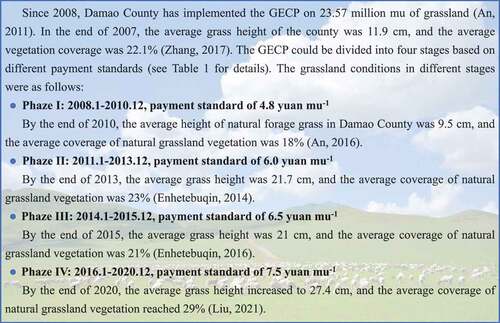
The sensitivity to climate change and human intervention makes Damao County an ecologically fragile region (Wang et al. Citation2004; Zhou et al. Citation2014). In the 1990s, the grasslands of Damao County have been severely desertified and degraded due to factors such as drought and over-grazing. Therefore, to reduce grazing pressure and recover grassland productivity, since 2008 Damao County has fully implemented the GECP, with 6620 pastoral households signed the contracts to participate. It was also the first pilot area in China that completely implemented enclosure and grazing prohibition. The payment standard of the GECP varied across years (). The subsidies were designed to motivate herders to comply with the GECP, conserve the grassland ecosystems, and increase pastoral household incomes (Hu, Huang, and Hou Citation2019; Yin et al. Citation2019). Since the implementation of the grazing prohibition policy, the grassland conditions of Damao County has improved significantly. By the end of 2020, the average height and vegetation coverage of natural grassland in the whole county were 15.5 cm and 6.9% higher than those before the grazing prohibition, respectively ().
Table 1. General information of the PES program in damao county
Figure 2. Grassland conditions of Damao County under differet payment standards.
Data collection and pre-processing
We conducted household surveys from May to August 2017 in Damao County. Since the householders or their spouses are often the decision makers who are familiar with household affairs. Therefore, we chose them as our interviewees. Details of survey design were listed in Supplementary Material. We adopted the stratified random sampling method and selected 251 households (). The selected pastures were also randomly sampled from 7 pastoral townships, covering 7 pastoral townships, and corresponding to the 251 households in the questionnaire. We collected household data on household demographic and economic status, social networks (cash gift and maximum amount of money can be borrowed from relatives and friends), and the responses of households to different payment levels. We obtained annual average precipitation map with 1000 m resolution, elevation map with 30 m resolution from the Institute of Geography, Chinese Academy of Sciences. We calculated the slope of every grassland patch from the elevation map. We combined those 251 household survey data with geodatabase of pasture parcels. There were 212 (84.5%) matched households with spatially-explicit pasture information.
Measurements
Considering data availability and insights from relevant literature (Chen et al. Citation2009), we selected fourteen associated indicators () to measure the impacts on households’ willingness to graze. These indicators represent financial, human, natural, and social capital aspects (Liu et al. Citation2012). Economic factors such as conservation payment, herding income, and livestock directly affect households’ willingness to graze. Since men are the main herding labor, we used the number of male laborers for pasture monitoring activities. A laborer is defined as an individual between the age of 15 and 59 (Yang et al. Citation2013b). Age and education affect an individual’s attitude and behavior (Rustagi, Engel, and Kosfeld Citation2010). Since adults are decision makers in household affairs, we used the average age of all adult members and the average education level of all adult members except for current students. Natural factors such as aspect and precipitation largely determine the quality of pastures. Besides, steeper slope reduces human access and thus reduces grazing and pasture degradation. Larger grassland area means more government subsidies, and thus lower chance of grazing. Members of the same subgroup are more likely to enforce each other’s trust than they are not of the same subgroup. Since relatives and friends can be regarded as the same subgroup of a household, we used cash gift and average maximum potential loans from relatives and friends to measure social capital (Frank and Yasumoto Citation1998).
Table 2. Descriptive statistics of variables used in the model
Data analysis
We assumed that herders were willing to re-graze in their grasslands if the utility of re-grazing was greater than the utility of no-grazing in a new round of policy. That is, Ui0 > Ui1, where Ui0 and Ui1 are the utilities of sample i going re-grazing and no-grazing in the new policy, respectively. The utility function U(·) is unobservable; however, there is a probability of participating in the PES program and choosing not to graze. This can be given by:
where Yi = 1 if the choice was to participate in the program under the hypothesized scenario; otherwise Yi = 0.
According to the actual results of the questionnaire, not all households answered all four questions. For example, in the scenario of reducing subsidies, households chose to answer one, two, or three questions, and thus we set different weighting for the unbalanced sampling. The response of grazing households to different levels of conservation payments was empirically modeled with a random-effects weighted logit model:
where is the probability of the ith sample not grazing;
is a weighting vector which integrates the multiple choices of the ith sample, in the case of reducing subsidies where households answered one, two, or three questions, the weighting is going to be one, a half, and one-third, respectively; Xi represents all variables of the ith sample, including conservation payment, household economic, demographic conditions, and geographic conditions, land plot features, and social networks;
represents the new ith sample after integration;
is a parameter vector associated with the independent variables; and
represents the unobserved random effects associated the ith sample.
In the weighted logit model, the marginal effects of continuous variables are given by:
where represents the jth model variable; X represents all model variables;
is the coefficient of
; and the partial derivative is calculated at the mean of all the explanatory variables in the model.
We preprocessed the data and analyzed the rationality of the model. We combined the data points from two scenarios of reducing subsidies and increasing subsidies. We first combined with correlation test and the effect of model fitting, to decide which variables can be put in our model. We then used the percentiles method (upper percentile = 97.5%), standardized residuals (> 2.5), and Cook’s Distance (> 1) to eliminate outliers. Finally, we select four sets of data representing different annual incomes for multiple comparisons (See Supplementary Material for more details of data analysis).
Results
Descriptive statistics of relocated and non-relocated households
Our results show that the grazing households that relocated to the pasture to graze owned larger grassland area, higher herding income, more male household members, lower age, higher education, and higher loans than those of non-relocated households (). In our sampled 212 households, 127 households moved out of the pastures when the grazing prohibition policy began, and among which 123 households (96.85%) moved back to their grasslands to graze again. Only 6 households (2.83%) did not relocate to pasture, and the rest, including those who did not move out before, were still grazing. shows that the average herding income of households who grazed (52.56 thousand yuan) was almost half more than those who did not graze (36.00 thousand yuan). The male ratio and age of relocated households were slightly higher and lower than those of non-relocated households, respectively. However, the average education in non-relocated households was almost two years lower than that of relocated households. Many residents who did not graze were older, and they were happy to retire after receiving the subsidies. Besides, relocated households had 842 mu larger grassland area and around a third more loans than those of non-relocated households on average ().
Table 3. Descriptive statistics of variables for relocated and non-relocated households
Effects of different levels of conservation payment on non-grazing
Our results also show that conservation payment had a significantly positive effect on respondents’ willingness to not graze in the GECP, with an S-shaped growth relationship ( and ). When all other variables are controlled at their mean values, an additional yuan per mu per year of conservation payment will increase the odds of non-grazing in the GECP by 26.9 times. Specifically, an additional 0.1 yuan based on 7.80 yuan mu−1 () will on average increase the households’ willingness to not graze by 7.88% ().
Table 4. Estimate of conservation payments and other characteristics and their marginal effects on the grazing households’ response
Figure 3. Response curve of non-grazing ratios and payments. 1 ha = 15 mu.
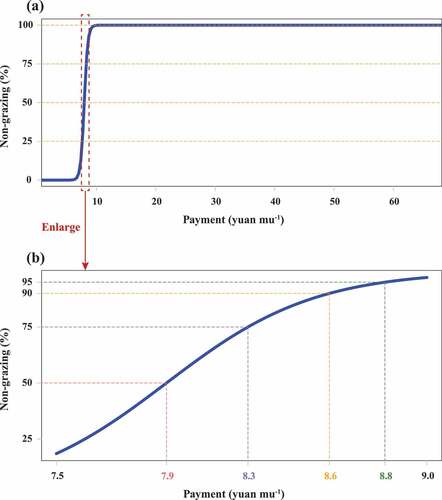
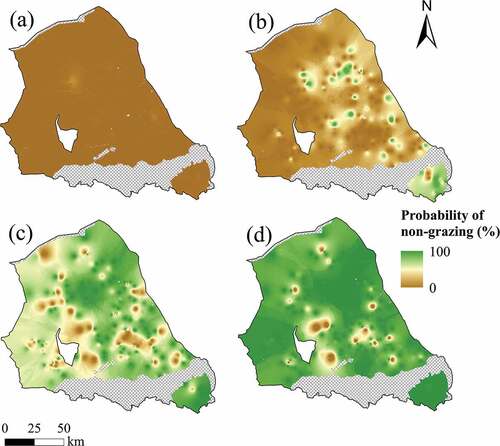
Households are more willing to support the GECP when conservation payment increases. Conservation payment has the largest marginal effect of approximately 50% on the non-grazing rate when the payment is 7.9 yuan mu−1 by our calculation, where the marginal effects of conservation payment are smallest with the payment of 10.7 yuan mu−1 and 0 yuan mu−1, where 99.99% and none of the households would participate in the GECP, respectively (). According to our model, under the existing payment level of 6.5 yuan mu−1, the proportion of herders not grazing was only 0.80%. However, when the payment rose to 7.5 yuan mu−1 and 8.5 yuan mu−1, the proportion of non-grazing could increase to 18.48% and 86.37%, respectively. This indicates that herders are very sensitive to payment increase. This also indicates that the current compensation of the PES policy does not meet the expectations of most households and the payment standards should be improved. Among those grassland plots under the grazing prohibition policy, more than half can be prevented from being grazed with the payment of 7.9 yuan mu−1 (). Moreover, if the current grassland ecological compensation in Damao County can be renewed with the payment of 8.6 yuan mu−1, 90% of grassland plots could be protected from overgrazing (). Maps of the probability of non-grazing under four different conservation payments across grazing prohibition policy implemented area also support our point of view (). shows that, as the amount of compensation increases, the probability of herdsmen not grazing is getting higher and higher.
Figure 4. Maps of the spatial configuration of probability of non-grazing under different conservation payments in Damao County, China (a: 70% of current payment; b: 100% of current payment; c: 130% of current payment; d: 150% of current payment).
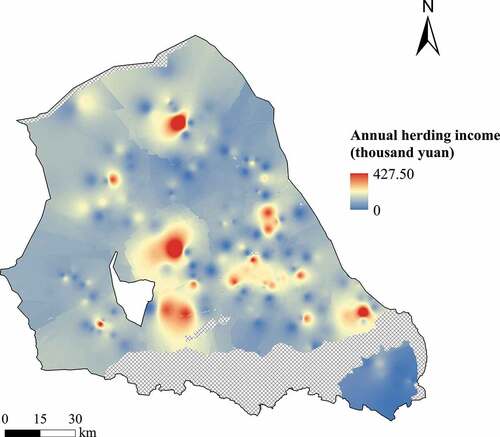
also indicates the minimum payment levels to achieve different non-grazing policy goals. Taking government’s willingness into account is a useful complement to formulate scientific policies (Jin et al. Citation2019). For instance, if the government in Damao County wants more than 95% of grassland plots be saved from overgrazing, then the payment standard should be increased to at least 8.8 yuan mu−1 (). The impacts of different compensation standards on grazing pressure (measured by stock capacity, Figure S1) show that with the increase of compensation standard to 8.8 yuan mu−1, the range of grazing pressure in the pastoral area will be reduced from 0 ~ 0.87 sheep mu−1 to 0 ~ 0.04 sheep mu−1. In 2019, the grassland bureau reported that the reasonable stock capacity of grassland should be limited to no more than 0.04 sheep mu−1 (Wei and Wu Citation2019), which is coincidently matched with our results of 95% of non-grazing (Figure S1). shows the spatial distributions of pasture subsidies predicted by our model under the 50%, 75%, 90%, and 95% of non-grazing goals, respectively. The conservation payment is overall higher in the west and lower in the east, which is consistent with the distribution of annual herding income ().
Figure 5. Maps of the spatial configuration of predicted conservation payment which herders expect for under different probability scenarios in Damao County (a: probability = 50%; b: probability = 75%; c: probability = 90%; d: probability = 95%). 1 ha = 15 mu.
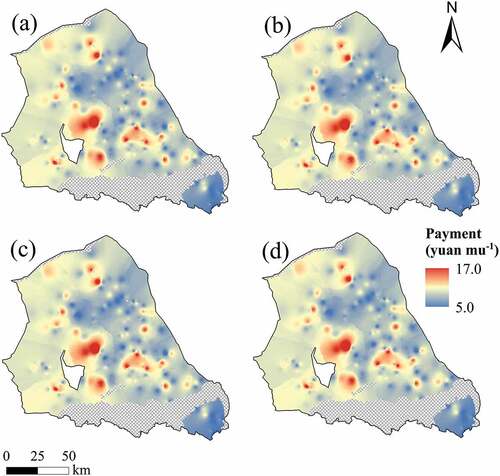
Figure 6. Distribution map of annual herding income of herders in Damao County.
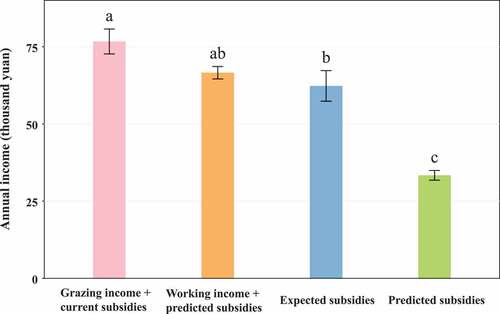
The predicted results of our model are not only consistent with the current pasture income of herders, but also meet the pastoral subsidy expectations of the herdsmen in the questionnaires. When herders receive subsidies and are banned from grazing, they can have other livelihoods to make a living (e.g., go out to work). In this way, there is no significant difference between the sum of the two parts of income (i.e., predicted subsidies and salaries) and the current actual pasture income (i.e., grazing and subsidies), and the expected subsidies in their questionnaires, respectively (). Therefore, these results also suggest that the predicted results of our model are reasonable.
Figure 7. Bar graph of significant differences in annual income of different types (pink: sum of actual annual grazing income and current annual subsidies; Orange: sum of the annual subsidies predicted by the model (probability = 95%) and the income from working outside (monthly minimum wage in Inner Mongolia implemented in 2017, the fourth level is 1460 yuan per month, Ministry of Human Resources and Social Security of China); blue: annual subsidies expected by herders in the questionnaires; green: annual subsidies predicted by the model (probability = 95%)).
Effects of other factors on non-grazing
Household economic status has an important effect on the response of herdsmen to the policy (). For instance, herding income has a significantly positive effect on households’ willingness to graze (p < 0.001). With all other relevant factors controlled at their mean values, an increase of herding income by 1,000 yuan increases the willingness of grazing by 2.2%. This result indicates that households with more income from herding previously were more likely to choose not to participate because they expected benefits from grazing being higher than the compensation from participating in the program. We also found that when the herders moved back to the pasture after the policy implemention, the amount of livestock had a significantly negative effect on households’ willingness to graze (p < 0.01). The more livestock there were on the pasture when the herders moved back, the more subsidies herders would expect to reduce the amount of livestock or even not graze. The difference between the old and new compensation amounts should at least make up for the amount of livestock that each household could sell after policy implemention. Therefore, the impact of the amount of livestock at the time of relocation on the willingness to graze was directly linked to the amount of compensation. In addition, the change in the number of livestock owned by each household when the herders move in and out had a significantly positive effect on households’ willingness to graze (p < 0.05). When herders resettled to the pasture, a decrease of livestock by 100 sheep based on the original moving out reduced the proportion of households’ willingness to resume grazing by 6.7%.
For the demographic conditions, the average age of adults and the average education level of non-students in grazing households showed significant effects in our model. Specifically, older and higher educated households were more likely to participate in the program. One additional year of a household’s average age and education increased the probability of non-grazing by 2.3% and 7.2%, respectively (). Considering demographic conditions comprehensively, on average a household with the age of 45.00 and education of 8.00 had the same likelihood of non-grazing as that of the age of 48.13 and education of 7.00 ().
Furthermore, our results demonstrate that pasture area had nonlinear and significant effects on non-grazing (). Since the area of each household’s grassland determined the amount of payment one could receive directly, it had a significantly positive effect on households’ willingness to graze (p < 0.05). The larger the area, the more subsidies, and thus the willingness to graze was naturally lower when the household participated in the program. Again, controlling all other variables at their mean values, one hundred more mu of grassland reduced the probability of grazing by 0.6% (). The effects of aspect and variation of precipitation were also significant ().
Nevertheless, social relationships (measured by the amount of gift income) had negative effects on non-grazing. It is estimated that 1,000 yuan of more gift income led to 2.4% of higher willingness to re-graze (). According to our field investigation, if the herders’ social relationships were better, once they heard that their relatives and friends had moved back to re-graze, they were more likely to join them and graze again (). This result is consistent with the observed social network effect on collective action and resource outcome in Wolong Nature Reserve for giant pandas, where households are inclined to follow the behaviors of their relatives and friends, especially those local leaders (Yang et al. Citation2013b).
Discussion
Designing an effective payment standard is crucial for sustainable rural development, particularly in poverty-stricken areas with fragile ecological and economic systems. PES program with sound design and implementation can be an efficient instrument for poverty alleviation and sustainable regional development (Zhang, Yang, and Yu Citation2009; Kemkes, Farley, and Koliba Citation2010; Gao et al. Citation2019; Jin et al. Citation2019). We estimated households’ response curves to different payment standards in Damao County using the weighted logit model. Our findings suggest that households with lower herding income, older age, higher education, larger grassland area, and worse social relationships are more inclined to participate in the GECP. The impacts of conservation payment, herding income, livestock, household age and education, aspect, precipitation, and area of grassland on the response of herders can be substantial. Based on our results, we provide the following recommendations for further improvements of the GECP and other similar PES programs.
First, reasonable compensation standards and diverse compensation sources are essential for the region’s grassland resource management. According to our study, we found that increasing the compensation amount to 8.6 yuan mu−1 year −1 or 8.8 yuan mu−1 year−1 would encourage 90% or 95% of households to participate in the GECP and not graze, respectively. The average grassland compensation standard estimated by Hu et al. (Citation2017) through opportunity cost was 8.21 yuan mu−1, which was consistent with ours. Nevertheless, Qi et al. (Citation2016) estimated the reasonable compensation as 18 yuan mu−1, which was much higher than ours. The reasons for such difference might be due to the different estimation methods and Qi et al. (Citation2016) did not control the impacts of grazing pressure and financial capital. Besides, it is also necessary to diversify compensation sources and enrich compensation methods (e.g., industrial compensation and education compensation). Currently, most of the PES fund comes from the central government. It is crucial to establish partnership funds with other stakeholders (e.g., tourism companies, animal husbandry and processing companies, and sandstorm-affected regions such as Beijing and Hebei Province) that benefit from grassland protection. Meanwhile, except for subsidies, industrial compensation can provide alternative livelihoods for herders. Education compensation can enhance herders’ environmental awareness and increase herders’ other non-pastoral employment opportunities, and thus eventually reduce herders’ dependence on pastures.
Second, expanding non-agricultural sources of income of herdsmen and reducing the proportion of agriculture income in total household income can be an effective measure for increasing PES program compliance. Specifically, the government and environmental organizations could provide skill training and guidance on local and migrant workers. For the poor or senior herdsmen whose compensation income is insufficient to maintain the normal household income and who are unable to obtain other sources of income, the government should provide basic social welfare protection via relevant national and regional policies. The above alternative livelihood measures have also been proposed by some other studies (Yang et al. Citation2013a, Citation2018; Wu et al. Citation2019).
Third, PES programs should be integrated into China’s rural governance through the rural revitalization plan and ecosystem product value realization strategy (Gao et al. Citation2020; Ouyang et al. Citation2020; Tong et al. Citation2020; Jin et al. Citation2021). For example, the gross ecosystem product (GEP) accounting has recently been integrated into the System of Environmental-Economic Accounting – Ecosystem Accounting framework of the United Nations (United Nations Citation2021). In China, recently GEP accounting has been used in PES programs to demonstrate ecological effectiveness, evaluate government officials, improve spatial planning, and design policy tools for the market transaction of ecosystem services. The obtained economic benefits from ecosystem service transactions are then shared with local rural households (Gao et al. Citation2020; Ma et al. Citation2020; Ouyang et al. Citation2020).
As the core logic of the PES program relies on the reallocation of ecological and socioeconomic costs and benefits among different stakeholders, the long-term success of PES programs should be ecologically effective, economically efficient, and socially equal (Yang and Lu Citation2018). Our study helps to understand participating households’ responses to different payment standards and other socioeconomic and ecological contexts. It also clearly demonstrates the number of conservation funds required to achieve different policy targets. However, as macro-socioeconomic contexts change and local households interact with their dependent ecosystems, households’ responses would also vary. Thus, for future research, it is important to monitor the long-term dynamics of influencing factors and their corresponding impacts on households’ conservation behaviors and resource outcomes. As policymakers are often less interested in what have occurred and more eager to obtain operational solutions to address existing problems, it is important to construct coupled human and natural systems models to simulate different ecological, economic, and social outcomes under different policy scenarios.
Conclusion
A scientifically sound payment standard is important to achieve ecological effectiveness, economic efficiency, and social equity for PES programs in the long term. Taking Damao County in Inner Mongolia as an example, we find that households who are willing to participate in the PES program are those with lower herding income, older age, higher education, larger grassland area, and worse social networks. Payment standards, along with other socioeconomic and natural factors such as herding income, livestock, age, education, aspect, precipitation, and area of grassland significantly affect households’ willingness to not graze. Our results also show that the payment standard at the survey time (6.5 yuan mu−1) only has a 0.8% policy compliance rate and is far below the expectation of most households. Increasing the payment standard to 8.8 yuan mu−1 could attract 95% of households to participate in the PES program. Conservation policy planning and implementation are complex processes (Yang et al. Citation2013a). Our findings demonstrate the quantitative and nonlinear responses of households to different levels of payments for ecosystem services. Our study also suggests that ecological effectiveness, economic efficiency, and social equity of PES programs can be improved by proper regulation of conservation payments, socioeconomic conditions, demographic trends, and ecological contexts. The methodology and findings of our study may also guide the design and implementation of conservation policies in many other places across China and the rest of the world.
Supplemental Material
Download Zip (2.4 MB)Acknowledgments
We thank Yange Wang, Yu Xie, Xinchao Liu, and Zhou Yang for great help with the survey. We also thank Yufan Wei, Zhigang Zou, and Jinying Zhou for their useful suggestions on the manuscript.
Disclosure statement
No potential conflict of interest was reported by the authors.
Supplementary material
Supplemental data for this article can be accessed here.
Correction Statement
This article has been republished with minor changes. These changes do not impact the academic content of the article.
Additional information
Funding
Related Research Data
References
- Adams, V. M., R. L. Pressey, and R. Naidoo. 2010. “Opportunity Costs: Who Really Pays for Conservation?” Biological Conservation 143 (2): 439–15. doi:10.1016/j.biocon.2009.11.011.
- Alcon, F., S. Tapsuwan, R. Brouwer, M. Yunes, O. Mounzer, and M. D. De-miguel. 2019. “Modelling Farmer Choices for Water Security Measures in the Litani River Basin in Lebanon.” Science of the Total Environment 647: 37–46. doi:10.1016/j.scitotenv.2018.07.410.
- An, G. 2011. Comments on the Executive Effects on the Policy of Closed Grass and Forbidding Grazing in Damao Banner. Inner Mongolia: Inner Mongolia Normal University.
- An, G. 2016. “Investigation and Reflection on the Implementation Effect of Grassland Ecological Environment Protection Policy in Recent ten Years.” Economic Review Journal 11: 100–103. doi:10.16528/j.cnki.22-1054/f.201611100.
- Bryan, B. A., L. Gao, Y. Ye, X. Sun, J. D. Connor, N. D. Crossman, M. Stafford-Smith, et al. 2018. “China’s Response to a National Land-system Sustainability Emergency.” Nature 559 (7713): 193–204. doi:10.1038/s41586-018-0280-2.
- Chen, X., F. Lupi, G. He, and J. Liu. 2009. “Linking Social Norms to Efficient Conservation Investment in Payments for Ecosystem Services.” Proceedings of the National Academy of Sciences of the United States of America 106 (28): 11812–11817. doi:10.1073/pnas.0809980106.
- Chu, X., J. Zhan, C. Wang, S. Hameeda, and X. Wang. 2020. “Households’ Willingness to Accept Improved Ecosystem Services and Influencing Factors: Application of Contingent Valuation Method in Bashang Plateau, Hebei Province, China.” Journal of Environmental Management 255: 109925. doi:10.1016/j.jenvman.2019.109925.
- Corbera, E. 2012. “Problematizing REDD+ as an Experiment in Payments for Ecosystem Services.” Current Opinion in Environmental Sustainability 4 (6): 612–619. doi:10.1016/j.cosust.2012.09.010.
- Engel, S., C. Palmer, L. Taschini, and S. Urech. 2015. “Conservation Payments under Uncertainty.” Land Economics 91 (1): 36–56. doi:10.3368/le.91.1.36.
- Enhetebuqin. 2014. “Report on the Work of the Government of Damao County, Baotou.” http://www.dmlhq.gov.cn/gzbg/5118489.jhtml
- Enhetebuqin. 2016. “Report on the Work of the Government of Damao County, Baotou.” http://www.baotou.gov.cn/info/1585/92876.htm
- Fan, M., and L. Chen. 2019. “Spatial Characteristics of Land Uses and Ecological Compensations Based on Payment for Ecosystem Services Model from 2000 to 2015 in Sichuan Province, China.” Ecological Informatics 50: 162–183. doi:10.1016/j.ecoinf.2019.01.001.
- Frank, K. A., and J. Y. Yasumoto. 1998. “Linking Action to Social Structure within a System: Social Capital within and between Subgroups.” American Journal of Sociology 104 (3): 642–686. doi:10.1086/210083.
- Gao, Y., Z. Han, Y. Cui, H. Zhang, and L. Liu. 2019. “Determination of the Agricultural Eco-Compensation Standards in Ecological Fragile Poverty Areas Based on Emergy Synthesis.” Sustainability 11 (9): 2548. doi:10.3390/su11092548.
- Gao, L., H. W. Kinnucan, Y. Zhang, and G. Qiao. 2016. “The Effects of a Subsidy for Grassland Protection on Livestock Numbers, Grazing Intensity, and Herders’ Income in Inner Mongolia.” Land Use Policy 54: 302–312. doi:10.1016/j.landusepol.2016.02.016.
- Gao, Z. B., X. L. Wang, J. Su, Z. F. Chen, M. X. Zheng, Y. Y. Sun, and D. F. Ji. 2018. “Ecological Compensation of Dongjiang River Basin Based on Evaluation of Ecosystem Service Value.” Journal of Ecology and Rural Environment 34 (6): 563–570. doi:10.11934/j.1673-4831.2018.06.012.
- Gao, X., W. Xu, Y. Hou, and Z. Ouyang. 2020. “Market-based Instruments for Ecosystem Services: Framework and Case Study in Lishui City, China.” Ecosystem Health and Sustainability 6 (1): 1835445. doi:10.1080/20964129.2020.1835445.
- He, K., J. Zhang, Y. Zeng, and L. Zhang. 2016. “Households’ Willingness to Accept Compensation for Agricultural Waste Recycling: Taking Biogas Production from Livestock Manure Waste in Hubei, P. R. China as an Example.” Journal of Cleaner Production 131: 410–420. doi:10.1016/j.jclepro.2016.05.009.
- Hu, Y., J. Huang, and L. Hou. 2019. “Impacts of the Grassland Ecological Compensation Policy on Household Livestock Production in China: An Empirical Study in Inner Mongolia.” Ecological Economics 161: 248–256. doi:10.1016/j.ecolecon.2019.03.014.
- Hu, Z., D. Liu, D. Kong, and L. Jin. 2017. “Rate Calculation of “Subsidies for Grazing Prohibition” in Grassland Eco-compensation Based on Opportunity Cost Method.” Journal of Arid Land Resources and Environment 31 (2): 63–68.
- Jiang, B., C. P. Wong, Y. Chen, L. Cui, and Z. Ouyang. 2015. “Advancing Wetland Policies Using Ecosystem Services—China’s Way Out.” Wetlands 35 (5): 983–995. doi:10.1007/s13157-015-0687-6.
- Jin, G., K. Chen, T. Liao, L. Zhang, and O. Najmuddin. 2021. “Measuring Ecosystem Services Based on Government Intentions for Future Land Use in Hubei Province: Implications for Sustainable Landscape Management.” Landscape Ecology 36 (7): 2025–2042. doi:10.1007/s10980-020-01116-3.
- Jin, G., K. Chen, P. Wang, B. Guo, Y. Dong, and J. Yang. 2019. “Trade-offs in Land-use Competition and Sustainable Land Development in the North China Plain.” Technological Forecasting and Social Change 141: 36–46. doi:10.1016/j.techfore.2019.01.004.
- Jin, Y., J. F. Huang, and D. L. Peng. 2009. “A New Quantitative Method for Ecological Compensation Bansed on Ecosystem Capital in Zhenjiang Province, China.” Journal of Zhejiang University. Science. B 10 (4): 301–305. doi:10.1631/jzus.b0820222.
- Jin, S. T., Y. C. Yang, and B. Li. 2014. “Discussion on Scientific Issues of Eco-compensation Standard in Shiyang River Basin.” Journal of Natural Resources 29 (4): 610–622.
- Kemkes, R. J., J. Farley, and C. J. Koliba. 2010. “Determining When Payments are an Effective Policy Approach to Ecosystem Service Provision.” Ecological Economics 69 (11): 2069–2074. doi:10.1016/j.ecolecon.2009.11.032.
- Kinzig, A. P., C. Perrings, F. S. Chapin III, S. Polasky, V. K. Smith, D. Tilman, and B. L. Turner IIII. 2011. “Paying for Ecosystem Services—Promise and Peril.” Science 334 (6056): 603–604. doi:10.1126/science.1210297.
- Knoke, T., P. Hildebrandt, D. Klein, R. Mujica, M. Moog, and R. Mosandl. 2008. “Financial Compensation and Uncertainty: Using Mean-variance Rule and Stochastic Dominance to Derive Conservation Payments for Secondary Forests.” Canadian Journal of Forest Research 38 (12): 3033–3046. doi:10.1139/X08-137.
- Kosoy, N., M. Martinez-Tuna, R. Muradian, and J. Martinez-Alier. 2007. “Payments for Environmental Services in Watersheds: Insights from a Comparative Study of Three Cases in Central America.” Ecological Economics 61 (2–3): 446–455. doi:10.1016/j.ecolecon.2006.03.016.
- Liu, H. 2021. “Report on the Work of the Government of Damao County, Baotou.” https://www.nmg.gov.cn/zwgk/zfggbg/ms/Baotou/202103/t20210319_1203452.html
- Liu, C., and W. Liu. 2014. “Study on the Provincial Difference and Influential Factors of Eco-compensation in China.” Journal of Natural Resources 29 (7): 1091–1104.
- Liu, M., W. Liu, L. Yang, W. Jiao, S. He, and Q. Min. 2019. “A Dynamic Eco-compensation Standard for Hani Rice Terraces System in Southwest China.” Ecosystem Services 36: 100897. doi:10.1016/j.ecoser.2019.100897.
- Liu, W., C. A. Vogt, J. Luo, G. He, K. A. Frank, and J. Liu. 2012. “Drivers and Socioeconomic Impacts of Tourism Participation in Protected Areas.” Plos One 7 (4): e35420. doi:10.1371/journal.pone.0035420.
- Liu, M., Y. Xiong, Z. Yuan, Q. Min, Y. Sun, and A. M. Fuller. 2014. “Standards of Ecological Compensation for Traditional Eco-agriculture: Taking Rice-fish System in Hani Terrace as an Example.” Journal of Mountain Science 11 (4): 1049–1059. doi:10.1007/s11629-013-2738-x.
- Liu, G., and Q. Yang. 2019. “Ternary Valuation Theory of Ecosystem Services and Its Application in Large-scale Ecological Compensation.” Chinese Journal of Environmental Management 11 (1): 29–37.
- Ma, G., J. Wang, F. Yu, W. Yang, J. Ning, F. Peng, X. Zhou, Y. Zhou, and D. Cao. 2020. “Framework Construction and Application of China’s Gross Economic-Ecological Product Accounting.” Journal of Environmental Management 264: 109852. doi:10.1016/j.jenvman.2019.109852.
- Mashayekhi, Z., A. Danehkar, G. A. Sharzehi, and V. Majed. 2016. “Coastal Communities WTA Compensation for Conservation of Mangrove Forests: A Choice Experiment Approach.” Knowledge and Management of Aquatic Ecosystems 417: 20. doi:10.1051/kmae/2016007.
- Matthies, B. D., T. Kalliokoski, T. Ekholm, H. F. Hoen, and L. T. Valsta. 2015. “Risk, Reward, and Payments for Ecosystem Services: A Portfolio Approach to Ecosystem Services and Forestland Investment.” Ecosystem Services 16: 1–12. doi:10.1016/j.ecoser.2015.08.006.
- Muñoz-Piña, C., A. Guevara, J. M. Torres, and J. Braña. 2008. “Paying for the Hydrological Services of Mexico’s Forests: Analysis, Negotiations and Results.” Ecological Economics 65 (4): 725–736. doi:10.1016/j.ecolecon.2007.07.031.
- Ouyang, Z., C. Song, H. Zheng, S. Polasky, Y. Xiao, I. J. Bateman, J. Liu, et al. 2020. “Using Gross Ecosystem Product (GEP) to Value Nature in Decision Making.” Proceedings of the National Academy of Sciences of the United States of America 117 (25): 14593–14601. doi:10.1073/pnas.1911439117.
- Pagiola, S. 2008. “Payments for Environmental Services in Costa Rica.” Ecological Economics 65 (4): 712–724. doi:10.1016/j.ecolecon.2007.07.033.
- Pan, M., and B. Song. 2021. “The Role of Willingness to Accept in Determining the Upper or Lower Limit of Eco-compensation Standard.” China Environmental Science 41 (4): 1932–1939.
- Peng, Z., L. Zhang, J. Yin, and H. Wang. 2018. “Study of Impact Factors of Willingness to Pay regarding Water Reserve of South-to-North Water Diversion Project in Beijing Based on Bayesian Network Model.” Journal of Cleaner Production 184: 569–578. doi:10.1016/j.jclepro.2018.02.263.
- Qi, X., B. Gao, H. Wang, J. Zhou, and G. Qiao. 2016. “The Study on the Compensation and Award Standards for Forage-livestock Balance and Grazing Prohibition Based on Herders’ Perspective of Grassland Ecological Protection Subsidies and Incentives policies—Take Xilin Gol League as an Example.” Journal of Arid Land Resources and Environment 30 (5): 30–35.
- Ren, Y., L. Lu, H. Zhang, H. Chen, and D. Zhu. 2020. “Residents’ Willingness to Pay for Ecosystem Services and Its Influencing Factors: A Study of the Xin’an River Basin.” Journal of Cleaner Production 268: 122301. doi:10.1016/j.jclepro.2020.122301.
- Richards, R. C., J. Rerolle, J. Aronson, P. H. Pereira, H. Gonçalves, and P. H. S. Brancalion. 2015. “Governing a Pioneer Program on Payment for Watershed Services: Stakeholder Involvement, Legal Frameworks and Early Lessons from the Atlantic Forest of Brazil.” Ecosystem Services 16: 23–32. doi:10.1016/j.ecoser.2015.09.002.
- Rustagi, D., S. Engel, and M. Kosfeld. 2010. “Conditional Cooperation and Costly Monitoring Explain Success in Forest Commons Management.” Science 330 (6006): 961–965. doi:10.1126/science.1193649.
- Sarkki, S., and T. P. Karjalainen. 2015. “Ecosystem Service Valuation in a Governance Debate: Practitioners’ Strategic Argumentation on Forestry in Northern Finland.” Ecosystem Services 16: 13–22. doi:10.1016/j.ecoser.2015.09.003.
- Schomers, S., and B. Matzdorf. 2013. “Payments for Ecosystem Services: A Review and Comparison of Developing and Industrialized Countries.” Ecosystem Services 6: 16–30. doi:10.1016/j.ecoser.2013.01.002.
- Shang, W., Y. Gong, Z. Wang, and M. J. Stewardson. 2018. “Eco-compensation in China: Theory, Practices and Suggestions for the Future.” Journal of Environmental Management 210: 162–170. doi:10.1016/j.jenvman.2017.12.077.
- Song, X., Z. Xu, Y. Qi, X. Yin, and J. Ge. 2013. “Study of Spatial Target and Compensation Standard of Eco-compensation in Qinghai Lake Watershed.” Journal of Glaciology and Geocryology 35 (2): 496–503. doi:10.7522/j.1000-0240.2013.0059.
- Sun, J., Z. Dang, and S. Zheng. 2017. “Development of Payment Standards for Ecosystem Services in the Largest Interbasin Water Transfer Projects in the World.” Agricultural Water Management 182: 158–164. doi:10.1016/j.agwat.2016.06.025.
- Sun, X., X. Liu, S. Zhao, and Y. Zhu. 2021. “An Evolutionary Systematic Framework to Quantify Short-term and Long-term Watershed Ecological Compensation Standard and Amount for Promoting Sustainability of Livestock Industry Based on Cost-benefit Analysis, Linear Programming, WTA and WTP Method.” Environmental Science and Pollution Research 28 (14): 18004–18020. doi:10.1007/s11356-020-11769-x.
- Tong, Y., J. Zhou, Q. Ding, Y. Zhang, and W. Yang. 2020. “One Village Ten Thousand Trees” Green Option Model for Realizing the Value of Ecological Products.” Chinese Journal of Environmental Management 12 (5): 18–27. doi:10.16868/j.cnki.1674-6252.2020.05.018.
- United Nations. 2021. “System of Environmental-Economic Accounting—Ecosystem Accounting: Final Draft.” Department of Economic and Social Affairs Statistics Division. https://unstats.un.org/unsd/statcom/52nd-session/documents/BG-3f-SEEA-EA_Final_draft-E.pdf
- van Noordwijk, M., B. Leimona, R. Jindal, G. B. Villamor, M. Vardhan, S. Namirembe, D. Catacutan, J. Kerr, P. A. Minang, and T. P. Tomich. 2012. “Payments for Environmental Services: Evolution toward Efficient and Fair Incentives for Multifunctional Landscapes.” Annual Review of Environment and Resources 37: 389–420. doi:10.1146/annurev-environ-042511-150526.
- Viscusi, W. K., and J. Huber. 2012. “Reference-dependent Valuations of Risk: Why Willingness-to-accept Exceeds Willingness-to-pay.” Journal of Risk and Uncertainty 44 (1): 19–44. doi:10.1007/s11166-011-9132-2.
- Wang, X., Z. Dong, J. Zhang, and L. Liu. 2004. “Modern Dust Storms in China: An Overview.” Journal of Arid Environments 58 (4): 559–574. doi:10.1016/j.jaridenv.2003.11.009.
- Wei, J., and R. Wu. 2019. “CPPCC Proposal to Promote China’s Implementation of Grassland Ecological Protection Awards.” http://lcj.nmg.gov.cn/xxgk/gndt/202101/t20210108_434439.html
- Willaarts, B. A., M. Volk, and P. A. Aguilera. 2012. “Assessing the Ecosystem Services Supplied by Freshwater Flows in Mediterranean Agroecosystems.” Agricultural Water Management 105: 21–31. doi:10.1016/j.agwat.2011.12.019.
- Wu, X., S. Wang, B. Fu, Y. Zhao, and Y. Wei. 2019. “Pathways from Payments for Ecosystem Services Program to Socioeconomic Outcomes.” Ecosystem Services 39: 101005. doi:10.1016/j.ecoser.2019.101005.
- Wunder, S. 2005. “Payment for Environmental Services: Some Nuts and Bolts.” CIFOR Occasional Paper 42: 1–24. https://www.cifor.org/publications/pdf_files/OccPapers/OP-42.pdf
- Xu, D., L. Chang, T. Hou, and Y. Zhao. 2012. “Measure of Watershed Ecological Compensation Standard Based on WTP and WTA: A Case Study in Liaohe River Basin.” Resources Science 34 (7): 1354–1361.
- Xu, J., X. Liu, L. Feng, and Y. Huan. 2015. “Research Advances in Understanding the Trade-offs Involved in Payment for Ecosystem Services.” Acta Ecologica Sinica 35 (20): 6901–6907.
- Yang, Q., G. Liu, B. F. Giannetti, F. Agostinho, C. M. V. B. Almeida, and M. Casazza. 2020. “Emergy-based Ecosystem Services Valuation and Classification Management Applied to China’s Grasslands.” Ecosystem Services 42: 101073. doi:10.1016/j.ecoser.2020.101073.
- Yang, W., W. Liu, A. Viña, J. Luo, G. He, Z. Ouyang, H. Zhang, and J. Liu. 2013a. “Performance and Prospects of Payments for Ecosystem Services Programs: Evidence from China.” Journal of Environmental Management 127: 86–95. doi:10.1016/j.jenvman.2013.04.019.
- Yang, W., W. Liu, A. Viña, M. Tuanmu, G. He, T. Dietz, and J. Liu. 2013b. “Nonlinear Effects of Group Size on Collective Action and Resource Outcomes.” Proceedings of the National Academy of Sciences of the United States of America 110 (27): 10916–10921. doi:10.1073/pnas.1301733110.
- Yang, W., and Q. Lu. 2018. “Integrated Evaluation of Payments for Ecosystem Services Programs in China: A Systematic Review.” Ecosystem Health and Sustainability 4 (3): 73–84. doi:10.1080/20964129.2018.1459867.
- Yang, G., Q. Min, W. Li, L. Liu, J. Rong, and X. Wu. 2006. “Herdsmen’s Willingness to Accept (WTA) Compensation for Implement of Prohibiting-graze Policy in Xilinguole Steppe.” Ecology and Environment 15 (4): 747–751.
- Yang, H., W. Yang, J. Zhang, T. Connor, and J. Liu. 2018. “Revealing Pathways from Payments for Ecosystem Services to Socioeconomic Outcomes.” Science Advances 4 (3): eaao6652. doi:10.1126/sciadv.aao6652.
- Yin, Y., Y. Hou, C. Langford, H. Bai, and X. Hou. 2019. “Herder Stocking Rate and Household Income under the Grassland Ecological Protection Award Policy in Northern China.” Land Use Policy 82: 120–129. doi:10.1016/j.landusepol.2018.11.037.
- Yu, B., and L. Xu. 2016. “Review of Ecological Compensation in Hydropower Development.” Renewable and Sustainable Energy Reviews 55: 729–738. doi:10.1016/j.rser.2015.10.038.
- Zhang, Y. 2017. “Report on the Work of the Government of Damao County, Baotou.” https://www.nmg.gov.cn/zwgk/zfggbg/ms/Baotou/201807/t20180731_230182.html
- Zhang, Y., Z. Yang, and X. Yu. 2009. “Evaluation of Urban Metabolism Based on Emergy Synthesis: A Case Study for Beijing (China).” Ecological Modelling 220 (13–14): 1690–1696. doi:10.1016/j.ecolmodel.2009.04.002.
- Zhou, C., X. Ding, G. Li, and H. Wang. 2015. “Ecological Compensation Standards in the Water Source Area of the Middle Route Project of the South-North Water Transfer Project.” Resources Science 37 (4): 792–804.
- Zhou, W., C. Gang, L. Zhou, Y. Chen, J. Li, W. Ju, and I. Odeh. 2014. “Dynamic of Grassland Vegetation Degradation and Its Quantitative Assessment in the Northwest China.” Acta Oecologica 55: 86–96. doi:10.1016/j.actao.2013.12.006.
- Zhou, T., W. Shen, X. Qiu, H. Chang, H. Yang, and W. Yang. 2022. “Impact Evaluation of a Payments for Ecosystem Services Program on Vegetation Quantity and Quality Restoration in Inner Mongolia.” Journal of Environmental Management 303: 114113. doi:10.1016/j.jenvman.2021.114113.