
 ?Mathematical formulae have been encoded as MathML and are displayed in this HTML version using MathJax in order to improve their display. Uncheck the box to turn MathJax off. This feature requires Javascript. Click on a formula to zoom.
ABSTRACT
Background
Natural ecosystems, such as forests and grasslands, can mitigate heat waves, but research on heat wave mitigation in mountain ecosystems is lacking. Considering the upper reaches of the Yangtze River basin (URYB) as the study area, we first divided the URYB into mountainous and non-mountainous areas based on a digital elevation model (DEM). Then, we used temperature to identify heat waves and used the temperature and humidity index to identify suitable days. Finally, the differences between mountainous and non-mountainous areas were compared, and regional development strategies are proposed.
Result
(1)The frequency and duration of heat waves increased by 0.433/y (P < 0.1), 0.07/y (P < 0.05), while the number of suitable days in June, July, and August gradually decreased slightly by 0.0096/y (P < 0.1), 0.0125/y (P < 0.1), 0.004/y (P < 0.1), respectively from 1986 to 2015. (2)The average monthly number of suitable days was the highest in mountainous areas during the summer from 1986 to 2015. Mountainous areas have an advantage in mitigating heat waves owing to landform-based changes in the local climate. (3)In addition to the landform, altitude was the main factor responsible for mitigating heat waves in mountainous areas.
Conclusion
Parts of the plateau and whole mountain areas were found to be best for avoiding extremely high temperatures based on the number of suitable summer days from 1986 to 2015. We suggest formulating tourism promotion strategies, and strengthening tourism infrastructure, considering landscape protection and creation to promote sustainable regional development.
Introduction
Heat waves are large scale, continuous high temperature phenomena that have become a major threat to human health (Meehl and Tebaldi Citation2004). Warming climates have increased the intensity, frequency, and duration of heat waves worldwide (Parente et al. Citation2018; Piticar Citation2018; Lee et al. Citation2020). Heat waves have far reaching implications for human health(Gao et al. Citation2012). Urban heat wave-related heat damage and mortality is increasing (Tan et al. Citation2010). Moreover, the number of associated deaths might be seriously underestimated (Lim et al. Citation2019).
For human health reasons, current research on heat wave prevention is divided into adaptation and mitigation efforts (Mayer et al. Citation2008; Hu et al. Citation2017; Morecroft et al. Citation2019; Wang et al. Citation2019). Most adaptation studies explore the role of new building materials and structures (Falasca et al. Citation2019; Top et al. Citation2020; He et al. Citation2021). The mitigation of heat waves is divided into human behavior and the natural environment. During heat waves, humans consciously adjust outdoor travel strategies and indoor intervention measures (Ban et al. Citation2019). For the natural environment, altitude, precipitation, and other factors are considered (Katavoutas and Founda Citation2019; Rasilla et al. Citation2019; Du et al. Citation2020; Golshan et al. Citation2021). However, current mitigation efforts primarily focus on non-mountainous areas (Negi et al. Citation2017; Wang et al. Citation2019).
Heat waves in China are primarily caused by the weakening of the South Asian and subtropical highs in the Northwest Pacific, resulting in a weakened summer monsoon (Wang, Zhou, and Chen Citation2014). This blocks the water supply to the southwest monsoon, resulting in large-scale water shortages and drying (You et al. Citation2017). More than 50% of the land area is expected to be affected by an intense heat wave (Sun et al. Citation2017). Furthermore, the number of heat wave days is increasing in almost all regions. Moreover, the heat wave index is higher in the south than in the north (You et al. Citation2017); during the summers, large-scale heat waves have occurred in southwest China and the southern Yangtze River basin, extending northward (Wang et al. Citation2016). Therefore, ways to mitigate heat waves are key to reducing their effects using natural factors.
Mountainous areas have advantages in mitigating heat waves in the natural environment. For example, they are at a high altitude, have more terrain, and induce rain, which contributes to resistance to heat waves (Cremonese et al. Citation2017; Corona-Lozada, Morin, and Choler Citation2019). Therefore, heat wave mitigation in mountainous areas is worthy of attention. However, the key factors in mountain areas for heat wave mitigation are unclear.
Human thermal comfort is used as an evaluation index for adaptation and mitigation (Heo, Bell, and Lee Citation2019; Rasilla et al. Citation2019; Wang et al. Citation2020; Shi et al. Citation2021) and is an important indicator for evaluating the climate suitability of human settlements (Cheng et al. Citation2012). Climatic conditions, such as temperature and relative humidity, affect thermal comfort (Oliveira and Andrade Citation2007); moreover, the human body can maintain a certain degree of thermal comfort through a combination of physiological control (such as sweating and shivering) and behavioral responses (such as clothing, seeking shade, or air conditioning) (Spagnolo and de Dear Citation2003; Djongyang, Tchinda, and Njomo Citation2010). Therefore, we used thermal comfort as an index to evaluate the effects of mountainous areas on heat wave mitigation.
In this study, therefore, we used the upper reaches of the Yangtze River basin (URYB) as the study area, evaluated its effect on mitigating heat waves via the thermal comfort index, and proposed three key scientific questions as follows: (1) the mitigation effect of mountain areas on heat waves; (2) the key factors for mitigating heat waves in mountainous areas; (3) how to use the heat wave mitigation effect in mountainous areas to promote regional sustainable development.
Materials and methods
Study area
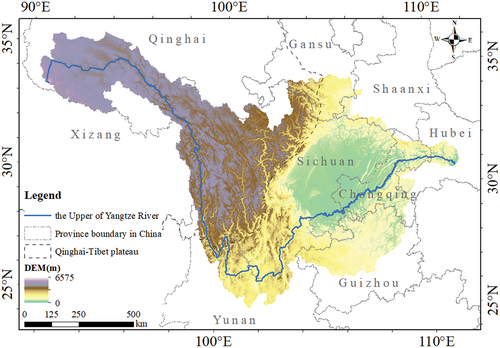
The study area encompasses the entire upper Yangtze River basin (25–36°W, 90–115°E) and covers 983052km2 (). Its topography includes the eastern edge of the Qinghai–Tibet Plateau. The basic geomorphologic types are plains, plateaus, basins, hills, and mountains. The elevation fluctuates significantly, with 31% of the total area located above 4000 m, 25% below 1000 m, and 12% between 3000 and 4000 m. Most of the study area has a subtropical monsoon climate, with an annual average precipitation of approximately 1000 mm, and rainfall is concentrated from May to September. The average annual temperature is between 16 and 18°C. Cities are concentrated in the Sichuan Basin; those in other regions are primarily located on both sides of the valley (Jin et al. Citation2018). Ecosystem restoration and protection projects have been widely conducted in this region, which currently has a high vegetation coverage rate. Vegetation in 72.56% of the region is positively affected by climate change. However, from upstream to downstream, the impact of climate change weakens, and that of human activities increases (Wang et al. Citation2021a).
Figure 1. Location of the study area.
Data
We used a digital elevation model (DEM) and climate factors. The Shuttle Radar Topography Mission DEM data with a spatial resolution of 90 m were obtained from the Resource and Environment Data Cloud Platform (www.resdc.cn). We used DEM with the moving window method and mean change point method to calculate topographic relief in elevation and subsequently resampled this to 1 km to match the climate data. Then, the average values of the altitude and topographic relief were determined by the township boundaries. The two data was used to study the geomorphic zoning of the study area and the influencing factors of suitable days.
The climate data were downloaded from the China Meteorological Data Service Center (data.cma.cn) and consisted of the daily temperature, precipitation, and relative humidity of the study area and its surrounding meteorological stations from 1986 to 2015, which were interpolated by cokriging. This method uses altitude as a covariate to enhance the spatial distribution of the climate parameters; thus, it is frequently used for regional scale climate interpolation (Foehn et al. Citation2018; Yu et al. Citation2020; Usowicz et al. Citation2021). The data resolution was 1 km, and the average temperature, cumulative precipitation, and average relative humidity of each month were obtained from the interpolated daily data based on the township boundaries. The data was used to study the generation of heat wave and suitable days and the influencing factors of suitable days.
For the vegetation area, the land use data of 1990, 1995, 2000, 2005, 2010, and 2015 were adopted with a resolution of 1 km. They were obtained from the Resource and Environment Data Cloud Platform (www.resdc.cn) of the Institute of Geographic Sciences and Natural Resources Research, Chinese Academy of Sciences. We used township boundaries to determine the average vegetation area from 1990 to 2015. The soil moisture data were derived from the Harmonized World Soil Database with a resolution of 1 km. We determined the average soil moisture using township boundaries. The two data was used to study the influencing factors of suitable days.
Evaluation of landform classification
We used a proportion of the mountainous area to classify landform types and reveal the differences in heat wave mitigation for different types of mountainous areas. The data processing unit was a grid, and the analysis unit was a township. Townships were classified according to landforms to reflect differences in mountains because a township is an administrative unit that serves as a management unit during the development of mountainous areas. Referring to previous Chinese geomorphological classification methods (Li, Pan, and Han Citation2008; Chenghu et al. Citation2009), we used altitude for landform classification (). The township landform types were divided according to the proportion of mountainous areas ().
Table 1. Area type classification standards (Li, Pan, and Han Citation2008; Chenghu et al. Citation2009).
Table 2. Indicators for the classification of mountainous areas (Li, Pan, and Han Citation2008; Chenghu et al. Citation2009).
Heat wave assessment
At present, there are many heat wave discriminant indices (Breshears et al. Citation2021; Singh, Mall, and Singh Citation2021). In China, the most widely used is a daily maximum temperature greater than 35°C for three consecutive days (Zuo et al. Citation2015; Jedlovec, Crane, and Quattrochi Citation2017; Shiva, Chandler, and Kunkel Citation2019). Therefore, we used this index to identify summer heat waves in the URYB from 1986 to 2015. The spatiotemporal variations in heat waves were analyzed using their frequency and duration.
Thermal comfort assessment
The temperature humidity index (THI), standard effective temperature (SET), and predicted mean vote (PMV) indices are often used to evaluate thermal comfort (Segnalini et al. Citation2013; Miura et al. Citation2020; Tartarini et al. Citation2020). Additionally, THI is used to evaluate the impact of climate, such as humidity and temperature, on human thermal comfort (Bostan, Timofte, and Leontie Citation2011; Ye, Song, and Zhong Citation2022). Owing to the spatial heterogeneity of the topography and climate in the URYB, we used THI, which can present the differences between humidity and temperature. The formula is as follows:
where t is the temperature in Celsius (°C) and f is the relative humidity (%) in the atmosphere.
The above formula, temperature, and relative humidity were used to calculate the THI comfort levels, which were ranked according to the classification standards of the climate suitability evaluation index ().
Table 3. Comfort classification for the temperature humidity index (THI) (Bostan, Timofte, and Leontie Citation2011).
Grades 1–3 represent conditions that feel cold and uncomfortable, whereas Grades 4–7 represent conditions in which the human body feels comfortable or very comfortable, while Grades 8–9 represent hot and uncomfortable conditions.
Based on the township boundary statistics for summers from 1986 to 2015, THI grades 4–7 were considered suitable days.
Statistical analysis
The least square method is widely used in trend analysis of climate change (Hou et al. Citation2015). Therefore, we applied the ordinary least squares regression method to study the yearly trends in heat waves and THI from 1986 to 2015.
Pearson correlation analysis is often used to identify correlations between climatic factors (Zhang, Zhang et al. Citation2020; Ma et al. Citation2021; Wang et al. Citation2021b). If the P value calculated by this method was less than 0.05, it indicated that the two variables have a significant correlation within the 95% confidence interval. If less than 0.01, it indicated that the two variables have a significant correlation within the 99% confidence interval. We used this analysis to study the relationship between suitable days and precipitation, altitude, topographic relief, vegetation area and soil moisture in different geomorphological areas during the study period.
Results
Spatiotemporal variation of heat waves
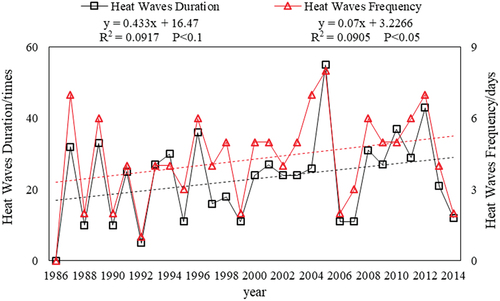
The frequency and cumulative days of summer heat waves in the URYB from 1986 to 2015 changed over time (). Both the duration and frequency of heat waves increased, with a slight increase in the duration by 0.433/y (P < 0.1), and frequency by 0.07/y (P < 0.05). Heat waves were the most serious in 2006, with a frequency of 8 and a duration of 55 cumulative days.
Figure 2. Frequency and duration of summer heat waves from 1986 to 2015.
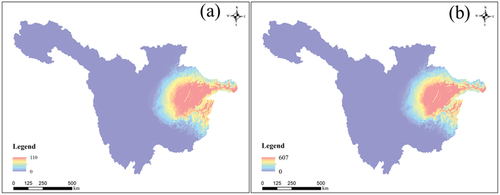
shows that the summer heat wave frequency and cumulative days in the URYB were highly coincident in the eastern region. The cumulative number of occurrences over the 30 years reached 110, while the cumulative duration was 607 days.
Figure 3. (a) Cumulative frequency and (b) duration of summer heat waves in number of days from 1986 to 2015.
Spatiotemporal variations in THI
The monthly average summer THI had spatial heterogeneity, but the distributions in June, July, and August were similar (). From east to west, the monthly average THI gradually decreased. The THI in the south was high. Areas with the highest values in June were present in the south and east, whereas those in July and August were concentrated in the east.
Figure 4. Spatial pattern in monthly mean summer THI from 1986 to 2015 in the months of (a) June, (b) July, and (c) August.
The number of suitable days during summers from 1986 to 2015 had monthly differences between June, July, and August (; ); all had a decreasing trend. The suitable days in June, July, August decreased slightly by 0.0096/y (P < 0.1), 0.0125/y (P < 0.1), 0.004/y (P < 0.1), respectively. The number of suitable days was 2.3–5.6 in June, 1.5–2.9 in July, and 1.6–3.7 in August. The average number of suitable days during the summer months for the entire study period were 3.4, 2.1, and 2.5 days, respectively. The years with the maximum number of suitable days for these months were 2010, 1992, and 2002, and the minimum occurred in 2002, 2001, and 1990.
Figure 5. Cumulative number of suitable days during the summer months in 1986–2015.
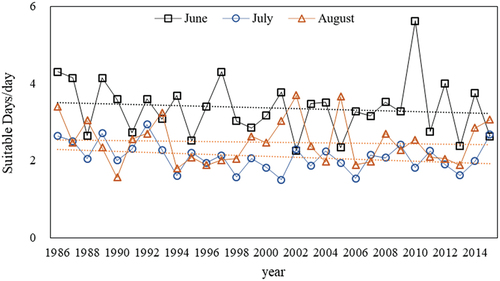
Table 4. Calculated variations in the total number of suitable days during the summer months from 1986 to 2015.
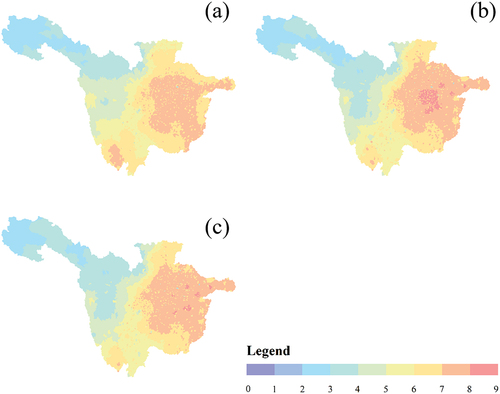
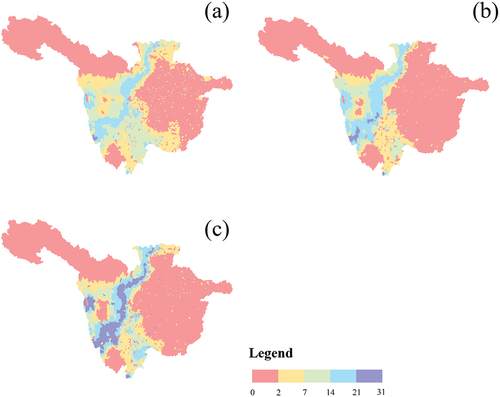
From 1986 to 2015, the distribution of the average number of suitable days exhibited heterogeneity each month, yet had similar spatial distributions (). The average number of suitable days for each month were the highest in the middle of the URYB, decreasing gradually to the east and west. Those in the eastern and western regions were the lowest (< 2 days). The month that had the largest area with suitable days was August, followed by July.
Figure 6. Spatial pattern in the number of average suitable days from 1986 to 2015 in the months of (a) June, (b) July, and (c) August.
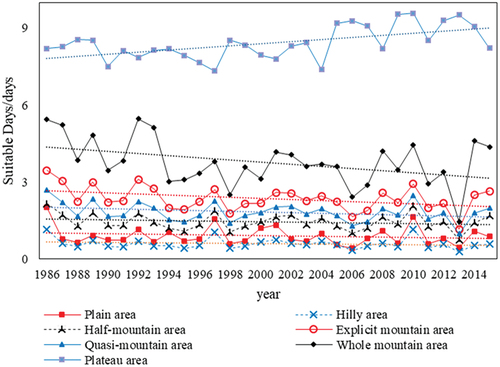
The average number of suitable days in each summer month varied significantly among the different geomorphological regions during the study period (). The monthly average was the highest, at 8.4 days, for the Tibetan Plateau, followed by that for the whole mountainous area, which was 3.8 days. The average was the lowest in the plain and hilly areas, which was less than 1 day.
Figure 7. Average number of suitable days during the summer months in each type of mountain area from 1986 to 2015.
Factors influencing suitable days
Precipitation, altitude, topographic relief, vegetation area, and soil moisture in the URYB had differing effects on the cumulative number of suitable days in the summer months for different landform areas (). Precipitation had a significant negative impact in the quasi and explicit mountain areas in June and the plain and hilly areas in August (P < 0.05). However, it had a significant positive effect in the plateau area (P < 0.05). Altitude had a significant, strong positive effect on the cumulative number of suitable days in all regions except the plateau area (P < 0.05), where the effect was negative (P < 0.05). Topographic relief had a significant positive effect on the cumulative number of suitable days in all regions except the quasi- and half-mountain areas (P < 0.01). This was especially true for the explicit mountain and plateau areas in June. The vegetation area had a significant negative effect in the plain area and plateau area in the summer months (P < 0.01), but it had a significant positive effect in the whole mountainous area in July and August and in the hilly area, quasi mountain area, and explicit mountain area in the summer months (P < 0.05). Soil moisture had a significant positive effect in the hilly areas in June and in the quasi mountain area, explicit mountain area, whole mountain area, and plateau area in the summer months (P < 0.05).
Table 5. Effects of factors on the suitable days from June to August.
Discussion
Factors effecting heat wave mitigation
Heat waves are affected by major factors such as climate change (temperature, precipitation), human activities (urbanization, carbon emissions), and surface interactions (soil moisture, surface albedo) (Wu, Wang et al. 2021). Therefore, mountainous areas have unique advantages in mitigating heat waves (Ye, Song, and Zhong Citation2022). The higher altitude in the mountains results in cooler temperatures. At the same time, the uplift of the mountain increases, and the precipitation increases, with the elevation (Yao et al. Citation2016; Chen et al. Citation2018). Owing to the landform, the degrees of urbanization and carbon emission intensity in mountainous areas are much lower than those in non-mountainous areas (Luo and Lau Citation2021). We investigated factors commonly considered to be the main mitigation factors for heat waves in the upper Yangtze region (Zhou and Shepherd Citation2010; An and Zuo Citation2021). The mountains in the URYB are rich in vegetation, which can effectively alleviate population exposure and surface albedo during heat waves (Yao and Zhang Citation2014; Li et al. Citation2022). In addition, the heat waves in the URYB primarily occurred in the eastern region, which is highly coincident with the Sichuan Basin range as calibrated by Liu et al. (Citation2021). There is obvious spatial heterogeneity in the suitable days counted according to different geomorphological regions. In summary, mountain landforms directly affect these factors and change the microclimate. Therefore, landforms in mountain areas play a decisive role in heat wave mitigation.
Altitude is a major factor in mountainous areas mitigating heat waves, in addition to landforms. Especially in low altitude areas, mountain tops and high-altitude areas have the advantage of providing a comfortable climate (Endler and Matzarakis Citation2011). Because altitude had a significant effect on suitable days in all landform areas (P < 0.01), and the correlation coefficient was greater than that of other factors. Moreover, precipitation, altitude, topographic relief, vegetation area, and soil moisture are the main factors, except altitude, contributing to the local thermal comfort in the URYB, consistent with the results of Mangone, Kurvers, and Luscuere (Citation2014). These factors had a significant effect on the number of suitable days in different months and geomorphic regions (P < 0.05). Moreover, after distinguishing different geomorphological areas, we found that, except for the plateau area, altitude had the greatest impact on the number of suitable days. This is related to the lower temperatures directly caused by elevation(Navarro-Estupinan et al. Citation2018).
THI identification of areas for avoiding extremely high temperatures
By examining the THI, we found areas that were suitable for avoiding extremely high temperatures in whole mountain areas and parts of the plateau. Although the most suitable region differed among the summer months, it was generally located in the Qinghai-Tibet Plateau and whole mountain areas. However, in the plateau area, only the Sichuan province was suitable. This is due to the fact that the plateau in Sichuan Province belongs to the eastern margin of the Qinghai-Tibet Plateau, with huge topographic relief, and most of the landforms still belong to mountainous areas rather than plateaus (Cheng et al. Citation2011). In addition, previous studies have identified areas that can be used to avoid heat waves as areas outside the area where heat waves occur (Oleson et al. Citation2018). Our study further identified which of these areas were more comfortable.
Our research extends the application range of the THI. Previous studies on heat waves and thermal comfort have focused on individual buildings or urban areas (Yang et al. Citation2013; Bai et al. Citation2014; Lu et al. Citation2020), and the use of thermal comfort has been limited to urban layouts, clothing materials, human health, and similar topics (Wong, Li, and Yeung Citation2002; Matusiak Citation2010; Yin et al. Citation2012; Jin, Liu, and Kang Citation2019; Huang, Tsai, and Chen Citation2020). Our research scope is more extensive, revealing the relationship between the spatial heterogeneity in regional heat waves and thermal comfort and further identifying regions suitable for avoiding extreme high temperature weather.
Suggestions for environmental health policy
Comfortable climate is good for human health. Climatic conditions are one of the effective factors affecting human comfort and health. Meanwhile, it is also an important part of the environment-associated lifestyle of entertainment and tourism (Amininia et al. Citation2020). Parks and green spaces can provide a comfortable environment for heating and can reduce climate-related health risks (Brown et al. Citation2015; Ye, Song, and Zhong Citation2022). The mountainous areas in the URYB have major development problems, such as rural hollowing and population aging (Liu et al. Citation2010; Wu, Song, and Yu Citation2019). The development of mountainous areas mainly relies on tourism and primary industries (Fang and Ying Citation2016). Owing to the appropriate climate, this area can create a high-end tourism experience and can contribute to leisure, vacation, health-related, exploration, and scientific research activities. Our findings provide diversified paths for industrial development in mountainous areas, thereby reducing the impact of rural hollowing and population aging on development.
Our findings suggest more options for travel destinations. This provides a scientific basis for tourism diversion strategies. The largest population concentration in the URYB is the Chengdu-Chongqing urban agglomeration, which has a resident population of more than 47 million people (Zou et al. Citation2017; Pan et al. Citation2021; Zeng et al. Citation2022). Therefore, most people in the URYB are located in areas where heat waves occur. Through our research, not only during the heat wave but even when the temperature is higher, these people can choose to not go to other regions and countries but go to the whole mountain areas and parts of plateaus that are suitable for avoiding extremely high temperatures. Therefore, we suggest that the government formulate appropriate tourism-promotion strategies for these areas, strengthen the construction of tourism infrastructure, and consider the protection and construction of landscapes.
Our findings provide suitable areas for the elderly to maintain. They also reveal the policy value of regional differences in reducing heat wave effects. The elderly have less ability to adapt to climate and a greater demand for climate suitability (Nunes and Tan Citation2018). Therefore, we propose to develop health care and elderly care industries in these areas to further promote regional development.
Research limitations
In this study, we adopted the definition of a heat wave as being above 35°C and lasting 3 days (Zuo et al. Citation2015; Jedlovec, Crane, and Quattrochi Citation2017; Shiva, Chandler, and Kunkel Citation2019). This is because there is no precise definition of a heat wave (Li et al. Citation2022). Morever, this study is not as comprehensive and in-depth as the research on heat waves, but reveals the temporal and spatial variation pattern in URYB, and can connect the research of suitable days.
Only THI was used to characterize thermal comfort. Although this is not a comprehensive measure, it uses relative humidity and temperature to identify the avoid extreme high temperature areas, and thus, it is accurate (Orosa et al. Citation2014)。It also demonstrates another important use of thermal comfort for other research studies, providing a scientific basis for the regional mitigation of heat waves and other high temperature weather conditions.
Our study found that suitable days varied less across different landforms areas. This could be due to the fact that there are fewer suitable days and fewer continuous suitable days, and thus, the inter-annual variation is not significant. However, this study mainly explored the spatial differences in heatwaves and thermal comfort to reveal the mitigating effect on heatwaves in mountainous areas. Therefore, this research method can reflect the advantage of avoiding the extremely high temperatures of mountain areas and provide more options for the sustainable development of mountain areas.
Conclusions
From the perspective of heat wave mitigation, this study analyzed the changes in THI in different geomorphic areas of the URYB and discussed the effects of elevation, topographic relief, precipitation, vegetation area, and soil moisture on the number of suitable days based on THI.
Mountain areas have advantages, owing to their landforms, in mitigating heat waves. Moreover, altitude is a major factor, other than landform, in mountainous areas. There are obvious differences in the suitable days between landform areas. We identified whole mountain areas and parts of the plateau as the best locations for avoiding extremely high temperatures, which have more suitable monthly days than other areas. Our research provides a diversified path for the sustainable development of mountain industries and a scientific basis for tourism-diversion strategies. We suggest that whole mountain areas and parts of the plateau should be appropriate tourism-promotion strategies should be formulated, the construction of tourism infrastructure should be strengthened, and the protection and creation of landscapes should be considered. In addition, we suggest developing health care and elderly care industries in these areas to further promote their sustainable development.
Disclosure statement
No potential conflict of interest was reported by the author(s).
Correction Statement
This article has been corrected with minor changes. These changes do not impact the academic content of the article.
Additional information
Funding
References
- Amininia, K., B. Abad, V. Safarianzengir, A. GhaffariGilandeh, and B. Sobhani. 2020. “Investigation and Analysis of Climate Comfort on People Health Tourism in Ardabil Province, Iran.” Air Quality, Atmosphere, & Health 13 (11): 1293–13. doi:10.1007/s11869-020-00883-x.
- An, N., and Z. Y. Zuo. 2021. “Investigating the Influence of Synoptic Circulation Patterns on Regional Dry and Moist Heat Waves in North China.” Climate Dynamics 57 (3–4): 1227–1240. doi:10.1007/s00382-021-05769-x.
- Bai, L., G. Q. Ding, S. H. Gu, P. Bi, B. D. Su, D. H. Qin, G. Z. Xu, and Q. Y. Liu. 2014. “The Effects of Summer Temperature and Heat Waves on heat-related Illness in a Coastal City of China, 2011-2013.” Environmental Research 132: 212–219. doi:10.1016/j.envres.2014.04.002.
- Ban, J., W. Y. Shi, L. L. Cui, X. Liu, C. Jiang, L. Y. Han, R. Wang, and T. T. Li. 2019. “Health-risk Perception and Its Mediating Effect on Protective Behavioral Adaptation to Heat Waves.” Environmental Research 172: 27–33. doi:10.1016/j.envres.2019.01.006.
- Bostan, D. C., A. Timofte, and L. Leontie. 2011. “TEMPERATURE-HUMIDITY Index. Recent Meteorological Measurements in the Moldavia Region.” Journal of Environmental Protection and Ecology 12 (3A): 1592–1597.
- Breshears, D. D., J. B. Fontaine, K. X. Ruthrof, J. P. Field, X. Feng, J. R. Burger, D. J. Law, J. Kala, and G. E. S. Hardy. 2021. “Underappreciated Plant Vulnerabilities to Heat Waves.” New Phytologist 231 (1): 32–39. doi:10.1111/nph.17348.
- Brown, R. D., J. Vanos, N. Kenny, and S. Lenzholzer. 2015. “Designing Urban Parks that Ameliorate the Effects of Climate Change.” Landscape and Urban Planning 138: 118–131. doi:10.1016/j.landurbplan.2015.02.006.
- Chen, R. S., C. T. Han, J. F. Liu, Y. Yang, Z. W. Liu, L. Wang, and E. S. Kang. 2018. “Maximum Precipitation Altitude on the Northern Flank of the Qilian Mountains, Northwest China.” Hydrology Research 49 (5): 1696–1710. doi:10.2166/nh.2018.121.
- Cheng, W. M., C. H. Zhou, H. X. Chai, S. M. Zhao, H. J. Liu, and Z. P. Zhou. 2011. “Research and Compilation of the Geomorphologic Atlas of the People’s Republic of China (1:1,000,000).” Journal of Geographical Sciences 21 (1): 89–100. doi:10.1007/s11442-011-0831-z.
- Cheng, V., E. Ng, C. Chan, and B. Givoni. 2012. “Outdoor Thermal Comfort Study in a sub-tropical Climate: A Longitudinal Study Based in Hong Kong.” International Journal of Biometeorology 56 (1): 43–56. doi:10.1007/s00484-010-0396-z.
- Chenghu, Z., C. Weiming, Q. Jinkai, L. I. Bingyuan, and Z. Baiping. 2009. “Research on the Classification System of Digital Land Geomorphology of 1: 1 000 000 in China.” Geo-information Science 11 (6): 707–724.
- Corona-Lozada, M. C., S. Morin, and P. Choler. 2019. “Drought Offsets the Positive Effect of Summer Heat Waves on the Canopy Greenness of Mountain Grasslands.” Agricultural and Forest Meteorology 276: 107617.
- Cremonese, E., G. Filippa, M. Galvagno, C. Siniscalco, L. Oddi, U. M. Di Cella, and M. Migliavacca. 2017. “Heat Wave Hinders Green Wave: The Impact of Climate Extreme on the Phenology of a Mountain Grassland.” Agricultural and Forest Meteorology 247: 320–330. doi:10.1016/j.agrformet.2017.08.016.
- Djongyang, N., R. Tchinda, and D. Njomo. 2010. “Thermal Comfort: A Review Paper.” Renewable & Sustainable Energy Reviews 14 (9): 2626–2640. doi:10.1016/j.rser.2010.07.040.
- Du, J., C. Sun, Q. K. Xiao, X. Chen, and J. Liu. 2020. “Field Assessment of Winter Outdoor 3-D Radiant Environment and Its Impact on Thermal Comfort in a Severely Cold Region.” Science of the Total Environment 709: 136175. doi:10.1016/j.scitotenv.2019.136175.
- Endler, C., and A. Matzarakis. 2011. “Climate and Tourism in the Black Forest during the Warm Season.” International Journal of Biometeorology 55 (2): 173–186. doi:10.1007/s00484-010-0323-3.
- Falasca, S., V. Ciancio, F. Salata, I. Golasi, F. Rosso, and G. Curci. 2019. “High Albedo Materials to Counteract Heat Waves in Cities: An Assessment of Meteorology, Buildings Energy Needs and Pedestrian Thermal Comfort.” Building and Environment 163: 106242. doi:10.1016/j.buildenv.2019.106242.
- Fang, Y. P., and B. Ying. 2016. “Spatial Distribution of Mountainous Regions and Classifications of Economic Development in China.” Journal of Mountain Science 13 (6): 1120–1138. doi:10.1007/s11629-015-3714-4.
- Foehn, A., J. G. Hernandez, B. Schaefli, and G. De Cesare. 2018. “Spatial Interpolation of Precipitation from Multiple Rain Gauge Networks and Weather Radar Data for Operational Applications in Alpine Catchments.” Journal of Hydrology 563: 1092–1110. doi:10.1016/j.jhydrol.2018.05.027.
- Gao, C., K. Kuklane, F. Wang, and I. Holmer. 2012. “Personal Cooling with Phase Change Materials to Improve Thermal Comfort from a Heat Wave Perspective.” Indoor Air 22 (6): 523–530. doi:10.1111/j.1600-0668.2012.00778.x.
- Golshan, T., S. Lande, K. Nickfardjam, S. Cohensedgh, Y. Roitblat, L. Nehuliaieva, D. Khabie, et al. 2021. “Thermal Comfort in School Classes in the Era of Global Warming: A Prospective Multicenter Study.” Journal of School Health 91 (2): 146–154. doi:10.1111/josh.12986.
- He, B. J., J. S. Wang, H. M. Liu, and G. Ulpiani. 2021. “Localized Synergies between Heat Waves and Urban Heat Islands: Implications on Human Thermal Comfort and Urban Heat Management.” Environmental Research 193: 110584.
- Heo, S., M. L. Bell, and J. T. Lee. 2019. “Comparison of Health Risks by Heat Wave Definition: Applicability of wet-bulb Globe Temperature for Heat Wave Criteria.” Environmental Research 168: 158–170. doi:10.1016/j.envres.2018.09.032.
- Hou, W. J., J. B. Gao, S. H. Wu, and E. F. Dai. 2015. “Interannual Variations in Growing-Season NDVI and Its Correlation with Climate Variables in the Southwestern Karst Region of China.” Remote Sensing 7 (9): 11105–11124. doi:10.3390/rs70911105.
- Hu, K. J., X. C. Yang, J. M. Zhong, F. R. Fei, and J. G. Qi. 2017. “Spatially Explicit Mapping of Heat Health Risk Utilizing Environmental and Socioeconomic Data.” Environmental Science & Technology 51 (3): 1498–1507. doi:10.1021/acs.est.6b04355.
- Huang, C. H., H. H. Tsai, and H. C. Chen. 2020. “Influence of Weather Factors on Thermal Comfort in Subtropical Urban Environments.” Sustainability 12 (5): 2001.
- Jedlovec, G., D. Crane, and D. Quattrochi. 2017. “Urban Heat Wave Hazard and Risk Assessment.” Results in Physics 7: 4294–4295. doi:10.1016/j.rinp.2017.10.056.
- Jin, G., X. Z. Deng, X. D. Zhao, B. S. Guo, and J. Yang. 2018. “Spatiotemporal Patterns in Urbanization Efficiency within the Yangtze River Economic Belt between 2005 and 2014.” Journal of Geographical Sciences 28 (8): 1113–1126. doi:10.1007/s11442-018-1545-2.
- Jin, H., S. Q. Liu, and J. Kang. 2019. “Thermal Comfort Range and Influence Factor of Urban Pedestrian Streets in Severe Cold Regions.” Energy and Buildings 198: 197–206. doi:10.1016/j.enbuild.2019.05.054.
- Katavoutas, G., and D. Founda. 2019. “Response of Urban Heat Stress to Heat Waves in Athens (1960-2017).” Atmosphere 10 (9): 483. doi:10.3390/atmos10090483.
- Lee, S. H., J. E. Kang, C. S. Park, D. K. Yoon, and S. Yoon. 2020. “Multi-risk Assessment of Heat Waves under Intensifying Climate Change Using Bayesian Networks.” International Journal of Disaster Risk Reduction 50: 101704. doi:10.1016/j.ijdrr.2020.101704.
- Li, B., B. Pan, and J. Han. 2008. “Basic Terrestrial Geomorphological Types in China and Their Circumscriptions.” Quaternary Sciences 28 (4): 535–543.
- Li, J. R., P. Guo, Y. L. Sun, Z. F. Liu, X. K. Zhang, and X. R. Pei. 2022. “Population Exposure Changes to One Heat Wave and the Influencing Factors Using Mobile Phone Data-A Case Study of Zhuhai City, China.” Sustainability 14 (2): 997.
- Lim, Y. H., K. S. Lee, H. J. Bae, D. Kim, H. Yoo, S. Park, and Y. C. Hong. 2019. “Estimation of heat-related Deaths during Heat Wave Episodes in South Korea (2006-2017).” International Journal of Biometeorology 63 (12): 1621–1629. doi:10.1007/s00484-019-01774-2.
- Liu, Y. S., Y. Liu, Y. F. Chen, and H. L. Long. 2010. “The Process and Driving Forces of Rural Hollowing in China under Rapid Urbanization.” Journal of Geographical Sciences 20 (6): 876–888. doi:10.1007/s11442-010-0817-2.
- Liu, S. G., Y. Yang, B. Deng, Y. Zhong, L. Wen, W. Sun, Z. W. Li, et al. 2021. “Tectonic Evolution of the Sichuan Basin, Southwest China.” Earth-Science Reviews 213: 103470.
- Lu, C. H., J. X. Ye, S. T. Wang, M. Yang, Q. Q. Li, W. Y. He, Y. J. Qin, J. X. Cai, and J. Mao. 2020. “An Unusual Heat Wave in North China during Midsummer, 2018.” Frontiers in Earth Science 8. doi:10.3389/feart.2020.00238.
- Luo, M., and N. C. Lau. 2021. “Increasing Human-Perceived Heat Stress Risks Exacerbated by Urbanization in China: A Comparative Study Based on Multiple Metrics.” Earths Future 9 (7). doi:10.1029/2020EF001848.
- Ma, Y. J., L. Y. Zuo, J. B. Gao, Q. Liu, and L. L. Liu. 2021. “The Karst NDVI Correlation with Climate and Its BAS-BP Prediction Based on Multiple Factors.” Ecological Indicators 132: 108254.
- Mangone, G., S. R. Kurvers, and P. G. Luscuere. 2014. “Constructing Thermal Comfort: Investigating the Effect of Vegetation on Indoor Thermal Comfort through a Four Season Thermal Comfort quasi-experiment.” Building and Environment 81: 410–426. doi:10.1016/j.buildenv.2014.07.019.
- Matusiak, M. 2010. “Thermal Comfort Index as a Method of Assessing the Thermal Comfort of Textile Materials.” Fibres & Textiles in Eastern Europe 18 (2): 45–50.
- Mayer, H., J. Holst, P. Dostal, F. Imbery, and D. Schindler. 2008. “Human Thermal Comfort in Summer within an Urban Street Canyon in Central Europe.” Meteorologische Zeitschrift 17 (3): 241–250. doi:10.1127/0941-2948/2008/0285.
- Meehl, G. A., and C. Tebaldi. 2004. “More Intense, More Frequent, and Longer Lasting Heat Waves in the 21st Century.” Science 305 (5686): 994–997. doi:10.1126/science.1098704.
- Miura, J., M. Demura, K. Nishi, and S. Oishi. 2020. “Thermal Comfort Measurement Using thermal-depth Images for Robotic Monitoring.” Pattern Recognition Letters 137: 108–113. doi:10.1016/j.patrec.2019.02.014.
- Morecroft, M. D., S. Duffield, M. Harley, J. W. Pearce-Higgins, N. Stevens, O. Watts, and J. Whitaker. 2019. “Measuring the Success of Climate Change Adaptation and Mitigation in Terrestrial Ecosystems.” Science 366 (6471): 1329–+. doi:10.1126/science.aaw9256.
- Navarro-Estupinan, J., A. Robles-Morua, E. R. Vivoni, J. E. Zepeda, J. A. Montoya, and V. S. Verduzco. 2018. “Observed Trends and Future Projections of Extreme Heat Events in Sonora, Mexico.” International Journal of Climatology 38 (14): 5168–5181. doi:10.1002/joc.5719.
- Negi, V. S., R. K. Maikhuri, D. Pharswan, S. Thakur, and P. P. Dhyani. 2017. “Climate Change Impact in the Western Himalaya: People’s Perception and Adaptive Strategies.” Journal of Mountain Science 14 (2): 403–416. doi:10.1007/s11629-015-3814-1.
- Nunes, A. R., and M. P. Tan. 2018. “The Contribution of Assets to Adaptation to Extreme Temperatures among Older Adults.” Plos One 13 (11): e0208121. doi:10.1371/journal.pone.0208121.
- Oleson, K. W., G. B. Anderson, B. Jones, S. A. McGinnis, and B. Sanderson. 2018. “Avoided Climate Impacts of Urban and Rural Heat and Cold Waves over the US Using Large Climate Model Ensembles for RCP8.5 and RCP4.5.” Climatic Change 146 (3–4): 377–392. doi:10.1007/s10584-015-1504-1.
- Oliveira, S., and H. Andrade. 2007. “An Initial Assessment of the Bioclimatic Comfort in an Outdoor Public Space in Lisbon.” International Journal of Biometeorology 52 (1): 69–84. doi:10.1007/s00484-007-0100-0.
- Orosa, J. A., A. M. Costa, A. Rodriguez-Fernandez, and G. Roshan. 2014. “Effect of Climate Change on Outdoor Thermal Comfort in Humid Climates.” Journal of Environmental Health Science and Engineering 12. doi:10.1186/2052-336X-12-46.
- Pan, H. Z., C. Yang, L. R. Quan, and L. H. Liao. 2021. “A New Insight into Understanding Urban Vitality: A Case Study in the Chengdu-Chongqing Area Twin-City Economic Circle, China.” Sustainability 13 (18). doi:10.3390/su131810068.
- Parente, J., M. G. Pereira, M. Amraoui, and E. M. Fischer. 2018. “Heat Waves in Portugal: Current Regime, Changes in Future Climate and Impacts on Extreme Wildfires.” Science of the Total Environment 631-632: 534–549. doi:10.1016/j.scitotenv.2018.03.044.
- Piticar, A. 2018. “Changes in Heat Waves in Chile.” Global and Planetary Change 169: 234–246. doi:10.1016/j.gloplacha.2018.08.007.
- Rasilla, D., F. Allende, A. Martilli, and F. Fernandez. 2019. “Heat Waves and Human Well-Being in Madrid (Spain).” Atmosphere 10 (5): 288. doi:10.3390/atmos10050288.
- Segnalini, M., U. Bernabucci, A. Vitali, A. Nardone, and N. Lacetera. 2013. “Temperature Humidity Index Scenarios in the Mediterranean Basin.” International Journal of Biometeorology 57 (3): 451–458. doi:10.1007/s00484-012-0571-5.
- Shi, D. C., J. Y. Song, R. Q. Du, and P. W. Chan. 2021. “Dual Challenges of Heat Wave and Protective facemask-induced Thermal Stress in Hong Kong.” Building and Environment 206: 108317. doi:10.1016/j.buildenv.2021.108317.
- Shiva, J. S., D. G. Chandler, and K. E. Kunkel. 2019. “Localized Changes in Heat Wave Properties across the United States.” Earths Future 7 (3): 300–319. doi:10.1029/2018EF001085.
- Singh, S., R. K. Mall, and N. Singh. 2021. “Changing spatio-temporal Trends of Heat Wave and Severe Heat Wave Events over India: An Emerging Health Hazard.” International Journal of Climatology 41 (S1): E1831–E1845. doi:10.1002/joc.6814.
- Spagnolo, J., and R. de Dear. 2003. “A Field Study of Thermal Comfort in Outdoor and semi-outdoor Environments in Subtropical Sydney Australia.” Building and Environment 38 (5): 721–738.
- Sun, Q. H., C. Y. Miao, A. AghaKouchak, and Q. Y. Duan. 2017. “Unraveling Anthropogenic Influence on the Changing Risk of Heat Waves in China.” Geophysical Research Letters 44 (10): 5078–5085. doi:10.1002/2017GL073531.
- Tan, J. G., Y. F. Zheng, X. Tang, C. Y. Guo, L. P. Li, G. X. Song, X. R. Zhen, et al. 2010. “The Urban Heat Island and Its Impact on Heat Waves and Human Health in Shanghai.” International Journal of Biometeorology 54 (1): 75–84. doi:10.1007/s00484-009-0256-x.
- Tartarini, F., S. Schiavon, T. Cheung, and T. Hoyt. 2020. “CBE Thermal Comfort Tool: Online Tool for Thermal Comfort Calculations and Visualizations.” Softwarex 12: 100563. doi:10.1016/j.softx.2020.100563.
- Top, S., D. Milosevic, S. Caluwaerts, R. Hamdi, and S. Savic. 2020. “Intra-urban Differences of Outdoor Thermal Comfort in Ghent on Seasonal Level and during record-breaking 2019 Heat Wave.” Building and Environment 185: 107103.
- Usowicz, B., J. Lipiec, M. Lukowski, and J. Slominski. 2021. “Improvement of Spatial Interpolation of Precipitation Distribution Using Cokriging Incorporating Rain-Gauge and Satellite (SMOS) Soil Moisture Data.” Remote Sensing 13 (5): 1039.
- Wang, W. W., W. Zhou, and D. L. Chen. 2014. “Summer High Temperature Extremes in Southeast China: Bonding with the El Nino-Southern Oscillation and East Asian Summer Monsoon Coupled System.” Journal of Climate 27 (11): 4122–4138.
- Wang, W., W. Zhou, X. Li, X. Wang, and D. Wang. 2016. “Synoptic-scale Characteristics and Atmospheric Controls of Summer Heat Waves in China.” Climate Dynamics 46 (9–10): 2923–2941.
- Wang, Y., A. Chan, G. N.-C. Lau, Q. Li, Y. Yang, and S. H. L. Yim. 2019. “Effects of Urbanization and Global Climate Change on Regional Climate in the Pearl River Delta and Thermal Comfort Implications.” International Journal of Climatology 39 (6): 2984–2997.
- Wang, X. Y., H. N. Liu, S. G. Miao, Q. G. Wu, N. Zhang, and F. X. Qiao. 2020. “Effectiveness of Urban Hydrological Processes in Mitigating Urban Heat Island and Human Thermal Stress during a Heat Wave Event in Nanjing, China.” Journal of Geophysical Research-Atmospheres 125 (24): e2020JD033275.
- Wang, J. Y., C. O. Delang, G. L. Hou, L. Gao, and X. X. Lu. 2021a. “Net Primary Production Increases in the Yangtze River Basin within the Latest Two Decades.” Global Ecology and Conservation 26: e01497.
- Wang, X. X., Z. H. Di, M. Li, and Y. J. Yao. 2021b. “Satellite-Derived Variation in Burned Area in China from 2001 to 2018 and Its Response to Climatic Factors.” Remote Sensing 13 (7): 1287.
- Wong, A. S. W., Y. Li, and K. W. Yeung (2002). “The Influence of Thermal Comfort Perception on Consumer’s Preferences to Sportswear.” 10th International Conference on Environmental Ergonomics, Fukuoka, JAPAN.
- Wu, Y. Y., Y. X. Song, and T. T. Yu. 2019. “Spatial Differences in China’s Population Aging and Influencing Factors: The Perspectives of Spatial Dependence and Spatial Heterogeneity.” Sustainability 11 (21): 5959.
- Yang, J., H. Z. Liu, C. Q. Ou, G. Z. Lin, Y. Ding, Q. Zhou, J. C. Shen, and P. Y. Chen. 2013. “Impact of Heat Wave in 2005 on Mortality in Guangzhou, China.” Biomedical and Environmental Sciences 26 (8): 647–654.
- Yao, T., and Q. Zhang. 2014. “Study on land-surface Albedo over Different Types of Underlying Surfaces in North China.” Acta Physica Sinica 63 (089201-1-089201–9).
- Yao, J. Q., Q. Yang, W. Y. Mao, Y. Zhao, and X. B. Xu. 2016. “Precipitation trend-Elevation Relationship in Arid Regions of the China.” Global and Planetary Change 143: 1–9.
- Ye, Z. Q., S. Song, and R. F. Zhong. 2022. “Temporal and Spatial Evolution of Climate Comfort and Population Exposure in Guangdong Province in the Last Half Century.” Atmosphere 13 (3): 502.
- Yin, J. F., Y. F. Zheng, R. J. Wu, J. G. Tan, D. X. Ye, and W. Wang. 2012. “An Analysis of Influential Factors on Outdoor Thermal Comfort in Summer.” International Journal of Biometeorology 56 (5): 941–948.
- You, Q., Z. Jiang, L. Kong, Z. Wu, Y. Bao, S. Kang, and N. Pepin. 2017. “A Comparison of Heat Wave Climatologies and Trends in China Based on Multiple Definitions.” Climate Dynamics 48 (11): 3975–3989.
- Yu, H. J., L. Liu, B. Yang, and M. X. Lan. 2020. “Crime Prediction with Historical Crime and Movement Data of Potential Offenders Using a Spatio-Temporal Cokriging Method.” Isprs International Journal of Geo-Information 9 (12): 732.
- Zeng, H. B., B. L. Shao, G. Q. Bian, H. B. Dai, and F. Y. Zhou. 2022. “Analysis of Influencing Factors and Trend Forecast of CO2 Emission in Chengdu-Chongqing Urban Agglomeration.” Sustainability 14 (3): 1167.
- Zhang, Y. X., Y. K. Wang, B. Fu, A. M. Dixit, S. Chaudhary, and S. Wang. 2020. “Impact of Climatic Factors on Vegetation Dynamics in the Upper Yangtze River Basin in China.” Journal of Mountain Science 17 (5): 1235–1250.
- Zhou, Y., and J. M. Shepherd. 2010. “Atlanta’s Urban Heat Island under Extreme Heat Conditions and Potential Mitigation Strategies.” Natural Hazards 52 (3): 639–668.
- Zou, H., X. J. Duan, L. Ye, and L. Wang. 2017. “Locating Sustainability Issues: Identification of Ecological Vulnerability in Mainland China’s Mega-Regions.” Sustainability 9 (7): 1179.
- Zuo, J., S. Pullen, J. Palmer, H. Bennetts, N. Chileshe, and T. Ma. 2015. “Impacts of Heat Waves and Corresponding Measures: A Review.” Journal of Cleaner Production 92: 1–12.