?Mathematical formulae have been encoded as MathML and are displayed in this HTML version using MathJax in order to improve their display. Uncheck the box to turn MathJax off. This feature requires Javascript. Click on a formula to zoom.
ABSTRACT
In recent years, there has been widespread concern regarding the carbon footprint (CF) of food waste due to the key impact of CF on climate change, particularly as China’s food waste is rising with its economic development. China has the largest scale of higher education in the world, and the amount of food waste in university canteens is considerable and cannot be ignored. This study attempts to assess the carbon footprint (CF) of food waste at Chinese universities for the first time based on a national survey. It is estimated that 1.55 million tons of food were wasted in Chinese university canteens in 2018, based on 9,192 samples covering 29 provinces in China. The associated CF was 2.51 Mt CO2eq. The top two food categories contributing to the total CF were meat and grains, accounting for 46.28% and 36.52%, respectively. Furthermore, the location of the university was significantly associated with the CF of plate waste. It also indicated that household income, meal satisfaction, sex, education, meal days, and food-saving campaigns were important factors influencing the CF of food waste. This study highlights areas that can help reduce the environmental impact of plate waste. It also provides targeted measures to reduce the associated CF of food waste in Chinese universities.
Introduction
It is widely cited that one-third of edible food produced for human consumption is lost or wasted (Gustafsson et al. Citation2011). The “Food Waste Index Report” recently released by the United Nations Environment Programme (UNEP) shows that about 17% of food is wasted before being consumed (UNEP Citation2021). In contrast, hunger remains a global issue, raising ethical concerns. A recent report jointly released by the Food and Agriculture Organization (FAO) of the United Nations and other international organizations estimated that approximately 720–811 million people faced hunger in 2020 (FAO, IFAD, UNICEF, WFP and WHO Citation2021). Therefore, reducing food waste is critical to achieving the sustainable development goals of zero hunger and responsible consumption and production due to the limited options to increase food production. Previous studies have shown that food waste occurs mainly in high-income countries, where the problem is acute (Jeswani, Figueroa-Torres, and Azapagic Citation2021); however, attention must also be paid to developing countries where food waste is increasing rapidly, such as in China (Gao et al. Citation2021; Ogunmoroti et al. Citation2022). China is the largest food consumer in the world (Bai et al. Citation2020). Sustainably feeding a large population and achieving food security have been and remain priorities for China, given its limited resources to produce food (Xue et al. Citation2021). In addition, rapid urbanization and an increase in household income have resulted in a growing level of waste (Liu et al., Citation2013; Xu et al. Citation2020; Zhang et al. Citation2020), significantly affecting China’s food security (Qian et al., Citation2021). Therefore, it is necessary to focus on food waste among Chinese consumers and to provide empirical evidence from China.
Driven by increased incomes, China has seen dramatic growth in away-from-home food consumption (Bai et al. Citation2016; Liu et al. Citation2012). Previous studies have shown that consumers are more likely to waste food in dining places outside their homes (Xu et al. Citation2020). Given that the food service sector in China generates up to half of the food waste across the national food supply chain (Wang et al. Citation2017), there is a need to prioritize the reduction of food waste in out-of-home settings (Bai et al. Citation2016). Dining locations outside the home are diverse. Previous studies have focused mainly on food waste in hotels, restaurants, coffee shops, and other places (Gao et al. Citation2021; Pirani and Arafat Citation2016). However, in recent years, there has been a growing body of literature on food waste in educational institutions (Painter, Thondhlana, and Kua Citation2016; Pinto et al. Citation2018; Whitehair, Shanklin, and Brannon Citation2013). Understanding the contribution of food waste from university canteens is essential (Qian et al. Citation2022), not only due to the size of the sector, but also because university students are well-educated and expected to behave morally as future leaders to achieve sustainable development goals worldwide (Derqui, Fernandez, and Fayos Citation2018; Wu et al. Citation2019). The Ministry of Education of China reports that 41.83 million university students were enrolled in mainland Chinese universities in 2020 (Qian et al. Citation2021). Therefore, the amount of food waste generated by Chinese universities is considerable and cannot be ignored. However, studies on food waste in Chinese universities are rare.
This study aimed to assess the carbon footprint (CF) of food waste in Chinese universities and examine the factors leading to the CF of plate waste. This is important because food waste not only means that considerable resource input is wasted (Kummu et al. Citation2012; Wang, Yuan, and Tang Citation2021), but it also creates CFs that may significantly impact global warming. Food waste globally generates 3.3 gigatons of carbon dioxide, an equivalent of 7% of total greenhouse gas (GHG) emissions causing climate change (FAO Citation2019). If food waste were its own country, it would be the third largest carbon emitter in the world (UNEP Citation2021). Food systems, including food waste at the consumption stage, require immediate action and positive change when facing global climate change, which can adversely impact food systems via crop yields directly, and water availability and quality, pests and diseases, and pollination services indirectly. Furthermore, changing atmospheric carbon dioxide affects biomass and nutritional quality (Drewnowski et al. Citation2015). COP26 finalizes COP21 and maintains a goal of limiting global warming to 1.5°C. However, the world has not come close to this goal, and the window for achieving it is closing. Therefore, reducing food waste is critical for tackling global climate change (Ishangulyyev, Kim, and Lee Citation2019). As mentioned above, higher education institutions, including universities, play a leading role and take direct action to reduce CF (Zhang et al. Citation2021).
We can develop effective strategies by understanding the key factors affecting the CF of food waste. Therefore, there is an urgent need to conduct a study on food waste and the associated CF of universities, especially in a country such as China, which has the largest-scale higher education worldwide.
The contributions of this study are as follows: First, the data we used were from the only survey that covered Chinese universities nationally, laying a solid foundation for the food waste study and the associated CF study in university canteens in China. Although Wu et al. (Citation2019) and Zhang et al. (Citation2021) analyzed food waste in Chinese universities, their studies were based on small and limited samples from large cities, such as Beijing and Wuhan. Additionally, the CF of food waste was not the focus of these two studies. To the best of our knowledge, this study is the first to use a large-scale national survey in Chinese universities to assess the environmental impact of plate waste. Second, this study described the status of the CF of food waste more accurately. Although studies estimating the CF of food waste are growing (Scholz, Eriksson, and Strid Citation2015), the scarcity of solid data on the amount of food loss and waste is an obstacle to policymaking (FAO Citation2019). Previous studies have primarily focused on secondary data (Qian et al. Citation2021; Xue et al., Citation2017) rather than on direct food waste parameters (Dou and Toth Citation2020). Because first-hand data are relatively scarce, we obtained 9192 samples by cumulatively weighing more than 30,000 times in this study. The direct weighing method provides a more accurate picture of Chinese universities’ food waste-associated CFs. Third, it helps to take targeted measures to reduce the negative environmental effects of food waste. This study analyzes the total amount and composition of the CF of food waste in Chinese universities and identifies the key factors that affect the carbon footprint, thus providing a targeted strategy for effectively reducing the CF of food waste.
Materials and methods
Sample description
A nationwide plate waste survey was conducted between May and June 2018. provides basic information on the samples. According to student enrollment, we ranked the universities in every province, then randomly selected one university to represent that province (a total of 30 provinces in mainland China) and got 300–350 random samples from each university. Unfortunately, the survey in Henan Province failed due to unforeseen circumstances. Finally, we obtained 9,192 valid responses from 29 provinces in mainland China, making this the first nationwide study of plate waste at Chinese universities ().
Figure 1. List of the surveyed universities in China(GS(2020)4619).
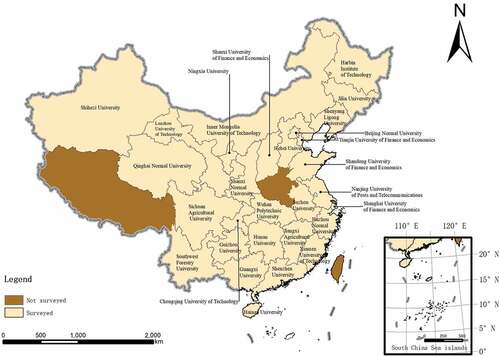
Table 1. Basic statistics of survey samples.
Survey design
A consent letter describing the research project and the anonymous survey was provided, as ethical approval for academic research is not required in China (Zhang et al. Citation2021). The investigators approached the randomly selected participants and asked for their permission to participate in the survey after the meal, allowing the individual to finish their meal without interruption (Qian et al. Citation2022). This approach reduces bias and the possibility of the individual changing their waste-discarding habits in line with the well-known social desirability effect or the observer effect. Upon permission, the investigators recorded the responses to the survey and measured plate waste.
The surveys were conducted from Monday to Sunday to capture potential variances in daily food waste, and the survey lasted two weeks at each of the universities surveyed. The survey only involved lunch and dinner because many students did not have breakfast in their canteens. This practice is consistent with the investigation of food waste at Stellenbosch University (Marais et al. Citation2017) and a study at Kansas State University (Whitehair, Shanklin, and Brannon Citation2013).
The questionnaire included general demographic information (i.e., age, sex, income, and educational level) and questions on consumers’ awareness of food waste campaigns, satisfaction rating of the meal, length of the meal, presence of others, and thoughts on plate waste (such as food safety concerns, moral concerns about food waste, and health concerns), which were developed in line with previous research on food waste (McCarthy and Liu Citation2017; Min, Wang, and Yu Citation2021; Wu et al. Citation2019). In addition, respondents were asked to rate their level of agreement with a statement using a five-point Likert scale and provide demographic information (Qian et al. Citation2021). Finally, the investigators measured and recorded the composition and weight of plate waste.
Food waste measurement and accuracy
Although accurate measurement of food waste is vital for research, the direct weighing method has seldom been used in prior studies because of budget and time constraints (Parizeau, von Massow, and Martin Citation2015; Wang, Yuan, and Tang Citation2021). The approaches used to assess the quantities and compositions of food waste include self-report in household surveys (Djekic et al. Citation2019; McCarthy and Liu Citation2017), weighing food (Wang et al. Citation2017), and kitchen diaries (Parfitt, Barthel, and Macnaughton Citation2010). However, the self-report approach may be unreliable because it depends on people’s recollections, and participants may give socially desirable responses (Dou and Toth Citation2020; Li et al. Citation2021). Therefore, this study used the direct weighing method because it is more objective, accurate, and reliable than the other methods (Qian et al. Citation2021). The investigators first purchased the food served in the canteen and weighed it using an electronic scale (with an accuracy of 0.01 g) to obtain standard meal weights. After the meal was consumed, the plate waste was classified and weighed (Wu et al. Citation2019; Xu et al. Citation2020). Finally, 9,192 valid questionnaires were obtained from the respondents after weighing more than 30,000 times, forming the first national-level database of food waste in Chinese universities.
In this paper, food waste is defined as edible food discarded at the point of consumption (FAO Citation2013), and inedible parts of the food, such as vegetable skins, bean dregs, and bones, are not included in the food waste category (Wang et al. Citation2017; Wang, Yuan, and Tang Citation2021). Furthermore, following previous studies, the food waste in this survey was limited to solid residues (Li et al. Citation2021). Thus, liquids such as cooking oils, soups, and drinks were excluded. Moreover, plate waste is grouped into the following categories: rice, wheat, pork, beef and mutton, poultry (e.g., chicken, duck, and goose), aquatic products (e.g., fish, shrimp, and shellfish), egg products, soy products, and vegetables, following previous work (Qian et al. Citation2021). These foods are the main food items in the Chinese daily diet and are prevalent in university canteens.
Carbon footprint analysis
Research that develops environmental footprint measures increases knowledge of the sustainability of food systems. The footprint concept is inspired by life cycle assessment (LCA), a tool that measures the environmental impacts of a product’s life cycle, taking a “cradle to grave” approach (Drewnowski et al. Citation2015). However, the traditional LCA method is complex and has some deficiencies (Plevin, Delucchi, and Creutzig Citation2014). Thus, in recent years, a new tool, the footprint, has emerged to assess sustainability and its components. The concept of a “footprint” describes human pressure on the planet or how human activities impose various types of burdens on Earth’s life-support systems (Vanham et al. Citation2019).
It is widely accepted that the CF concept was derived from studies on global warming potential (GWP) and was first defined by (Høgevold Citation2003). CF refers to the total amount of GHG emissions directly and indirectly caused by an activity or accumulated over a product’s life stages and is becoming a popular tool (Song, Semakula, and Fullana-I-Palmer Citation2018). As the food sector is seen as a carbon “hot spot” with opportunities for improvement (FAO Citation2019), there is increasing scholarly interest in estimating the environmental impact of food waste (Brancoli, Rousta, and Bolton Citation2017; Scholz, Eriksson, and Strid Citation2015). CF data can inform consumers about sustainable dietary choices and can be used in eco-labeling to support purchasing decisions (Clune, Crossin, and Verghese Citation2017). CF analysis has a much broader appeal than general LCA, as it is seen as a simplified LCA model. In addition, CF is a helpful tool to provide a baseline for evaluating the effects of future mitigation efforts.
Conversion method and the CF of food waste
Although some studies have attempted to measure the CF of food waste in university canteens, most have not considered the difference between cooked foods and raw foods, and the number of cooked foods is usually adopted as the standard weight (Wu et al. Citation2019; Zhang et al. Citation2021). However, food changes during the cooking process lead to less accurate data obtained using the above methods. Therefore, this study proposes converting the waste of cooked foods to raw foods using cooked-raw-food conversion coefficients to measure food waste accurately (Appendix A), as food loss during cooking inevitably occurs. In this study, cooked food was converted to raw food using the method proposed by Adelodun et al. (Citation2021) and Wang et al. (Citation2018). In addition, energy and material dissipation are involved, which increases carbon emissions. Therefore, the raw foods were further converted to agricultural products, following Cao et al. (Citation2014) and Wang et al. (Citation2018). It should be noted that the CF calculated only covers the process before consumers purchase food, and does not include the CF embedded in food preparation and cooking (Appendix B). The results are presented in .
Table 2. Conversion coefficients from cooked food to agricultural products.
The global warming potential (GWP), expressed in kg CO2eq/kg, was used in this study, following Clune, Crossin, and Verghese (Citation2017). provides the results for the key food categories.
Table 3. GWP of main food items.
Results
Scale and composition of food waste
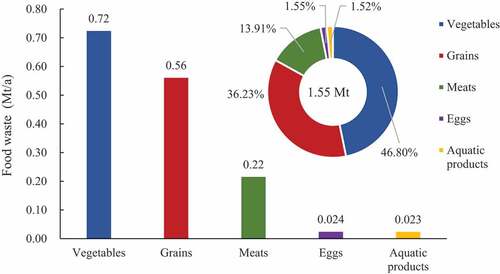
It is calculated that the average wastage generated by Chinese university students in canteens is 143.16 g/d per capita per meal after the conversion. Considering that the number of Chinese college students was about 40 million in 2018, and they usually spend 270 days in universities in a year, it is not difficult to calculate that the total amount of food waste in Chinese universities was 1.55 Mt in 2018. Regarding the composition of food waste, vegetables ranked first, accounting for 46.80% (0.72 Mt) of total waste. The grain waste ranked second, accounting for approximately 36.23% (0.56 Mt). Meat ranked third, with an annual scale of about 0.22 Mt, accounting for 13.91% of the total plate waste. It also found that the waste of eggs and aquatic products was the lowest, accounting for only 1.55% and 1.52% of the total food waste, respectively ().
Figure 2. Scale and composition of food waste in the university canteens.
Amount and composition of food waste CF
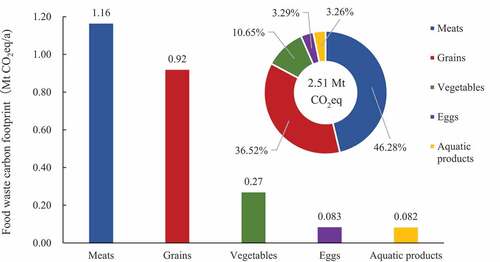
According to our estimation, the total CF of food waste in Chinese universities reached 2.51 Mt CO2eq in 2018, with a daily per capita CF of 233 g CO2eq/d. Meat waste had the highest CF, accounting for 46.28% of the total CF of food waste, followed by grains (36.52%) and vegetables (10.65%). Eggs and aquatic products accounted for 3.29% and 3.26%, respectively (). The CF of food waste is significantly different from plate waste weight owing to the different GWP values of food items (Scholz, Eriksson, and Strid Citation2015). For example, the average GWP of meats is 11.84 kg CO2eq/kg, which is 32 times the GWP of vegetables. Thus, although meat waste accounts for 13.91% of the total plate waste weight, it generates 46.28% of the total CF. On the contrary, vegetables account for 46.80% of the total plate waste, but only 10.65% of the total CF. Therefore, reducing the food waste of high-CF foods is effective for carbon emission reduction.
Figure 3. Amount and composition of plate waste CF in the university canteens.
Spatial characteristics of food waste CF
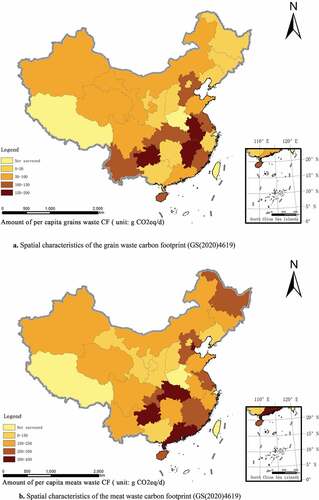
shows significant regional differences in CF of food waste at Chinese universities. The results indicate that regional economic development levels strongly influence food waste in China. In addition, plate waste is also related to staple food consumption patterns (Qian et al. Citation2021; Talhelm et al. Citation2014), as rice has high carbon intensity, combined with high levels of wastage. For example, Guangdong and Hubei provinces in southern China (mainly rice consumers) have the highest per capita plate waste CFs (407 and 374 g CO2eq/d, respectively). In contrast, Shanxi in northern China (mainly wheat consumers) wastes less than 1/5 the amount of Guangdong (77 g CO2eq/d). Guangdong, Hubei, Guizhou, and Tianjin are the top four (350–450 g CO2eq/d) provinces, followed by the central and eastern regions. The lower-CF regions are mainly in Northeast and Northwest China.
Figure 4. Spatial characteristics of plate waste carbon footprint.
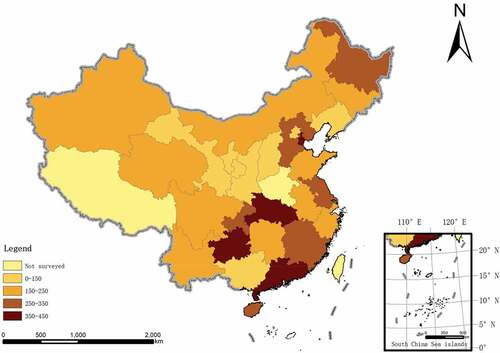
Changing students’ behaviors in economically developed regions that consume rice is more effective than other approaches in reducing the CF of food waste in university canteens. A spatial analysis of the CF of grain waste confirms this speculation. College students in southern rice-growing regions have a higher CF of grain waste than do northerners who consume wheat as the staple food (Appendix C). Moreover, considering that the proportion of CF produced by meat is quite large, this paper further compares the spatial distribution of the CF of meat waste. The results found that Heilongjiang and Hebei in the north and Guangdong, Fujian, and Hubei in the south had a higher CF of meat waste (Appendix C). However, overall, southern provinces have a higher average meat waste CF (210.15 g CO2eq/d) than do northern provinces (195.72 g CO2eq/d). This may be because the south is more economically developed and consumers have a higher level of consumption and waste, which has been confirmed by prior studies (Qian et al. Citation2022).
Relationship between CF and demographic, informational, and meal-related factors
The relationship between CF and demographics, meal satisfaction, awareness of food waste campaigns, and working days were also analyzed. The results indicated that the CF of food waste is associated with household income (). Further composition analysis shows that plate CF is mainly determined by meat waste, and the CF of meat waste of the highest income group is twice that of the lowest income group. However, the CFs of the other plate waste items among the different income groups were not significantly different. Therefore, household income plays a significant role in determining the CF of food waste in university canteens.
Figure 5. Income, meal satisfaction and carbon footprint of food waste (unit: g CO2eq/d).
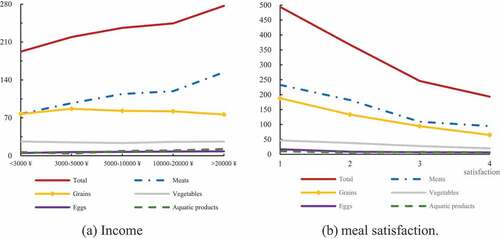
In addition, meal satisfaction influences the CF of food waste. For example, shows that as the meal satisfaction level increased, the plate CF significantly decreased, suggesting that satisfaction is a critical factor in reducing the CF of food waste. Moreover, the CF of meat, grains, and vegetables decreased more significantly than that of eggs and aquatic products when meal satisfaction increased. Therefore, meal satisfaction helps reduce the waste and corresponding CF of major food varieties in Chinese university canteens, confirming the findings of Lorenz, Hartmann, and Langen (Citation2017).
shows other factors that influence the CF of food waste. First, female university students have a higher plate waste CF (257 g CO2eq/d) than males (210 g CO2eq/d). Plate waste composition analysis revealed that the difference in grain waste contributed significantly to the CF gap between females and males. Wu et al. (Citation2019) also reported similar sex differences in plate waste weight. Therefore, this highlights the necessity of providing a smaller portion of staple food in the canteens to satisfy the needs of female students and reduce grain wastage and the corresponding CF.
Figure 6. Other factors affecting the carbon footprint of food waste (unit: g CO2eq/d).
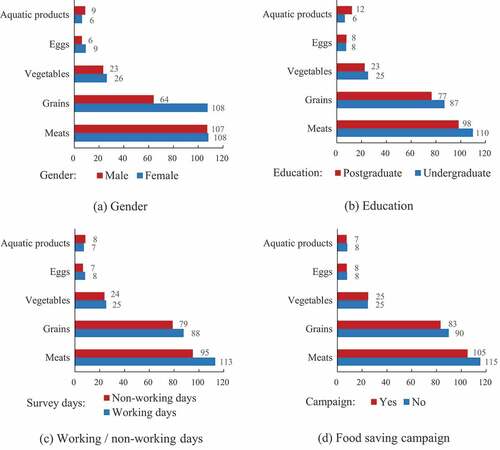
Second, education is an influential factor affecting the CF of food waste (e.g., postgraduates: 218 g CO2eq/d; undergraduates: 236 g CO2eq/d), confirming the findings of Mattar et al. (Citation2018).
Third, the CFs of food waste varied between working days and non-working days (working days: 241 g CO2eq/d; non-working days: 213 g CO2eq/d). A possible reason for this is that university students have a hectic lifestyle and a shorter mealtime during their working days (Painter, Thondhlana, and Kua Citation2016), which results in more plate waste. Thus, ensuring sufficient time for eating may be an effective measure to reduce CF.
Fourth, students familiar with food-saving campaigns (228 g CO2eq/d) generated less plate waste CF than those who did not know about these efforts (245 g CO2eq/d), indicating that food-saving campaigns contributed to the reduction in plate waste CF. Therefore, awareness campaigns could effectively reduce food waste in canteens, similar to studies from Whitehair, Shanklin, and Brannon (Citation2013) at Kansas State University in the USA and Pinto et al. (Citation2018) at Lisbon University in Portugal.
Discussion
Food waste and corresponding carbon footprint
Based on a large-scale survey of 29 universities in mainland China, some interesting phenomena were observed. First, homes produce the least amount of food waste per capita per meal, and we found that the segmentation of the away-from-home food consumption sector should be addressed to develop effective plate waste and CF reduction strategies. For example, shows that, on average, food consumption in university canteens generates less food waste than dining in restaurants (Wang et al. Citation2018; Xu et al. Citation2020). Moreover, the differences measured in CF were more significant than those in weight due to diverse dietary patterns and GWP values. For instance, people tend to order more animal products in restaurants to show generosity and hospitality (Bai et al. Citation2016) than in university canteens, resulting in more plate waste CF. Therefore, different measures should be adopted to deal with plate waste under different dining scenarios.
Table 4. A comparison of food waste weight among existing studies.
Second, this study shows heterogeneity in consumer characteristics and food-wasting behaviors. This indicates that effective food waste reduction solutions are likely to be based on diverse and mixed strategies. We found that the effectiveness of each solution was correlated with an individual’s sex, education, income, meal satisfaction, geographic location, and dining days. Therefore, different policies are needed to appeal to people based on their personal food waste experiences.
Third, compared with university students in Western countries, this study found that Chinese students waste less food in canteens and, consequently, have lower CF (). The possible reasons are as follows: food waste is positively related to economic factors, and China is still a developing country; Chinese university canteens provide a great variety of foods, which can significantly reduce food waste due to meal dissatisfaction; and the difference in cultures may also be responsible for the divergence. For thousands of years, frugality has been a virtue and wasting has been a source of shame in traditional Chinese culture. These factors cause the greatest differences in plate waste between Chinese and Western universities. However, it is worth noting that consumption of high-carbon-intensity foods, such as meat, will further increase as household income increases (Liu et al. Citation2009; Xu et al. Citation2020). Therefore, interventions are important to alleviate carbon emissions from food waste. The recommendations proposed below for reducing plate waste in Chinese university canteens may also be applicable in the west.
Potential mitigation strategies
When global food security is in danger, reducing food loss and food waste effectively achieves the 2030 Agenda for sustainable development. Concerns regarding food waste have spurred initiatives in China. For instance, the “Clean Your Plate” campaign was launched by an NGO in 2013 to raise awareness about food waste and encourage restaurants to reduce waste, such as by providing doggy bags and serving smaller dishes (Mirosa, Yip, and Lentz Citation2018). Additionally, the country’s top leadership issued strict regulations to reduce extravagance and waste at banquets for government officials (Wang et al. Citation2017). In 2021, China’s Anti-Food Waste Law came into force. Such top-down initiatives should have some effect on changing attitudes toward food waste. However, whether they effectively reduce waste in the catering industry’s institutional sector remains to be determined. Nevertheless, several findings from this study can help implement food waste reduction strategies and policies.
First, it is understood that shifting to a healthy and sustainable diet entails synergies and trade-offs between different types of footprints (He et al. Citation2019). For instance, foods with a higher nutrient density, such as meat and dairy, are associated with higher greenhouse gas emissions, and foods with a lower nutritional value (i.e., sweets) have a lower CF than many other foods (Drewnowski et al. Citation2015). Therefore, the consideration of environmental impacts needs to be linked to health.
Second, innovations in catering services can facilitate behavioral changes. For example, using a novel self-service meal option allows people to choose and weigh the food and pay by weight to reduce plate waste effectively, as saving money has generally been identified as the best motivator to reduce consumer food waste. Therefore, innovations to meet people’s demands and increase resource efficiency should be encouraged.
Third, it is suggested that foods should be offered in different portions (such as small, medium, and large) to meet the different needs of students. According to our survey, female students generally eat less than male students, especially grains. Therefore, standard offering is one of the reasons for the increase in plate waste. Previous research has also claimed that smaller servings help reduce self-reported plate waste in university canteens (Visschers et al., Citation2020).
Furthermore, the differences in plate waste between working and non-working days indicate that a speedy meal also causes extra plate waste. Therefore, it is suggested that modifying a tight lecture schedule and allowing reasonable mealtime for students can help reduce plate waste. In addition, slower eating is beneficial for students’ health and well-being. Moreover, it is suggested that follow-up and future studies on the association between plate waste and the dining atmosphere are needed to clarify the link, as this is not the focus of this paper.
Finally, educational programs or campaigns that define the right things to do and highlight the consequences of food waste positively influence students’ food-saving behavior (Kim et al. Citation2020). It would be helpful to remind students of the association between their behavior and environmental impact (Qian et al. Citation2022). For example, using CF labeling or “smart disposal bins” shows the weight of plate waste when people throw away food.
Limitations
The findings of this study have certain uncertainties and limitations. First, it did not include breakfast in the survey, underestimating the CF of food waste in university canteens. However, this may not be a severe problem, considering that university students generally do not eat breakfast in canteens, or if they do, the breakfast waste rate is low. Second, this study only investigates the dine-in plate waste in university canteens, and the food waste generated from takeaway and delivery food (which has recently become popular among students) is beyond the scope of this research. Therefore, this study may slightly underestimate the plate waste and CF in Chinese universities. Follow-up studies are needed to reflect the overall food consumption in universities. Third, there is still room for further optimization of food waste measurements and the corresponding CF in Chinese university canteens. Finally, the survey was conducted in May and June 2018 owing to time and cost limitations, without fully considering seasonal differences, which may affect the accuracy of the estimation results. However, considering that most ingredients can be supplied year-round, the effect is limited. Another possible shortcoming of this study is that it did not consider the spatial distribution of colleges in China. Therefore, it is more reasonable to calculate provincial totals and then aggregate them. However, only one university was investigated in one province, and an accurate weight could not be determined. Furthermore, we believe that this is a future direction for measuring food waste and the associated CF in follow-up studies.
Conclusions
Based on a survey of 29 universities in 29 provinces in mainland China, and using the data obtained by the direct weighing method, this study calculated the scale of food waste in Chinese universities on a national level, and the CF of lost food was further measured. The main findings are as follows: (1) The total amount of food waste in Chinese university canteens reached 1.55 Mt in 2018, and vegetables and grains were the highest, accounting for 46.80% and 36.23% of the total waste, respectively. (2) The total CF of plate waste in Chinese university canteens has reached 2.51 Mt CO2eq. In terms of CF, meat ranks first and grains rank second, accounting for 46.28% and 36.52% of the total carbon footprint of food waste, respectively. (3) University location is significantly associated with plate waste, which is highly consistent with China’s regional economic development variations. (4) The results indicate that the CF of food waste is associated with household income, meal satisfaction, sex, education, meal days, and food-saving campaigns. This study helps to better understand the characteristics of plate waste and its environmental costs in Chinese universities, as well as to provide targeted measures for reducing food waste and its associated CF.
Disclosure statement
No potential conflict of interest was reported by the author(s).
Additional information
Funding
References
- Adelodun, B., S. H. Kim, G. Odey, and K. S. Choi. 2021. “Assessment of Environmental and Economic Aspects of Household Food Waste Using a New Environmental-Economic Footprint (EN-EC) Index: A Case Study of Daegu, South Korea.” The Science of the Total Environment 776: 1. doi:10.1016/j.scitotenv.2021.145928.
- Bai, Z., G. Schmidt-Traub, J. Xu, L. Liu, X. Jin, and L. Ma. 2020. “A Food System Revolution for China in the Post-Pandemic World.” Resources, Environment and Sustainability 2: 100013. doi:10.1016/j.resenv.2020.100013.
- Bai, J., C. Zhang, T. Wahl, and J. Seale Jr. 2016. “Dining Out, the Missing Food Consumption in China.” Applied Economics Letters 23 (15): 1084–14.
- Brancoli, P., K. Rousta, and K. Bolton. 2017. “Life Cycle Assessment of Supermarket Food Waste.” Resources, Conservation and Recycling 118: 39–46.
- Cao, S. Y., G. D. Xie, W. H. Chen, and H. Guo. 2014. “Ecological Footprint of Raw and Derived Agricultural Products.” Journal of Natural Resources 29 (8): 1336–1344.
- Chen, C., A. Chaudhary, and A. Mathys. 2020. “Nutritional and Environmental Losses Embedded in Global Food Waste.” Resources, Conservation and Recycling 160: 104912. doi:10.1016/j.resconrec.2020.104912.
- Clune, S., E. Crossin, and K. Verghese. 2017. “Systematic Review of Greenhouse Gas Emissions for Different Fresh Food Categories.” Journal of Cleaner Production 140: 766–783.
- Derqui, B., V. Fernandez, and T. Fayos. 2018. “Towards More Sustainable Food Systems. Addressing Food Waste at School Canteens.” Appetite 129: 1–11.
- Djekic, I., Z. Miloradovic, S. Djekic, and I. Tomasevic. 2019. “Household Food Waste in Serbia–attitudes, Quantities and Global Warming Potential.” Journal of Cleaner Production 229: 44–52.
- Dou, Z., and J. D. Toth. 2020. “Global Primary Data on Consumer Food Waste: Rate and Characteristics—a Review.” Resources, Conservation and Recycling 168: 105332. doi:10.1016/j.resconrec.2020.105332.
- Drewnowski, A., C. D. Rehm, A. Martin, E. O. Verger, M. Voinnesson, and P. Imbert. 2015. “Energy and Nutrient Density of Foods in Relation to Their Carbon Footprint.” The American Journal of Clinical Nutrition 101 (1): 184–191.
- Ellison, B., O. Savchenko, C. J. Nikolaus, and B. R. Duff. 2019. “Every Plate Counts: Evaluation of a Food Waste Reduction Campaign in a University Dining Hall.” Resources, Conservation and Recycling 144: 276–284.
- FAO. 2013. Food Wastage Footprint: Impacts on Natural Resources. Rome: FAO.
- FAO. 2019. The State of Food and Agriculture .2019, Moving Forward on Food Loss and Waste Reduction. Rome: Food and Agriculture Organization of the United Nations. http://www.fao.org/publications/sofa/en/.
- FAO, IFAD, UNICEF, WFP and WHO. 2021. The State of Food Security and Nutrition in the World 2021. Rome: FAO. Transforming Food Systems for Food Security, Improved Nutrition and Affordable Healthy Diets for All
- Ferreira, M., M. L. Martins, and A. Rocha. 2013. “Food Waste as an Index of Food Service Quality.” British Food Journal 115 (11): 1628–1637.
- Gao, S., J. Bao, R. Li, X. Liu, and C. Wu. 2021. “Drivers and Reduction Solutions of Food Waste in the Chinese Food Service Business.” Sustainable Production and Consumption 26: 78–88.
- Gustafsson, J., C. Cederberg, U. Sonesson, R. van Otterdijk, and A. Meybeck. 2011. Global Food Losses and Food Waste. Rome, Italy: Food and Agriculture Organization(FAO).
- He, P., G. Baiocchi, K. Feng, K. Hubacek, and Y. Yu. 2019. “Environmental Impacts of Dietary Quality Improvement in China.” Journal of Environmental Management 240: 518–526.
- Høgevold, N. M. 2003. “A Corporate Effort Towards a Sustainable Business Model: A Case Study from the Norwegian Furniture Industry.” International Journal of Operations & Production Management 23 (4): 392–400.
- Ishangulyyev, R., S. Kim, and S. H. Lee. 2019. “Understanding Food Loss and Waste: Why are We Losing and Wasting Food?” Foods 8 (8): 297. doi:10.3390/foods8080297.
- Jeswani, H. K., G. Figueroa-Torres, and A. Azapagic. 2021. “The Extent of Food Waste Generation in the UK and Its Environmental Impacts.” Sustainable Production and Consumption 26: 532–547.
- Kim, J., S. Rundle-Thiele, K. Knox, K. Burke, and S. Bogomolova. 2020. “Consumer Perspectives on Household Food Waste Reduction Campaigns.” Journal of Cleaner Production 243 (10): 1–10.
- Kummu, M., H. De Moel, M. Porkka, S. Siebert, O. Varis, and P. J. Ward. 2012. “Lost Food, Wasted Resources: Global Food Supply Chain Losses and Their Impacts on Freshwater, Cropland, and Fertiliser Use.” The Science of the Total Environment 438: 477–489.
- Liu, Y., S. Cheng, X. Liu, X. Cao, L. Xue, and G. Liu. 2016. “Plate waste in school lunch programs in Beijing, China.” Sustainability 8 (12): 1288. doi:10.3390/su8121288.
- Liu, J., J. Lundqvist, J. Weinberg, and J. Gustafsson. 2013. “Food Losses and Waste in China and Their Implication for Water and Land.” Environmental Science & Technology 47 (18): 10137–10144.
- Liu, H., K. Parton, Z. Zhou, and R. Cox. 2009. “At-Home Meat Consumption in China: An Empirical Study.” The Australian Journal of Agricultural and Resource Economics 53 (4): 485–501.
- Liu, H., K. Parton, Z. Zhou, and R. Cox. 2012. “Away-From-Home Meat Consumption in China.” Asian Journal of Agriculture and Development 8 (2): 83–97.
- Li, Y., L. Wang, G. Liu, and S. Cheng. 2021. “Rural Household Food Waste Characteristics and Driving Factors in China.” Resources, Conservation and Recycling 164: 105209. doi:10.1016/j.resconrec.2021.105209.
- Lorenz, B.-A.-S., M. Hartmann, and N. Langen. 2017. ““What Makes People Leave Their Food? The Interaction of Personal and Situational Factors Leading to Plate Leftovers in Canteens”.” Appetite 116: 45–56.
- Marais, M. L., Y. Smit, N. Koen, and E. Lötze. 2017. “Are the Attitudes and Practices of Foodservice Managers, Catering Personnel and Students Contributing to Excessive Food Wastage at Stellenbosch University?” South African Journal of Clinical Nutrition 30 (3). doi:10.1080/16070658.2017.1267348.
- Mattar, L., M. G. Abiad, A. Chalak, M. Diab, and H. Hassan. 2018. “Attitudes and Behaviors Shaping Household Food Waste Generation: Lessons from Lebanon.” Journal of Cleaner Production 198: 1219–1223.
- McCarthy, B., and H. B. Liu. 2017. “Food Waste and the ‘Green’consumer.” Australasian Marketing Journal 25 (2): 126–132.
- Min, S., X. Wang, and X. Yu. 2021. “Does Dietary Knowledge Affect Household Food Waste in the Developing Economy of China?” Food Policy 98: 101896. doi:10.1016/j.foodpol.2020.101896.
- Mirosa, M., R. Yip, and G. Lentz. 2018. “Content Analysis of the ‘Clean Your Plate Campaign’on Sina Weibo.” Journal of Food Products Marketing 24 (5): 539–562.
- Ogunmoroti, A., M. Liu, M. Li, and W. Liu. 2022. “Unraveling the Environmental Impact of Current and Future Food Waste and Its Management in Chinese Provinces.” Resources, Environment and Sustainability 9: 100064. doi:10.1016/j.resenv.2022.100064.
- Painter, K., G. Thondhlana, and H. W. Kua. 2016. “Food Waste Generation and Potential Interventions at Rhodes University, South Africa.” Waste Management 56: 491–497.
- Parfitt, J., M. Barthel, and S. Macnaughton. 2010. “Food Waste Within Food Supply Chains: Quantification and Potential for Change to 2050.” Philosophical Transactions of the Royal Society B: Biological Sciences 365 (1554): 3065–3081.
- Parizeau, K., M. von Massow, and R. Martin. 2015. “Household-Level Dynamics of Food Waste Production and Related Beliefs, Attitudes, and Behaviours in Guelph, Ontario.” Waste Management 35: 207–217.
- Pinto, R. S., R. M. dos Santos Pinto, F. F. S. Melo, S. S. Campos, and C. M. D. S. Cordovil. 2018. “A Simple Awareness Campaign to Promote Food Waste Reduction in a University Canteen.” Waste Management 76: 28–38.
- Pirani, S. I., and H. A. Arafat. 2016. “Reduction of Food Waste Generation in the Hospitality Industry.” Journal of Cleaner Production 132: 129–145.
- Plevin, R. J., M. A. Delucchi, and F. Creutzig. 2014. “Using Attributional Life Cycle Assessment to Estimate Climate‐change Mitigation Benefits Misleads Policy Makers.” Journal of Industrial Ecology 18 (1): 73–83.
- Qian, L., F. Li, B. Cao, L. Wang, and S. Jin. 2021. “Determinants of Food Waste Generation in Chinese University Canteens: Evidence from 9192 University Students.” Resources, Conservation and Recycling 167: 105410. doi:10.1016/j.resconrec.2021.105410.
- Qian, L., F. Li, H. Liu, L. Wang, B. McCarthy, and S. Jin. 2022. “Rice Vs. Wheat: Does Staple Food Consumption Pattern Affect Food Waste in Chinese University Canteens?” Resources, Conservation and Recyclingg 176: 105902. doi:10.1016/j.resconrec.2021.105902.
- Scholz, K., M. Eriksson, and I. Strid. 2015. “Carbon Footprint of Supermarket Food Waste.” Resources, Conservation and Recycling 94: 56–65.
- Song, G., H. M. Semakula, and P. Fullana-I-Palmer. 2018. “Chinese Household Food Waste and Its’ Climatic Burden Driven by Urbanisation: A Bayesian Belief Network Modelling for Reduction Possibilities in the Context of Global Efforts.” Journal of Cleaner Production 202: 916–924.
- Talhelm, T., X. Zhang, S. Oishi, C. Shimin, D. Duan, X. Lan, and S. Kitayama. 2014. “Large-Scale Psychological Differences Within China Explained by Rice versus Wheat Agriculture.” Science 344 (6184): 603–608.
- UNEP. 2021. “Food Waste Index Report 2021”. Kenya: United Nations Environment Programme (UNEP). Accessed 12April2021. https://wrap.org.uk/FoodWasteIndex
- USDA. 1992. “Weight, Measures, and Conversion Factors for Agriculture Commodities and Their Products”. Economic Research Service in Cooperation with the Agricultural Marketing Service, the Agricultural Research Service, and the National Agricultural Statistics Service. U.S. Department of Agriculture. Agricultural Handbook No. 697
- Vanham, D., A. Leip, A. Galli, T. Kastner, M. Bruckner, A. Uwizeye, K. Van Dijk, E. Ercin, C. Dalin, and M. Brandão. 2019. “Environmental Footprint Family to Address Local to Planetary Sustainability and Deliver on the SDGs.” The Science of the Total Environment 693: 133642. doi:10.1016/j.scitotenv.2019.133642.
- Visschers, G., V. H. Beretta, D. Gundlach, and C. Beretta. 2020. “Smaller Servings Vs. Information Provision: Results of Two Interventions to Reduce Plate Waste in Two University Canteens.” Waste Management 103: 323–333.
- Wang, L., G. Liu, X. Liu, Y. Liu, J. Gao, B. Zhou, S. Gao, and S. Cheng. 2017. “The Weight of Unfinished Plate: A Survey Based Characterisation of Restaurant Food Waste in Chinese Cities.” Waste Management 66: 3–12.
- Wang, L., L. Xue, Y. Li, X. Liu, S. Cheng, and G. Liu. 2018. “Horeca Food Waste and Its Ecological Footprint in Lhasa, Tibet, China.” Resources, Conservation and Recycling 136: 1–8.
- Wang, Y., Z. Yuan, and Y. Tang. 2021. “Enhancing Food Security and Environmental Sustainability: A Critical Review of Food Loss and Waste Management.” Resources, Environment and Sustainability 4: 100023. doi:10.1016/j.resenv.2021.100023.
- Whitehair, K. J., C. W. Shanklin, and L. A. Brannon. 2013. “Written Messages Improve Edible Food Waste Behaviors in a University Dining Facility.” Journal of the Academy of Nutrition and Dietetics 113 (1): 63–69.
- Wu, Y., X. Tian, X. Li, H. Yuan, and G. Liu. 2019. “Characteristics, Influencing Factors, and Environmental Effects of Plate Waste at University Canteens in Beijing, China.” Resources, Conservation and Recycling 149: 151–159.
- Xue, L., X. Liu, S. Lu, G. Cheng, Y. Hu, J. Liu, Z. Dou, S. Cheng, and G. Liu. 2021. “China’s Food Loss and Waste Embodies Increasing Environmental Impacts.” Nature Food 2 (7): 519–528.
- Xue, L., G. Liu, J. Parfitt, X. Liu, E. Van Herpen, Å. Stenmarck, C. O’Connor, K. Östergren, and S. Cheng. 2017. “Missing Food, Missing Data?. A Critical Review of Global Food Losses and Food Waste Data.” Environmental Science & Technology 51 (12): 6618–6633.
- Xu, Z., Z. Zhang, H. Liu, F. Zhong, J. Bai, and S. Cheng. 2020. “Food-Away-From-Home Plate Waste in China: Preference for Variety and Quantity.” Food Policy 97: 101918. doi:https://doi.org/10.1016/j.foodpol.2020.101918.
- Zhang, H., G. Liu, L. Xue, J. Zuo, T. Chen, A. Vuppaladadiyam, and H. Duan. 2020. “Anaerobic Digestion Based Waste-To-Energy Technologies Can Halve the Climate Impact of China’s Fast-Growing Food Waste by 2040.” Journal of Cleaner Production 277: 123490. doi:10.1016/j.jclepro.2020.123490.
- Zhang, H., S. Li, D. R. Wei, J. Chen, C. Sun, A.K. Vuppaladadiyam, and Duan, H. 2021. “Characteristics, Environmental Impact, and Reduction Strategies of Food Waste Generated by Young Adults: Case Study on University Canteens in Wuhan, China.” Journal of Cleaner Production 321: 128877. doi:https://doi.org/10.1016/j.jclepro.2021.128877.
Appendix A
The conversion calculation formulas are listed below:
denotes the total annual plate waste in Chinese university canteens (million t), and N is the total number of students in Chinese universities in 2018, approximately 40 million. The number of days a university student dines in the university canteen is assumed to be 270 days, calculated as 365 days minus 95 days, including summer and winter holidays.
indicates daily per capita food waste in Chinese university canteens (g/day).
denotes daily per capita food waste in Chinese university canteens (g/day).
denotes per capita food waste of studenti per meal in Chinese university canteens (g/meal).
is the cooked-raw food conversion factor for food k, and
is the raw agricultural produce conversion factor for food k.
Appendix B
This study used a CF index to assess the environmental impact of plate waste in Chinese university canteens, calculated as follows:
indicates the total annual CF of food waste in Chinese university canteens (10,000 t CO2eq/year).
denotes the average daily CF of food waste in Chinese university canteens (g CO2eq/day).
is the GWP of food wastek in Chinese university canteens (kg CO2eq/kg) (Clune et al., Citation2017).
Appendix C