
Abstract
Continuous global-scale mapping of human settlements in the service of international agreements calls for massive volume of multi-source, multi-temporal, and multi-scale earth observation data. In this paper, the latest developments in terms of processing big earth observation data for the purpose of improving the Global Human Settlement Layer (GHSL) data are presented. Two experiments with Sentinel-1 and Landsat data collections were run leveraging on the Joint Research Centre Earth Observation Data and Processing Platform. A comparative analysis of the results of built-up areas extraction from different remote sensing data and processing workflows shows how the information production supported by data-intensive computing infrastructure for optimization and multiple testing can improve the output information reliability and consistency within the GHSL scope. The paper presents the processing workflows and the results of the two main experiments, giving insights into the enhanced mapping capabilities gained by analyzing Sentinel-1 and Landsat data-sets, and the lessons learnt in terms of handling and processing big earth observation data.
1. Introduction
Knowledge of the global spatial distribution and evolution of human settlements has become one of the key requirements for monitoring progress toward sustainable development of urban and rural areas. Human settlements and built-up areas feature in several goals and targets of the major international frameworks agreed in 2015 and 2016, namely the United Nations Sustainable Development, Goals (SDGs) (United Nations, Citation2017), the Sendai Framework for Disaster Risk Reduction (United Nations International Strategy for Disaster Reduction, Citation2015), the Paris Agreement on Climate Change (United Nations, Citation2015), and the New Urban agenda (United Nations Conference on Housing and Sustainable Urban Development, Citation2016). These agreements articulate a set of indicators that require homogeneous and consistent information on the spatial distribution and the dynamics of human settlements: e.g. the indicators on pressure on natural habitats and biodiversity (SDG Goal 15), resilience to natural hazards (Priority 3 of the Sendai Framework for Disaster Risk Reduction), land use efficiency and access to basic services (SDG Goal 11 Monitoring Framework – UN-Habitat, Citation2017).
In this regard, Earth Observation (EO) is recognized as a substantial enabler of informed decision-making by allowing measuring and monitoring the expected results (Anderson, Ryan, Sonntag, Kavvada, & Friedl, Citation2017). In particular, remote sensing data can help inform changes in built-up areas, urban sprawl or exposure to disasters. The integration of this information with statistical data contributes to an enhanced understanding of human pressure on the environment and a better valuation of physical and human losses caused by disasters.
Currently there are several EO-derived or EO-supported global maps reporting about physical features directly related to human settlement activity. These maps refer to “artificial surfaces”, “urban areas”, and “built-up areas”. Until few years ago, they were mostly generated on the basis of medium-resolution optical satellite imagery (Gamba & Herold, Citation2009) such as MODIS 500 (Schneider, Friedl, & Potere, Citation2009) and the 300 m MERIS sensor on board the ENVISAT satellite mission supporting the Globe Cover of the European Space Agency (Arino et al., Citation2012). Recent advances in geo-spatial data processing technologies have induced some attempts to process finer scale global land cover products including human settlement information. In 2013, two experiments were published using as input global records of Landsat and Aster data. In the Monitoring of Global Land Cover (FROM-GLC) project, human supervised classification techniques were tested on Landsat data input of the epoch 2006 (Gong et al., Citation2013), while Aster data were classified using an approach that combines Learning with Local and Global Consistency and logistic regression with existing land cover data used as training set (Miyazaki, Shao, Iwao, & Shibasaki, Citation2013). In the same year, the Global Urban Footprint (GUF) project announced the initialization of the production based on a method of built-up surface detection relying on a fixed (unsupervised) cut-off value on textural measures extracted from 12-m-resolution TerraSAR-X, TanDEM-X data (Esch et al., Citation2013).
Later on, a 30 m-resolution global land cover (GlobeLand30) was produced by the application of a labor-intensive workflow including image segmentation techniques followed by category annotation driven by human expert knowledge: the method was described by the authors as “pixel- and object-based methods with knowledge” (POK) (Chen et al., Citation2015). In 2016, the first public release of the Global Human Settlement Layer (GHSL) was issued, as follow-up of the alpha release in 2014 (Pesaresi, Ehrlich, Ferri, et al., Citation2016). The GHSL includes global multi-temporal evolution of built-up surfaces, population densities, and urban-rural delimitation organized in four epochs 1975, 1990, 2000, and 2014. The GHSL method for built-up surface recognition from satellite data was designed for fully automated and reproducible operations: it is based on Symbolic Machine Learning (SML) and uses existing global land cover products as training sets.
The integration of GHSL baseline data with socioeconomic statistics and global hazard data demonstrated the value of global consistent information on human settlements for the production of a number of indicators related to urbanization (Pesaresi, Melchiorri, Siragusa, & Kemper, Citation2016) and to spatiotemporal patterns of exposure (Pesaresi et al., Citation2017). These characteristics make the GHSL a potentially adequate baseline data meeting the monitoring requirements of the 2030 agendas.
In order to keep up with the challenges related to the reporting framework of the international agreements, continuous updates and incremental improvements of human settlements baseline data are required. The recent availability of Sentinel-1 and Sentinel-2 data of the EU’s Copernicus program is expected to bring human settlements mapping and monitoring to an unprecedented level. With the great advantage of being free together with the high frequency of revisit for the systematic global coverage, Sentinel data can provide up-to-date global information on the status and evolution of human settlements. With the shift to Sentinel imagery, regular updates and incremental improvements of the GHSL are becoming more feasible and reliable.
In that perspective, a continuous human settlements mapping at global scale in the service of international agreements calls for massive volumes of satellite imagery with the following characteristics: worldwide coverage, multi-source, multi-temporal and multi-scale, high-dimensional, highly complex, and unstructured. These requirements challenge the existing technologies (Guo et al., Citation2017). To meet the demands of global-scale mapping of human settlements from space, not only mass storage infrastructures are needed but also novel data analytics combined with high-performance computing platforms should be designed (Marchetti, Soille, & Bruzzone, Citation2016).
The main challenges to address for enhanced and up-to-date information retrieval in the frame of the GHSL can be summarized in four points:
the urge for maximizing the value of open and free satellite data under the principle of reciprocity (returning benefits to the citizens);
the necessity to look for complementary roles of different available EO platforms;
the fast evolution of the sensor technology and the complexity of handling such large and heterogeneous data-sets and finally;
the necessity to re-engineer the image classification algorithms to support big data processing.
2. Method and data-sets
This section briefly describes the technology at the heart of the GHSL production workflow (Section 2.1) and the first GHSL product generated in 2015 from four collections of Landsat data using a conventional small-scale computing cluster (Section 2.2). The data-sets employed for producing the new generation GHSL products are presented, namely the Sentinel-1 data (Section 2.3) and the global maps of urban areas used for learning the image classifier (Section 2.4). The main components of the JEODPP are also briefly presented with emphasis on those used for the massive processing of Sentinel-1 and Landsat imagery (Section 2.5).
2.1. The symbolic machine learning for analyzing big remote sensing data
The satellite-derived information extraction tasks included in the GHSL production workflow builds on the Symbolic Machine learning (SML) method that was designed for remote sensing big data analytics (Pesaresi, Ehrlich, Ferri, et al., Citation2016; Pesaresi, Syrris, & Julea, Citation2016a). The SML schema is based on two relatively independent steps:
Reduce the data instances to a symbolic representation (unique discrete data-sequences);
Evaluate the association between the unique data-sequences subdivided into two parts: X (input features) and Y (known class abstraction derived from a learning set).
2.2. GHSL built-up areas baseline production from Landsat data
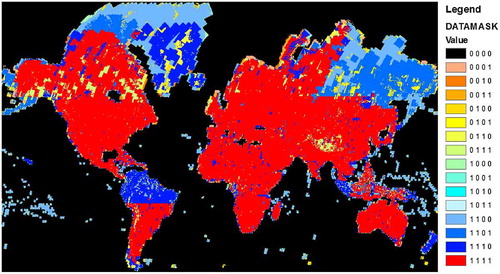
In 2014/2015, a large-scale experiment aimed at extracting information on built-up from Landsat was performed using a standard cluster computing system (Pesaresi, Ehrlich, Ferri, et al., Citation2016). In total, 32,808 images organized in four Landsat data collections centered at 1975, 1990, 2000, and 2014 were processed with the SML classifier as follows:
7588 scenes acquired by the Multispectral Scanner (collection 1975);
7375 scenes acquired by the Landsat 4–5 Thematic Mapper (TM) (collection 1990);
8756 scenes acquired by the Landsat 7 Enhanced Thematic Mapper Plus (ETM+) (collection 2000); and
9089 scenes acquired by Landsat 8 (collection 2014).
Figure 1. Overview of landsat data availability by collection.
Note: The binary codes shown in the legend correspond to the four data collections in the following order: 2014-2000-1990-1975.
The learning set used for training the SML classifier at the global level was also very heterogeneous combining spatial information on human settlements from various sources with different scales and diverse thematic definitions, completeness and reliability: MERIS Globe Cover artificial surfaces (Arino et al., Citation2012), LandScan population grids (Dobson, Bright, Coleman, Durfee, & Worley, Citation2000), Open Street Map (OSM) (OpenStreetMap contributors, Citation2017), Geonames (http://geonames.usgs.gov), MODIS 500 global urban extents (Schneider et al., Citation2009), etc. The general information production strategy consisted in two steps: alpha release in 2014 and beta release in 2015. The alpha release was using Landsat data input and broad scale (kilometric resolution) available land cover as training set. The beta release was using the same Landsat data input and a more refined set of training data including available fine-scale voluntary geographic information (as OSM), national land cover, and the output of the precedent GHSL alpha, including temporal information.
The model-free and robust to noise SML classifier adopted in the workflow facilitated the fusion of different (by both scale and thematic contents) information sources in an automatic way that was learning on-the-fly for each data component (scene) the best combination of parameters.
The processing was accomplished by means of a conventional, small-scale commodity cluster. It consisted of 16 processing nodes with heterogeneous characteristics: [email protected] GHz-32 GB, [email protected] GHz-1 TB, [email protected] GHz-256 GB, [email protected] GHz-80 GB, [email protected] GHz-32 GB, [email protected] GHz-128 GB, [email protected] GHz-16 GB, having mainly CentosOS 6.9 as operating system. The storage system was a NetApp’s network attached storage, supporting 250 MB/sec observed cumulative maximum speed for accessing data. The Sun Grid Engine scheduler was employed for the jobs allocation. Memory usage and mapserver constraints bounded the number of concurrent jobs to a total of 80 jobs approximately, resulting in a period of 6–7 days for the finalization of a single complete workflow.
The resulted multi-temporal product, referred here as GHS BU LDSMT v.2015 (Pesaresi, Ehrlich, Florczyk, et al., Citation2016), encodes the presence of built-up surfaces according to the earliest epoch for which the built-up surface presence was detected (i.e. 1975, 1990, 2000, or 2014 epoch) at approximately 38 m resolution. According to the quality assessment using detailed cartographic data (Pesaresi, Ehrlich, Ferri, et al., Citation2016), the accuracy of the GHSL layer was better than the available (at that moment) global alternatives made by automatic satellite data classification approaches. The analysis showed also that the built-up surfaces associated to rural and scattered low-density settlement patterns were expected to be relatively under-represented. In general, the capacity to discriminate such spatially scattered information is strongly linked to the resolution power of the input sensor.
2.3. Sentinel-1 data collection
The Sentinel-1 mission is designed as a constellation of two synthetic aperture radar (SAR) satellites, namely Sentinel-1A (launched in April 2014) and Sentinel-1B (launched in April 2016), offering a full systematic coverage of the land surface at a global level in the Interferometric Wide swath mode every six days. With such characteristics, Sentinel-1 gives the possibility to provide up-to-date global information on the status and evolution of human settlements and allows regular updates of the GHSL information layers.
The first GHSL experiment exploiting Sentinel-1A data at global scale was performed in 2016 (Corbane et al., Citation2017) as an analysis of the fitness-for-purpose of Sentinel data for the regional and urban development policy of the European Union (i.e. the EU Cohesion Policy (European Commission, & Regional Policy DG, Citation2008)).
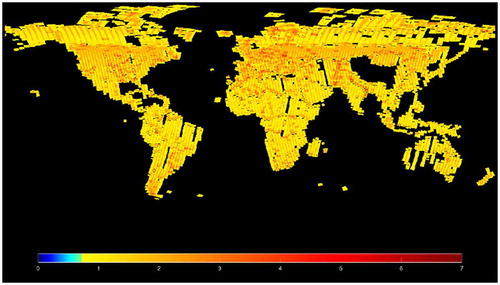
The collection of Sentinel-1A images used for the GHSL test reported here was designed in order to optimize the data storage and download time (Syrris, Corbane, & Soille, Citation2017). The rules for data selection addressed: the processing level (Level-1), swath mode of data acquisition (Interferometric Wide, IW), product type (Ground Range Detected, GRD), acquisition date (between December 2015 and October 2016), polarization type (VV or VH). Additionally, the priority of the product selection aimed at the land mass, presence of built-up areas (guided by the existing GHSL layers), and regional consistency in acquisition orbit. The resulted collection covering all the globe with some gaps () has total volume of ca. 8 TB, and consists of 5026 Sentinel-1A images (at that time, the Sentinel-1B data were not available yet) with the pixel spacing being 10 × 10 m and the spatial resolution 20 × 22 m (in range and azimuth respectively).
Figure 2. Sentinel-1 data downloaded and processed on JEODPP.
Note: The color ramp indicates the number of overlapped images at pixel level.
2.4. Ancillary data used in the large-scale experiments
The main workflow described in this paper builds on the SML classifier which automatically generates inferential rules linking the image data to available high-abstraction semantic layers used as training sets. Theoretically any data thematically linked or approximating the built-up areas class with an exhaustive worldwide coverage can be used for deriving human settlements information from the Sentinel-1 and Landsat imagery. No harmonization of scale and thematic contents is required. This characteristic allows incremental learning and improvement of the classification outputs as soon as new data on built-up areas becomes available. In other words, the outputs of the SML classifier in one experiment can be used as a training set in the subsequent experiment. In order to provide a quantitative assessment of the improvement gained through the incremental learning, independent reference data on built-up areas are needed. All these data-sets describing built-up areas and used either for training the SML classifier or for the cross-comparison of the outputs of the classification are referred to as ancillary data.
In this study, the ancillary data include the following global scale maps of urban areas:
GLC-30 represents the first global open access land cover product at 30 meter resolution from fine scale Landsat imagery acquired in 2010 (Li, Gong, & Liang, Citation2015). GLC-30 was produced with operational visual analysis techniques using a hybrid pixel- and objected-oriented approach. It includes nine thematic classes with one associated to “artificial surfaces” mainly consisting of urban areas, roads, and rural cottages and mines. Preliminary results of accuracy assessment of GLC-30 refer to 80% of overall accuracy and 0.75 for the Kappa coefficient with a user accuracy of 86.70% for the artificial surfaces class. The “artificial surfaces” abstraction included in the GlobeLand30 (GLC-30) is used here as a proxy (learning set) of the information contained in the Sentinel-1 and Landsat satellite image to be detected.
Global Urban Footprint (GUF) used here as a reference set for the cross-comparison of the different SML outputs and for the quantitative assessment of the incremental improvement of the results. The GUF product is generated from high spatial resolution (12m) satellite data acquired between 2011 and 2013 by the German satellite constellation of TerraSAR-X and TanDEM-X (Esch et al., Citation2013). The reduced resolution of 2.8 arc-seconds (84 m) version of the GUF product was used in this experiment. The GUF output is mainly related to built-up regions that feature vertical structures (e.g. houses, walls, traffic signs, etc.) but exclude impervious surfaces without a vertical component. Initial validation efforts carried out for the GUF report region-specific accuracies ranging between 60 and 95% (Esch et al., Citation2013; Klotz, Kemper, Geiß, Esch, & Taubenböck, Citation2016; Taubenbock, Esch, Felbier, Roth, & Dech, Citation2011).
Table 1. Data-sets employed in the two workflows with Sentinel-1 and Landsat imagery.
2.5. Platform for earth observation data storage and processing: the JEODPP
The JRC EO Data and Processing Platform (JEODPP) has been developed in the framework of the JRC EO&Social Sensing Big Data (EO&SS@BD) pilot project. The platform evolves continuously to address the emerging needs of the JRC Knowledge Production units following the new challenges posed by Earth Observation entering the big data era. The data streams originating from the Sentinel-1 constellation operated by the European Space Agency delivers up to 6 TB of image data per day. The JEODPP was conceived to timely process large amounts of data using commodity hardware. Novel software technologies for both storage (Peters & Janyst, Citation2011) and processing enable the analysis of global coverages of high resolution satellite images at a high speed. Due to its fast response, the platform allows the iterative optimization of the big data machine learning methods and the fine-tuning of their parameters at full scale. The JEODPP is considered strongly versatile in the sense that it accommodates existing scientific workflows such as the SML classifier without the need for rewriting the underlying code to match specific requirements.
JEODPP provides three modes of data accessing and processing: (a) interactive processing through the Jupyter workspace (Thomas et al., Citation2016) and in-house built-in libraries (written in C++ and Python), (b) web-based remote desktop for prototyping (R, Matlab, IDL-ENVI) and visualization (QGIS, GRASS), provided by the Apache Guacamole gateway [https://guacamole.incubator.apache.org/], and (c) batch processing orchestrated by the HTCondor (Thain, Tannenbaum, & Livny, Citation2005) scheduler. The two experiments presented herein made use of the latter mode. On top of that, and in order to accommodate a wide variety of legacy software written in different programming languages with often incompatible software library dependencies, the JEODPP implements virtualization technologies. The typical overhead encountered with operating system virtualization is avoided thanks to lightweight virtualization based on Docker containerization. Each application runs within a Docker container isolating the user-space instance to prevent conflict with applications running side-by-side in different containers. A Docker container is instantiated by a Docker image that contains all the required software and associated libraries. The SML classifier relies on libraries written in Matlab. The Docker image enables the execution of the compiled code via the Matlab runtime environment (Soille, Burger, Rodriguez, Syrris, & Vasilev, Citation2016; Soille et al., Citation2017).
3. The workflows
Two workflows for automatic extraction of built-up areas from Sentinel-1 and Landsat data were deployed and executed within the JEODPP: the purpose of the first experiment with Sentinel-1 data was to produce up-to-date information on human settlements while mitigating commission and omission errors of the first GHSL multi-temporal product derived from Landsat data collections (GHS BU LDSMT v.2015) (Section 3.1). The second workflow was designed to evaluate the advantages of incremental learning of the SML classifier in the frame of “meta-optimization” tasks of the GHSL production system. Hence, the Landsat data collections were reprocessed and several tests were implemented during which both the artificial surfaces from GLC-30 and the built-up areas derived from Sentinel-1 (results from the first experiment) were injected as learning sets within the SML workflow (Section 3.2.1). The next sections describe the implementation of the global scale experiments along with an overview of the image processing workflows.
3.1. Workflow1: built-up extraction from Sentinel-1
3.1.1. Preprocessing of Sentinel-1 GRD data
The Sentinel-1 Level-1 GRD images were automatically downloaded and ingested in the JEODPP correspond to SAR data detected, multi-looked and projected to ground range using an Earth ellipsoid model. Geometric and radiometric calibrations and border noise removal are required prior to the classification of the scenes with the SML classifier. A fully automated preprocessing chain, building on both the functionalities embedded in the ESA Sentinel-1 toolbox ver.2.0.2 (S1TBX) and on in-house developed libraries, was executed over the JEODPP processing infrastructure using the concept of virtualization. During the preprocessing, thermal noise removal and radiometric calibration to sigma nought (dB) were performed. This step was followed by Range-Doppler terrain correction based on the Shuttle Radar Topography Mission (SRTM) Digital Elevation Model (DEM) in 1 arc-second resolution (approximately 30 m at the equator). For the scenes falling outside the area covered by SRTM data (548 out of 5026 Sentinel-1 products), terrain corrections were performed using the Advanced Spaceborne Thermal Emission and Reflection Radiometer (ASTER) Global Digital Elevation Model Version 2 (GDEM V2) with a global resolution of approximately 30 m. Most Sentinel-1 images have a dark border of invalid pixels with no constant values that impede the calculation of accurate image statistics. An algorithm based on connected components was applied in order to cut off the dark borders without affecting the values of the valid pixels.
3.1.2. SML classification of Sentinel-1
The SML classifier has shown to be efficient in working in complex and information-abundant environments where it is important to assess the relationship between different data layers in model-free and computational-effective modalities. Several applications demonstrated its suitability for country-wide and global processing of multi-sensor (e.g. SPOT-5, SPOT-6, RapidEye) and multi-resolution data and its capacity to handle different sets of input features (e.g. radiometric, textural and morphological descriptors) (Kemper, Mudau, Mangara, & Pesaresi, Citation2015; Kemper, Mudau, Mangara, Pesaresi, et al., Citation2015). In the case of Sentinel-1 data, several experiments were necessary for testing the applicability of the SML to SAR type imagery in view of improving and updating the first global human settlement product derived from Landsat data (GHS BU LDSMT v.2015).
The SML classifier was applied to exploit the key features of the Sentinel-GRD data which are: (1) the spatial resolution of 20 m with a pixel spacing of 10 m and (2) the availability of images acquired in ascending and descending modes, and (3) the dual polarization acquisitions (VV and VH mostly) widely used for monitoring urban areas since different polarizations have different sensitivities and different backscattering coefficients for the same target (Matsuoka & Yamazaki, Citation2004).
The input features (X) to the SML classifier consisted of:
Dual polarized backscatter intensities (I VV and I VH) processed at a resolution of 20 m (for very few products, the respective I HH and I HV were used).
Textural features computed from the image local statistics (Schistad Solberg & Jain, Citation1997). They correspond to the mean and standard deviations (STD) of backscatter intensities calculated in a local neighborhood of four different sizes: 3 × 3, 5 × 5, 7 × 7, and 9 × 9 pixels matching typical building structures. Textural features are expected to enhance the capacity of the SML in delineating built-up structures as demonstrated in multiple studies dealing with SAR images in urban environments (Corbane, Faure, Baghdadi, Villeneuve, & Petit, Citation2008; Dell’Acqua & Gamba, Citation2003; Pesaresi & Gerhardinger, Citation2011).
Topographic features (slope, aspect, and crest lines) derived from the SRTM DEM with the purpose of allowing the machine to select specific combination of features attenuating the confusion between the backscattering patterns generated by vertical structures in built-up surfaces and vertical topographic structures (as rock cliffs).
The learning data (Y) representing built-up areas at a coarser resolution are given here by the union of the artificial surfaces class of from GLC-30 and the built-up areas derived from GHS BU LDSMT v.2015 product. The learning data are downscaled via nearest neighbor interpolation to reach the spatial resolution of the input features. Then, the SML automatically analyzes the relationships between the data sequences and the reference instances through association analysis and calculates the ENDI measure. The output ENDI value can also be interpreted as a membership value to the built-up class when using fuzzy or continuous logic multi-criteria frameworks. Originally produced in the range of [−1, 1], ENDI is rescaled linearly in the range [0, 1]. Finally for the purpose of comparison with other built-up products, the continuous ENDI image is binarized following the Otsu thresholding approach (Otsu, Citation1979). The final binary output product derived from Sentinel-1 is referred here as GHS BU S1 2016. A web-based view of this layer can be found on the JEODPP portal:
http://cidportal.jrc.ec.europa.eu/services/webview/jeodpp/databrowser/?default=ghsl
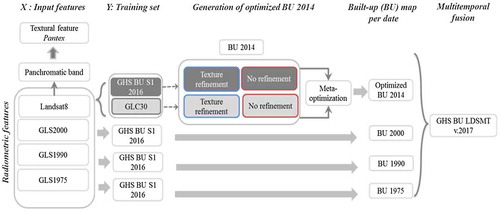
A simplified workflow of the adapted SML workflow for the classification of Sentinel-1A data is shown in with a total of 21 input features and the combined built-up areas from the GHSL-Landsat and the GLC-30 used for instructing the learning in the association analysis.
Figure 3. Simplified workflow showing the adaptation of the SML to the classification of Sentinel-1 images at the global level.
Note: The input features comprise 18 data layers derived from dual-polarization Sentinel-1 intensity data and 3 topographic features derived from SRTM DEM.
3.2. Workflow 2: multi-temporal built-up extraction from Landsat collections
3.2.1. Testing different features and training sets
Considering the results from the processing of Sentinel-1, the focus of the next experiment is on assessing the advantages of incremental learning of the SML classifier for an improved delineation of built-up areas from Landsat collections. Taking advantage of the high-throughput of the JEODPP, it was possible to test several combinations for the calculated image features and different options for the training of the SML classifier:
In terms of calculated image features, the workflow for processing Landsat multispectral imagery from Landsat8, GLS2000, GLS1990, and GLS1975 collections relies essentially on radiometric features used as input to the SML workflow. However, in the case of Landsat8 data, the availability of a panchromatic band at a spatial resolution of 15 m allows testing the added-value of texture features for a more refined delineation of built-up areas. Hence, textural analysis was applied on the panchromatic band using the PANTEX methodology which is based on a set of rotation-invariant, anisotropic contrast texture measurements calculated on the co-occurrence matrix of the gray-level input image (Pesaresi & Gerhardinger, Citation2011; Pesaresi, Gerhardinger, & Kayitakire, Citation2008). For the purposes of this work, a textural feature was calculated with a window size of 75 m and a displacement vector of one pixel with eight directions. While the use of texture can significantly reduce commission problems especially in sandy dunes, river beds and agricultural areas, it may lead sometimes to excessive refinement with under-detection of large industrial buildings areas and in very compact settlement patterns with narrow internal roads (thinner than the sensor resolution) as in ancient-development cities and villages, and in some large slum areas. Therefore, in the case of Landsat8 collection, two options were included in this experiment allowing to obtain a built-up layer with or without textural refinement.
In terms of the SML classifier training, we tested independently two learning sets in the case of Landsat8: the artificial surfaces from GLC-30 and the built-up areas derived from Sentinel-1 (GHS BU S1 2016 product resulting from the first experiment).
Compared to the procedure followed for generating the first GHSL multi-temporal product in 2014/2015 (GHS BU LDSMT v.2015) (alpha, beta releases of GHSL), the current experiment uses more detailed learning sets on built-up areas with a consistent global coverage. Besides, in the case where the output from Sentinel-1A is used as reference, an incremental learning is tested in the SML framework. With this approach, the SML is trained using built-up areas derived from Sentinel-1A which in turn were derived from the first GHSL multi-temporal product, leading to a successive refinement.
3.2.2. Developing an optimized map of built-up areas
Given the multiple results which issue from the tests implemented on the Landsat8 collection (outputs with or without textural refinement; outputs using either GLC-30 or GHS BU S1 2016 as a learning set), a cross-comparison of the different outputs was performed. The idea behind this exercise is to exploit the potential of the JEODPP infrastructure in terms of processing and storage capacities for designing a meta-optimization process aiming at maximizing the thematic consistency between the GHSL output and a given information layer available globally. Given the characteristics of stability and independency from seasonal and weather conditions of the satellite data source and the simplicity of the underlying processing method, the GUF was expected to provide a consistent and independent information at a scale comparable to the GHSL: consequently, it was selected as a good candidate reference set for the meta-optimization process described here.
For each scene in Landsat8 collection, the built-up areas obtained from the different tests were compared to the GUF data-set. The degree of agreement was evaluated with the Kappa coefficient as a base for the meta-optimization process.
3.2.3. Generating a new multi-temporal product (GHS BU LDSMT v.2017)
The new multi-temporal built-up extraction consists in aggregating the results of the four binary built-up layers obtained from the processing of individual Landsat data collections (Landsat8, GLS2000, GLS1990 and GLS1975), formerly tiled and mosaicked. The fusion of built-up maps from different dates relies on the following assumptions:
The built-up areas of the most recent year (2014) are considered as the most reliable and the basis of production of the multi-temporal image stack. They correspond to the output showing the highest agreement with the GUF reference data-set.
An increase of built-up over time is assumed.
The gaps in the built-up layer in a given period are filled with the closest information available from the earlier periods.
Figure 4. Overview of the processing chain for multi-temporal built-up extraction from Landsat data collections.
Note: The different tests related to the input features and the learning sets are highlighted with boxes of different grayscale background and outline colors.
4. Results
4.1. JEODPP processing
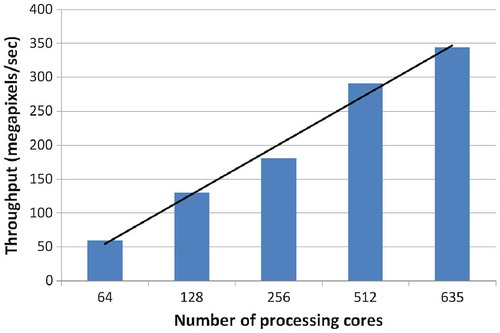
In the context of the first workflow, the processing has been conducted on 5026 Sentinel-1A products that constitute a data volume of ca. 8 TB. The preprocessing stage generated an additional output volume of 18 TB and the SML classification an amount of 4 TB of results. The preprocessing of the Sentinel-1A products was piloted by executing the S1TBX over a Docker container, one per every input product. The total elapsed time including CPU time and I/O operations was around 12 h by running 130 jobs simultaneously. The respective total elapsed time of the SML classification plus clipping/warping to tiles of size 12,288 × 12,288 pixels and merging of overlapped tiles was approximately 12 h using 240 concurrent jobs. demonstrates the directly proportional relationship between the increasing number of processing cores and the data throughput while running the SML algorithm. This is experimental evidence of the JEODPP capacity to scale up the algorithm execution without confronting bottlenecks due to networking or to jobs concurrency.
Figure 5. Scalability of the SML classification algorithm while running on JEODPP and having 5026 Sentinel-1A products as input plus the respective reference sets.
In the context of the second experiment, the processing has been conducted on 32,808 Landsat images with a volume of 23 TB. The total elapsed time for the production of the final layers was around 22 h by considering 610 concurrent jobs for the SML classification and 840 jobs for clipping/warping and merging the information of the overlapped tiles.
shows the JEODPP CPU load while executing the SML classification algorithm having the Landsat8 scenes as input. The small variance that is observed can be attributed to the simultaneous use of the distributed system for other tasks. This slight deviation from the requested number of concurrent jobs seen in the view of a continuous, long-term operation of the cluster is an empirical evidence of the system stability.
Figure 6. JEODPP CPU load during the processing of 9440 Landsat8 scenes and using two reference sets.
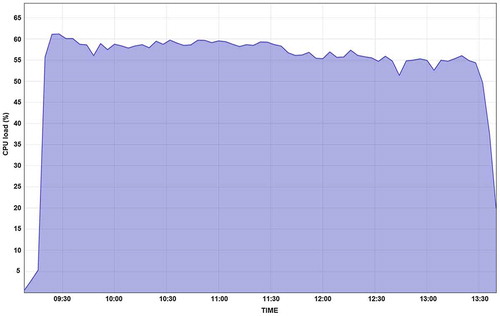
Furthermore, a factor which shows the JEODPP versatility in combination with stable performance is the possibility to execute programming code provided without special optimization with regard to the features of the platform.
For the type of processing described above, the average wait time was 0.4% and the average system time was 3.4%, numbers which can be considered very low in the absence of appropriate optimizations. This minor latency is granted primarily to the way the workflow has been coded. The SML algorithm has been written in Matlab scripting language and uses GDAL wrappers mainly for the I/O operations. Despite the fact that it is compiled with the “singleCompThread” flag for the deactivation of multi-threading, in practice there remain few threads running under the hood, probably to accomplish operations of the core Matlab engine. These threads provoke some unnecessary waiting and system time which nevertheless stays below 5%.
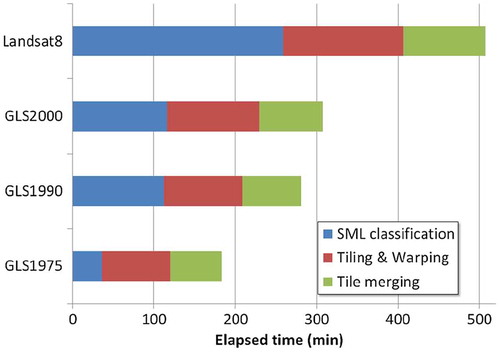
presents graphically the total elapsed time decomposition relating to the conduct of workflow 2. The total number of output layers with respect to the three processing stages as displayed in the figure is (4 collections × 3 references) + 2 × [(3 collections × 7 output layers) + (1 collection × 8 output layers)] = 70. Even though it is impossible to compare the two Landsat experiments (2015 and 2017) due to disparities referring to the characteristics of the computing clusters, the storage systems and the algorithmic workflows themselves, the JEODPP shortens the production time from six to seven days to less than one.
Figure 7. Total elapsed time for experiment 2.
Notes: The SML classification bar refers to 3 runs (by considering 3 reference sets) of the main processing workflow; the tiling & warping time corresponds to the derivation of 21 outputs regarding the GLS collections and 8 outputs for Landsat8; alike, the time of tile merging refers to 21 and 8 outputs for the GLS collections and Landsat8 respectively.
summarizes the basic figures regarding the two experiments in terms of both data volume and velocity of processing.
Table 2. Processing of Sentinel-1 and Landsat imagery on the JEODPP platform.
4.2. Comparative analysis
Among the several advantages of the SML classification approach is the possibility to apply it to different types of sensors while generating complementary outputs. Therefore, it is important to understand the differences in the detection of built-up areas produced from various sensors and workflows. Besides, the benefits of the incremental learning on the performances the SML classification accuracy need to be quantitatively assessed for a better understanding of the added-value of such an approach in view of a future multi-sensor integrated product.
In this regard, a comparative analysis of the results of built-up areas extraction from the different sensors and workflows was performed. The built-up areas obtained from the GUF product were used as an independent reference for cross-comparison purposes. Three products are compared here:
the first multi-temporal product derived from Landsat data (GHS BU LDSMT v.2015);
the Sentinel-1A-based product (GHS BU S1 2016) resulting from the first experiment and
the new product obtained from the reprocessing of Landsat data in the second experiment (GHS BU LDSMT v.2017).
shows the results of the comparative analysis at the global level reported by continent as a way to consider the regional variability in settlements characteristics in terms of building material construction type, structure and physical surrounding. The median and standard deviations values of the three accuracy metrics were calculated for a total of 23,134 tiles of 150 × 150 km size covering all the landmass.
Figure 8. Accuracy assessment of built-up areas derived from Landsat (GHS BU LDSMT v.2015, GHS BU LDSMT v.2017) and Sentinel-1 (GHS BU S1 2016) using GUF as a reference for the cross-comparison.
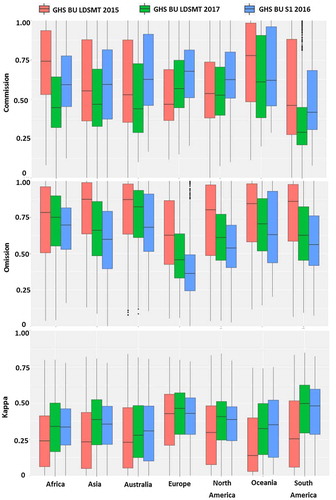
These basic descriptive measures highlight regional differences and completeness of the mapped built-up areas. A general trend can be observed in the three metrics with an increasing Kappa value and decreasing errors of commission and omission for the products of workflows 1 and 2 compared to the GHS BU LDSMT v.2015. Most importantly, we observe a gradual improvement in the agreement, with mostly increasing Kappa values in the output of workflow 1 (GHS BU S1 2016), which is then slightly outperformed by the results from workflow 2 (GHS BU LDSMT v.2017). This confirms the added-value of incremental learning of the SML classifier: the first GHS BU LDSMT v.2015 product was used as a learning set in the classification of Sentinel-1, the outputs of which are then used for instructing again the classification of historical Landsat data.
The most noticeable improvements are observed in Africa where both GHS BU S1 2016, and to a higher extent, GHS BU LDSMT v.2017 contribute to the reduction of commission errors. The over-detections were essentially observed in sandy or rocky beaches, bright bare soils and river beds that were misclassified as built-up areas in the first GHS BU LDSMT v.2015 product.
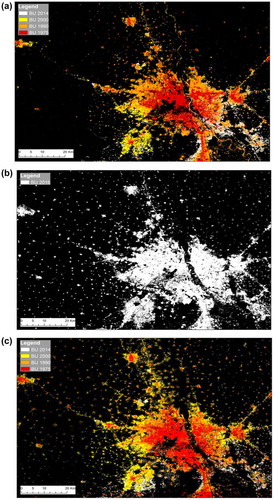
In terms of omissions, Asia is the continent where the highest misdetections were observed in the GHS BU LDSMT v.2015 product and thanks to the workflows run in the JEOPDD with Sentinel-1 and Landsat data, it was possible to significantly reduce those errors. In Asia, the omission rates are most probably related to the smaller sizes of settlements and stronger fragmentation especially in India and China. The increased spatial resolution of Sentinel-1 and the exploitation of the textural information of SAR imagery are translated into enhanced mapping capabilities observed in the identification of several sparse settlements that were not captured in the first GHS BU LDSMT v.2015 product.
(b) is an example of such enhanced capabilities covering the megacity of New Delhi and the surrounding villages. It corresponds to a typical case of under-detection of scattered settlements in rural areas in the first Landsat product ((a)). The GHS BU LDSMT v.2017 which builds on the output from Sentinel-1A for the training of the SML also reflects the improvements which propagate to the multi-temporal output ((c)).
Figure 9. Example of built-up areas in New Delhi and surrounding area observed in: (a) GHS BU LDSMT v.2015, (b) GHS BU S1 2016 and (c) GHS LDSMT v.2017.
The lowest median commission disagreement (0.27) is observed in South America and is given by the GHS BU LDSMT v.2017 product derived from Landsat data collections whereas the lowest median omission disagreement (0.35) is achieved with the GHS BU S1 2016 product in Europe. The continent exhibiting the highest overall agreement with the GUF data-set is South America with a median Kappa coefficient of 0.50 obtained in the GHS BU LDSMT v.2017 product. It is followed by Europe and North America (with median kappa values of 0.42 and 0.40, respectively). These results give clear evidence that the incremental learning of the SML contributes to the reduction of regional differences in the performances as we notice a progressive stabilization of the Kappa values with the GHS BU LDSMT v.2017 product.
5. Conclusion and outlooks
The true value of big earth observation data can be realized in a real remote sensing application (Chi et al., Citation2016). Global mapping and monitoring of human settlements are an illustration of the challenges in managing, processing, and efficient exploitation of big earth observation data. On one hand, the wealth of open and free data delivered by the Copernicus Sentinel and the temporal depth of the Landsat programs represent unprecedented opportunities for retrospective mapping of human settlements and for assessing their dynamics. On the other hand, we still do not fully master the technologies to harness such big amount of data complexity and heterogeneity, yet with high potentials.
In this paper, the latest developments in terms of processing big data for the purpose of improving the GHSL, firstly established with Landsat data, were presented. Two workflows with Sentinel-1 and Landsat data were run leveraging on the JRC JEODPP. In fact, this big data platform was a key to the success of the experiments thanks to its capacity to run consolidated scientific workflows such as the SML classifier originally designed to deal with big data scenarios involving: (1) large number of data granules (scenes), (2) heterogeneous sensors and training/reference sets, and (3) large variety of distinct geographical areas in different data collection conditions.
The comparative analysis of the built-up areas derived from different sensors (Landsat and Sentinel-1), different input features (radiometric and textural), and different training sets (GLC-30, GHS BU LDSMT v.2015, GHS BU S1 2016) demonstrated the added value of incremental learning in big data analytics in general and in the enhanced detection of built-up areas using the SML in particular. Using the GUF as a benchmark for the assessment, we promote the inter-comparison of data-sets that differ in terms of semantic definition of built-up areas and spatial resolutions. The inter-comparison workflow described here is designed inside a meta-optimization frame aiming to minimize the overall disagreement between final products, by maintaining their independent characteristics in terms of input data and methodology of processing.
In the absence of a reliable, multipurpose and global reference data-set on built-up areas, the approach adopted here represents an interesting alternative to explore disparities of past and present mapping efforts and to assess the degree of improvement or eventually degradation of the results.
A complete and meaningful accuracy assessment framework should consider various components of map accuracy beyond traditional pixel-based approaches to paint a complete picture (Klotz et al., Citation2016). Such an approach has been designed and implemented in the framework of the GHSL for the evaluation of built-up areas derived from different sensors using digital cartography at suitable scale for reporting about building footprints available for 13 cities (Sabo, Corbane, & Ferri, Citation2017). However, the limited number and uneven distribution of the detailed reference data across continents prevents the up-scaling of this approach for the global assessment of built-up areas.
Considering the challenges of global production of human settlement layers, efforts are currently being devoted to the exploitation of Sentinel-2 data with the SML approach as the primary methodology and the JEODPP as the big data processing infrastructure. Several tests and feasibility studies demonstrated the advantage of Sentinel-2 by showing improvements in terms of spatial detail and thematic contents with respect to Landsat derived built-up areas (Pesaresi, Corbane, et al., Citation2016; Sabo et al., Citation2017). An evaluation of the complementarity between Sentinel-1 and Sentinel-2 outlined the value of combining/fusing the two sensors for improving the discriminatory ability over that of either sensor alone (Pesaresi, Corbane, et al., Citation2016).
The latest advances in the production of GHSL data building on previously acquired knowledge, through incremental learning of the SML, are a strong experimental proof of the benefits of an integrated assessment of Landsat, Sentinel-1 and Sentinel-2 in support to GHSL production. In this perspective, the most efficient approaches for data/information fusion are being explored with a focus on the use of the hyper-temporal coverage of Sentinel-1 (A and B) and Sentinel-2 (A and B) that allow the computation of multi-temporal metrics. These metrics have the potential to further improve the delineation of built-up areas as demonstrated in previous studies (Lefebvre, Sannier, & Corpetti, Citation2016). The development of increasingly automated approaches for continual updating and for generating long-time series of built-up layers will be beneficial to applications that involve built-up gridded data as backbone. Such an application is the population disaggregation which includes the GHSL built-up grid in the model covariates (Freire, Ehrlich, & Ferri, Citation2014). The scientific and technical challenges associated with these perspectives provide the focus of future research on the global scale mapping of human settlements from space in the service of international agreements.
Disclosure statement
No potential conflict of interest was reported by the authors.
Funding
This work is supported by two administrative arrangements with the Directorate General of Internal Market, Industry, Entrepreneurship and SME’s (GROWTH) and the Directorate General for Regional and Urban Policy of the European Commission (REGIO).
Data availability statement
GHS BU LDSMT v.2015 data are available for download from the reference: Pesaresi, M., Ehrilch, D., Florczyk, A. J., Freire, S., Julea, A., Kemper, T., … Syrris, V. (2016). GHS built-up grid, derived from Landsat, Multitemporal (1975, 1990, 2000, 2014) (version R2015). European Commission, Joint Research Centre (JRC) [Dataset]. Retrieved from http://data.europa.eu/89h/jrc-ghsl-ghs_built_ldsmt_globe_r2015b.
GHS BU S1 2016 can be visualized on the following web-portal: http://cidportal.jrc.ec.europa.eu/services/webview/jeodpp/databrowser/?default=ghsl.
References
- Anderson, K., Ryan, B., Sonntag, W., Kavvada, A., & Friedl, L. (2017). Earth observation in service of the 2030 agenda for sustainable development. Geo-spatial Information Science, 20(2), 77–96. doi:10.1080/10095020.2017.1333230
- Arino, O., Perez, J. J. R., Kalogirou, V., Bontemps, S., Defourny, P., & Van Bogaert, E. (2012). Global land cover map for 2009 (GlobCover 2009). © European Space Agency (ESA) & Université Catholique de Louvain (UCL), August. doi:10.1594/PANGAEA.787668
- Chen, J., Chen, J., Liao, A., Cao, X, Chen, L., Chen, X., … Zhang, W. (2015). Global land cover mapping at 30 m resolution: A POK-based operational approach . ISPRS Journal of Photogrammetry and Remote Sensing, 103(May), 7–27. doi:10.1016/j.isprsjprs.2014.09.002
- Chi, M., Plaza, A., Benediktsson, J. A., Sun, Z., Shen, J., & Zhu, Y. (2016). Big data for remote sensing: Challenges and opportunities. Proceedings of the IEEE, 104(11), 2207–2219. doi:10.1109/JPROC.2016.2598228
- Congalton, R. G. (1991). A review of assessing the accuracy of classifications of remotely sensed data. Remote Sensing of Environment, 37(1), 35–46.10.1016/0034-4257(91)90048-B
- Congalton, R. G. (2009). Assessing the accuracy of remotely sensed data: Principles and practices (2nd ed.). Boca Raton, FL: CRC Press/Taylor & Francis.
- Corbane, C., Faure, J.-F., Baghdadi, N., Villeneuve, N., & Petit, M. (2008). Rapid urban mapping using SAR/optical imagery synergy. Sensors, 8(11), 7125–7143. doi:10.3390/s8117125
- Corbane, C., Lemoine, G., Pesaresi, M., Kemper, T., Sabo, F., Ferri, S., & Syrris, V. (2017). Enhanced automatic detection of human settlements using Sentinel-1 interferometric coherence. International Journal of Remote Sensing. doi:10.1080/01431161.2017.1392642
- Dell’Acqua, F., & Gamba, P. (2003). Texture-based characterization of urban environments on satellite SAR images. IEEE Transactions on Geoscience and Remote Sensing, 41(1), 153–159. doi:10.1109/TGRS.2002.807754
- Dobson, J. E., Bright, E. A., Coleman, P. R., Durfee, R. C., & Worley, B. A. (2000). LandScan: A global population database for estimating populations at risk. Photogrammetric Engineering and Remote Sensing, 66(7), 849–857.
- Esch, T., Marconcini, M., Felbier, A., Roth, A., Heldens, W., Huber, M., … Dech, S. (2013). Urban footprint processor – Fully automated processing chain generating settlement masks from global data of the TanDEM-X mission. IEEE Geoscience and Remote Sensing Letters, 10(6), 1617–1621. doi:10.1109/LGRS.2013.2272953
- European Commission, and Regional Policy DG. (2008). Working for the regions: EU regional policy 2007–2013. Luxembourg: EUR-OP.
- Freire, S., Ehrlich, D., & Ferri, S. (2014). Assessing temporal changes in global population exposure and impacts from earthquakes. In 11th International Conference on Information Systems for Crisis Response and Management (ISCRAM).
- Gamba, P., & Herold, M. (2009). Global mapping of human settlement: Experiences, datasets, and prospects. Taylor & Francis Series in Remote Sensing Applications. Boca Raton, FL: CRC Press.10.1201/CRCREMSENAPP
- Gong, P., Wang, J., Yu, L., Zhao, Y., Zhao, Y., Liang, L., … Li, C. (2013). Finer resolution observation and monitoring of global land cover: First mapping results with Landsat TM and ETM+ data. International Journal of Remote Sensing, 34(7), 2607–2654. doi:10.1080/01431161.2012.748992
- Guo, H., Liu, Z., Jiang, H., Wang, C., Liu, J., & Liang, D. (2017). Big earth data: A new challenge and opportunity for digital earth’s development. International Journal of Digital Earth, 10(1), 1–12. doi:10.1080/17538947.2016.1264490
- Gutman, G., Huang, C., Chander, G., Noojipady, P., & Masek, J. (2013). Assessment of the NASA–USGS global land survey (GLS) datasets. Remote Sensing of Environment, 134, 249–265.10.1016/j.rse.2013.02.026
- Huang, D.-Y., & Wang, C.-H. (2009). Optimal multi-level thresholding using a two-stage Otsu optimization approach. Pattern Recognition Letters, 30(3), 275–284. doi:10.1016/j.patrec.2008.10.003
- Kemper, T., Mudau, N., Mangara, P., & Pesaresi, M. (2015). Towards an automated monitoring of human settlements in South Africa using high resolution SPOT satellite imagery. ISPRS - International Archives of the Photogrammetry, Remote Sensing and Spatial Information Sciences, XL-7/W3(April), 1389–1394. doi:10.5194/isprsarchives-XL-7-W3-1389-2015
- Kemper, T., Mudau, N., Mangara, P., Pesaresi, M., European Commission, & Joint Research Centre, and Institute for the Protection and the Security of the Citizen. (2015). Towards a country-wide mapping & monitoring of formal and informal settlements in South Africa: Pilot-Study in cooperation with the South African National Space Agency (SANSA). Luxembourg: Publications Office. Retrieved from http://dx.publications.europa.eu/10.2788/970905
- Klotz, M., Kemper, T., Geiß, C., Esch, T., & Taubenböck, H. (2016). How good is the map? A multi-scale cross-comparison framework for global settlement layers: Evidence from Central Europe. Remote Sensing of Environment, 178(June), 191–212. doi:10.1016/j.rse.2016.03.001
- Lefebvre, A., Sannier, C., & Corpetti, T. (2016). Monitoring urban areas with Sentinel-2A Data: Application to the update of the copernicus high resolution layer imperviousness degree. Remote Sensing, 8(7), 606. doi:10.3390/rs8070606
- Li, X., Gong, P., & Liang, L. (2015). A 30-year (1984–2013) record of annual urban dynamics of Beijing City derived from Landsat data. Remote Sensing of Environment, 166, 78–90.10.1016/j.rse.2015.06.007
- Marchetti, P. G., Soille, P., & Bruzzone, L. (2016). A special issue on big data from space for geoscience and remote sensing [from the guest editors]. IEEE Geoscience and Remote Sensing Magazine, 4(3), 7–9. doi:10.1109/MGRS.2016.2586852
- Matsuoka, M., & Yamazaki, F. (2004). Use of satellite SAR intensity imagery for detecting building areas damaged due to earthquakes. Earthquake Spectra, 20(3), 975–994. doi:10.1193/1.1774182
- Miyazaki, H., Shao, X., Iwao, K., & Shibasaki, R. (2013). An automated method for global urban area mapping by integrating ASTER satellite images and GIS data. IEEE Journal of Selected Topics in Applied Earth Observations and Remote Sensing, 6, 1004–1019.10.1109/JSTARS.2012.2226563
- OpenStreetMap contributors. (2017). Planet dump. Retrieved from Https://planet.osm.org
- Otsu, N. (1979). A threshold selection method from gray-level histograms. IEEE Transactions on Systems, Man, and Cybernetics, 9(1), 62–66. doi:10.1109/TSMC.1979.4310076
- Pesaresi, M., Corbane, C., Julea, A., Florczyk, A., Syrris, V., & Soille, P. (2016). Assessment of the added-value of sentinel-2 for detecting built-up areas. Remote Sensing, 8(4), 299. doi:10.3390/rs8040299
- Pesaresi, M., Ehrlich, D., Ferri, S., Florczyk, A., Freire, S., Halkia, M., … Syrris, V. (2016). Operating procedure for the production of the global human settlement layer from Landsat data of the epochs 1975, 1990, 2000, and 2014. Publications Office of the European Union. Retrieved from http://publications.jrc.ec.europa.eu/repository/handle/111111111/40182
- Pesaresi, M., Ehrilch, D., Florczyk, A. J., Freire, S., Julea, A., Kemper, T., … Syrris, V. (2016). GHS built-up grid, derived from Landsat, Multitemporal (1975, 1990, 2000, 2014) (version R2015). European Commission, Joint Research Centre (JRC) [Dataset]. Retrieved from http://data.europa.eu/89 h/jrc-ghsl-ghs_built_ldsmt_globe_r2015b
- Pesaresi, M., Ehrilch, D., Kemper, T., Siragusa, A., Florczyk, A., Freire, S., & Corbane, C. (2017). Atlas of the human planet 2017: Global exposure to natural hazards. EUR 28556 EN. European Commission, Joint Research Centre, Institute for the Protection and Security of the Citizen. Retrieved from https://ec.europa.eu/jrc/en/publication/eur-scientific-and-technical-research-reports/atlas-human-planet-2017-global-exposure-natural-hazards
- Pesaresi, M., & Gerhardinger, A. (2011). improved textural built-up presence index for automatic recognition of human settlements in arid regions with scattered vegetation. IEEE Journal of Selected Topics in Applied Earth Observations and Remote Sensing, 4, 16–26.10.1109/JSTARS.2010.2049478
- Pesaresi, M., Gerhardinger, A., & Kayitakire, F. (2008). A robust built-up area presence index by anisotropic rotation-invariant textural measure. IEEE Journal of Selected Topics in Applied Earth Observations and Remote Sensing, 1(3), 180–192. doi:10.1109/JSTARS.2008.2002869
- Pesaresi, M., Melchiorri, M., Siragusa, A., & Kemper, T. (2016). Atlas of the human planet – Mapping human presence on earth with the global human settlement layer. JRC103150. Publications Office of the European Union. Luxembourg: European Commission, DG JRC.
- Pesaresi, M., Syrris, V., & Julea, A. (2016a). A new method for earth observation data analytics based on symbolic machine learning. Remote Sensing, 8(5), 399. doi:10.3390/rs8050399
- Pesaresi, M., Syrris, V., & Julea, A. (2016b). Analyzing big remote sensing data via symbolic machine learning. In Proceedings of the 2016 Conference on Big Data from Space (BiDS’16) (pp. 156–159). doi:10.2788/854791
- Peters, A. J., & Janyst, L. (2011). Exabyte scale storage at CERN. Journal of Physics: Conference Series, 331(5), 052015. doi:10.1088/1742-6596/331/5/052015
- Sabo, F., Corbane, C., & Ferri, S. (2017). Inter-sensor comparison of built-up derived from Landsat, Sentinel-1, Sentinel-2 and SPOT5/SPOT6 over Selected Cities. EUR 28520 EN. JRC105855. Luxembourg: Publications Office of the European Union. doi:10.2760/385820
- Schistad Solberg, A. H., & Jain, A. K. (1997). Texture fusion and feature selection applied to SAR imagery. IEEE Transactions on Geoscience and Remote Sensing, 35(2), 475–479. doi:10.1109/36.563288
- Schneider, A., Friedl, M. A., & Potere, D. (2009). A new map of global urban extent from MODIS satellite data. Environmental Research Letters, 4, 044003.
- SDG Goal 11 Monitoring Framework – UN-Habitat. (2017). Retrieved July 13, from https://unhabitat.org/sdg-goal-11-monitoring-framework/
- Soille, P., Burger, A., De Marchi, D., Kempeneers, P., Rodriguez, D., Syrris, V., & Vasilev, V. (2017). A versatile data-intensive computing platform for information retrieval from big geospatial data. Future Generation Computer Systems. doi: 10.1016/j.future.2017.11.007
- Soille, P., Burger, A., Rodriguez, D., Syrris, V., & Vasilev, V. (2016). Towards a JRC earth observation data and processing platform. In Proceedings of the conference on big data from space (BiDS’16), Santa Cruz de Tenerife, Spain (pp. 15–17).
- Syrris, V., Corbane, C., & Soille, P. (2017). A global mosaic from copernicus Sentinel-1 data. In Proc. of the 2016 Conference on Big Data from Space (BiDS’17). Vol. in press. Toulouse: European Union.
- Taubenbock, H., Esch, T., Felbier, A., Roth, A., & Dech, S. (2011). Pattern-based accuracy assessment of an urban footprint classification using TerraSAR-X data. IEEE Geoscience and Remote Sensing Letters, 8, 278–282.10.1109/LGRS.2010.2069083
- Thain, D., Tannenbaum, T., & Livny, M. (2005). Distributed computing in practice: The Condor experience. Concurrency and Computation: Practice and Experience, 17(2–4), 323–356. doi:10.1002/cpe.938
- Thomas, K., Ragan-Kelley, B., Pérez, F., Granger, B. E., Bussonnier, M., Frederic, J., … Ivanov, P. (2016). Jupyter notebooks – A publishing format for reproducible computational workflows. Stand Alone, 87–90. doi:10.3233/978-1-61499-649-1-87
- United Nations. (2015). United Nations Treaty Collection. Retrieved from https://treaties.un.org/pages/ViewDetails.aspx?src=TREATY&mtdsg_no=XXVII-7-d&chapter=27&clang=_en
- United Nations. (2017). Sustainable Development Goals - United Nations. United Nations Sustainable Development. Retrieved October 17, from http://www.un.org/sustainabledevelopment/sustainable-development-goals/
- United Nations Conference on Housing and Sustainable Urban Development. (2016). The New Urban Agenda. Habitat III. Retrieved from http://habitat3.org/the-new-urban-agenda/
- United Nations International Strategy for Disaster Reduction. (2015). Sendai Framework for Disaster Risk Reduction 2015–2030. Retrieved from http://www.wcdrr.org/uploads/Sendai_Framework_for_Disaster_Risk_Reduction_2015-2030.pdf