
Abstract
This paper explores for the first time the contents, structure and relationships across institutions and disciplines of a global Big Earth Data cyber-infrastructure: the Global Earth Observation System of System (GEOSS). The analysis builds on 1.8 million metadata records harvested in GEOSS. Because this set includes almost all the major large data collections in GEOSS, the analysis represents more than 80% of all the data made available through this global system. We explore two major aspects: the collaborative networks and the thematic coverage in GEOSS. The first connects the contributing organisations through the more than 200,000 keywords used in the systems, and then explores who is citing whom, a proxy for of institutional thickness. The thematic coverage is analysed through neural network algorithms, first on the keywords, and then on the corpus of 653 million lemmatised lower case words built from the titles and abstracts of all 1.8 million metadata records. The findings not only give a good overview of the GEOSS data universe, but offer immediate priorities on how to increase the usability of GEOSS through improved data management, and the opportunity to augment the metadata with high level concept that synthetise well the contents of the data-set.
1. Introduction
This paper explores for the first time the contents, structure and relationships across institutions and disciplines of a global Big Earth Data cyber-infrastructure: the Global Earth Observation System of System (GEOSS). GEOSS has developed over the last 12 years under the aegis of the Group on Earth Observations, a voluntary partnership of more than 100 national governments and 100 Participating Organisations to achieve comprehensive, coordinated and sustained observations of the Earth and improve monitoring and prediction of the state of the planet (Group on Earth Observation, Citation2017).
From the beginning GEOSS was conceived as a “system of systems”, that is a loose confederation of existing and future Earth observation and data management systems. Because of the voluntary nature of GEO, the development of its system of systems has happened largely from the bottom up exploiting opportunities and the willingness of the partnering organisations to contribute to this global endeavour. GEOSS has had a remarkable success and now includes thousands of data providers and hundreds of millions of data resources, mostly available on a full and open access basis (Nativi et al., Citation2015). This wealth of resources is increasingly looked upon to support key international initiatives such as the Sustainable Development Goals (United Nations, Citation2015), the Paris agreement on climate change (United Nations, Citation2016) and the Sendai framework on disaster risk reduction (United Nations Office for Disaster Risk Reduction, Citation2015). This more strategic, top-down demand challenges the bottom-up organic growth model followed thus far. There is a need therefore to manage the GEOSS more effectively, linking it better to user needs and strategic priorities.
The first step to manage is to understand better structure, content and characteristics of this emergent cyber-ecosystem. The techniques developed for this project undertaken by the European Commission Joint Research Centre (JRC), and the Italian National Research Council (CNR), make extensive use of deep neural networks and big data analytics. The innovative nature of the paper come from the richness of information extracted through these techniques in such a vast and complex environment such as GEOSS. The paper is organised as follows: after this first introduction, Sections 2 and 3 provide the background on GEO and GEOSS, respectively, Section 4 introduces the research questions, Section 5 explains the characteristics of the data used for the project, Section 6 presents the key findings, Section 7 discusses the importance of the work in the context of Big Earth Data analytics and Section 8 concludes with an indication of the next stages of the research.
2. Background on GEOSS
The development of GEOSS is framed by the Plan of Implementation of the 2002 UN World Summit on Sustainable Development, which commits to “Promote the development and wider use of earth observation technologies, including satellite remote sensing, global mapping and geographic information systems, to collect quality data on environmental impacts, land use and land-use changes, including through urgent actions at all levels” (United Nations, Citation2002, para. 132).
The leaders of the G8 group of industrialised countries committed to the development of GEOSS in their 2005 meeting at Gleneagles, stating that:
The G8 made a commitment at Evian to strengthen international cooperation on global Earth observations. We will continue to exercise leadership in this area, and welcome the adoption of the 10-year implementation plan for development of the Global Earth Observation System of Systems (GEOSS) at the Third Earth Observations Summit which took place in Brussels in February this year. We will:
(a) move forward in the national implementation of GEOSS in our member states;
(b) support efforts to help developing countries and regions obtain full benefit from GEOSS, … (G8, Citation2005, para. 34).
Supporting sustainable agriculture and combating desertification (agriculture).
Understanding, monitoring and conserving biodiversity.
Understanding, assessing, predicting, mitigating and adapting to climate variability and change.
Reducing loss of life and property from natural and human-induced disasters.
Improving the management and protection of terrestrial, coastal and marine ecosystems.
Improving the management of energy resources.
Understanding environmental factors affecting human health and well-being.
Improving water resource management through better understanding of the water cycle.
Improving weather information, forecasting and warning.
Whilst for the purpose of this paper, we will focus in particular on the achievements and challenges of developing GEOSS as an information system of systems, it is important to recognise two other issues: the first, is that GEO is more than information and technologies, it is above all an open and voluntary partnership among most of the countries in the world to support a better husbandry of the planet. Two of the three strategic objectives for the period 2016–25 are essentially social: Advocate the importance of Earth observations, and Engage with stakeholder communities to address global and regional challenges. Only the third, to Deliver data information and knowledge has a stronger technological underpinning. The second important issue, is that one of the most important achievements of GEOSS has been to find an agreement at the global level on the GEOSS Data Sharing Principles:
Data, metadata and products will be shared as open data by default, by making them available as part of the GEOSS Data Collection of Open Resources for Everyone (Data-CORE) without charge or restrictions on reuse, subject to the conditions of registration and attribution when the data are reused.
Where international instruments, national policies or legislation preclude the sharing of data as open data, data should be made available with minimal restrictions on use, and at no more than the cost of reproduction and distribution.
All shared data, products and metadata will be made available with minimum time delay (Group on Earth Observation, Citation2015a).
The adoption of Data Management Principles (DMP) and related guidelines (GEO, Citation2015b) is another important milestone because the full exploitation of the data and services made available through GEOSS can only take place if these are reliably well maintained and curated. The DMP address metadata for discovery, online access, data encoding, documentation, traceability, preservation, verification, review and reprocessing and persistent and resolvable identifiers. As indicated in Section 6, there is still a significant road ahead to ensure that these principles are widely implemented by all the organisations contribution to GEOSS. The importance of the research presented in this paper is that only by analysing the content, structure and relationships in the data ecosystem of GEOSS, it is possible to identify strategic issues and priorities with respect to the management of the system of system and of the data.
3. The development of the system of systems
The development of GEOSS has been at the centre of achieving the vision of GEO from the very beginning, and therefore featured prominently in the initial 10-year implementation plan (2005–10). As indicated in Section 1, GEO is a voluntary initiative, and the building of GEOSS is based on a multitude of individual earth observing systems from space, air, land and sea, each continuing to operate independently with their own governance structure. The task of making these independent systems operate as one in the eyes of the users was entrusted to the GEOSS Architecture and Data Committee in 2006, chaired by the US Federal Geographic Data Committee (FGDC).
The initial reference architecture for this SoS was that of the National Spatial Data Infrastructure of the US, which had become the model for many similar initiatives across the world (Masser, Citation2005; Rajabifard, Feeney, Williamson, & Masser, Citation2003). It therefore included as central components (which became known as the GEOSS Common Infrastructure, or GCI), a Clearinghouse containing the metadata description of the data, services and products available in the individual systems participating in GEOSS, a web-portal for user interaction, and a series of registries of GEOSS components, services, standards and special interoperability arrangements among systems (See ).
Figure 1. GEOSS components.
Source: Group on Earth Observation (Citation2007).
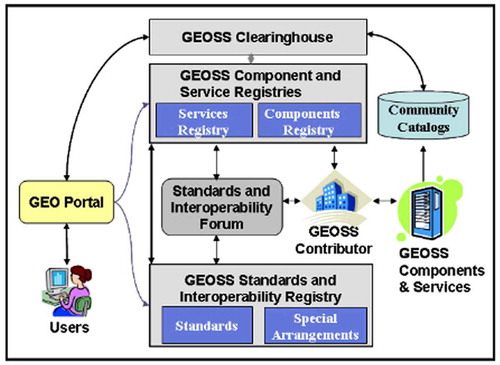
After an initial period of testing with three different portals and three clearinghouses provided by different organisations, the GCI entered in the operational phase in 2010 with one clearinghouse managed by the US FGDC, and a geoportal managed by the European Space Agency (ESA), whilst other registries where managed by IEEE. Whilst a positive result from the architectural standpoint, the offering of the GCI was limited to a few hundred data-sets and services. This was largely because the reference model adopted was based on standards familiar to the geographic data community (and in particular ISO 19115 for Metadata) but no so widely used by the many other disciplinary communities participating in GEOSS. Moreover, given the voluntary nature of the initiative, there was little evidence of an appetite to change established practices and adopt new standards for not visible benefit.
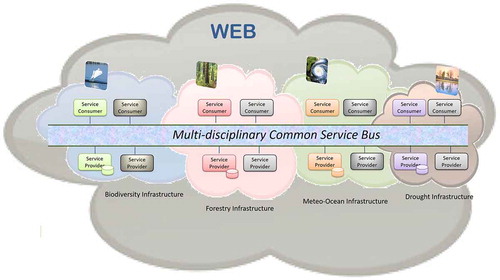
A major conceptual breakthrough was adopted by the GEO Plenary in 2011 in the form of a brokering layer developed by the Italian National Research Council (CNR) and partners in a European Funded R&D project called EuroGEOSS (www.eurogeoss.eu) (Nativi, Craglia, & Pearlman, Citation2012, Citation2013; Vaccari, Craglia, Fugazza, Nativi, & Santoro, Citation2012). The starting point of this innovation, was the recognition and acceptance of the diversity of protocols, standards and professional practices of all the communities participating in GEOSS. From this point, the possibilities are essentially four to achieve interoperability: (1) the producers publish their data and services in all possible formats required by the users, or (2) the users learn to handle all the diverse format created by the producers. Either way a heavy burden for one side. Option, (3) is that both users and producers agree to a single set of standards, or federating service bus (see ). This was implied by the initial set up of GEOSS, and is the solution adopted in Europe by the INSPIRE Directive (EC, 2007) which, however, has the strength of legal enforcement and substantial funding from the EU Member States to support implementation. In the context of GEOSS, which is voluntary and with funding largely in kind or through R&D projects, this was not a viable solution.
Figure 2. Federation of multidisciplinary infrastructures via a common service bus.
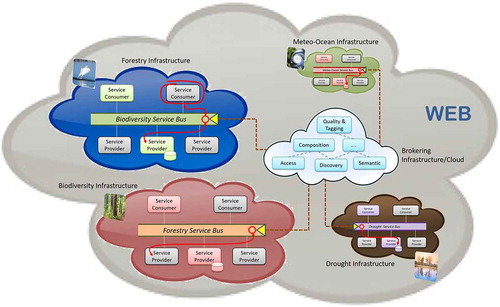
The solution adopted was instead to introduce a brokering middleware which mediates across the different infrastructures and disciplines by “translating” the metadata and data formats to a minimum common denominator thus enabling communication across the infrastructure for discovery and access – as showed in .
Figure 3. Brokered infrastructure.
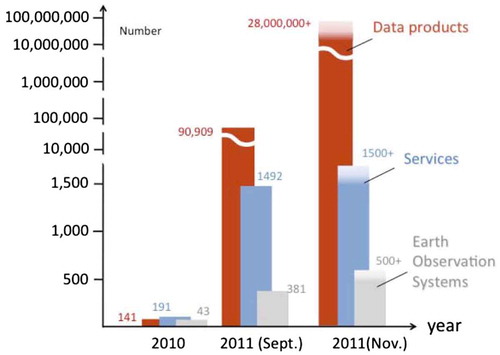
The success of adopting this solution became immediately evident (see ) because brokering allowed all the contributing infrastructure to stay the same without major change or investment. They just have to declare what standards (either Community or international ones) and protocols they support, then all the effort for mediation is taken on by the mediation services, implemented by a new GCI component called GEO Discovery and Access Broker (GEO DAB) (Nativi et al., Citation2015). As a result, in the space of little more than 1 year, the number of available resources jumped from a few hundred in 2010, to several millions in 2011.
Figure 4. Impact of brokering in GEOSS.
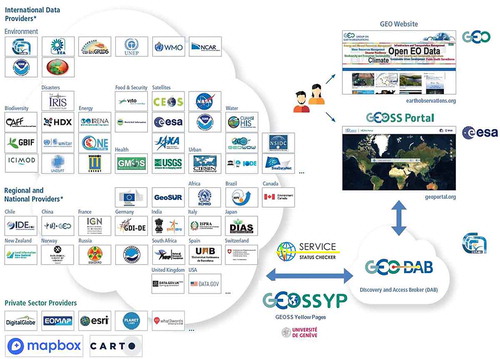
To date, the GCI includes the GEOSS Portal and the GEO DAB, which has replaced the Clearinghouse as discovery and access mechanism, in addition to a set of registries of contributing organisations and components. GEOSS is then composed of this central infrastructure which brokers more than 150 large scale facilities () giving potential access to more than 400 million data resources (e.g. just CEOS, the Committee on Earth Observation Satellites, has more than 280 million images of the Earth among its partners).
Figure 5. The GEOSS structure.
In spite of the progress made in developing GEOSS and the GCI in the first decade, there is a recognised gap between the work done by the data providers, technologists and engineers developing the GCI, and the scientific community working on the more thematic tasks in GEO aligned to the application areas. As a result, too little use is made of the resources made available through the GCI. This problem is compounded by the sheer scale and diversity of these resources which makes discovery possible but access and use of the data much more difficult.
With these considerations in mind, the GEO Strategic Plan (2016–25) sets the priorities for the further evolution of GEOSS:
To continue leveraging these successes through 2025, GEO will evolve GEOSS and its infrastructure to meet current and emerging needs by:
extending the user audience to decision-makers and the general public;
placing additional focus on the accessibility and usability of Earth observation resources to improve our scientific understanding of the Earth processes, and enhance our predictive capabilities that underpin sound decision-making;
providing a service framework to engage partners and user communities in evolving the current infrastructure to enable collaborative tools for co-creation of products and services suitable for effective exploitation by user communities; and
evolving the current system of systems component-based architecture with an open systems platform that is flexible, sustainable and reliable for data access, integration and use and the delivery of knowledge-based products and services (Group on Earth Observation, Citation2015a, pg. 10).
4. The research questions
As part of the activities in GEOSS EVOLVE, the JRC and the CNR have launched this study to analyse the contents structure and relationships in the GEOSSS ecosystems. The study builds on earlier work by one of the co-authors on the INSPIRE infrastructure, in which he analysed the evolution of the infrastructure over time, and the relationships between institutional organisation in the physical world of public administration and in the cyberspace projections of that world via INSPIRE (Hradec, Lima, Tomas, & Fullerton, Citation2017).
Building on this experience, this analysis of the GEOSS ecosystem after 10 years of development, asks questions that may seem ordinary but have never been asked before, and where answers are not entirely obvious considering the extent of the GEO System of Systems and the volume of resources shared. They include:
Who is contributing to GEOSS: which organisations, what is their geographical distribution?
What are the relationships among the organisations and the data they provide if at all evident in the ecosystem?
Which thematic areas are covered/ can we detect any significant gap?
5. The data used
5.1. Data sources
As indicated earlier the interaction between the enterprise systems contributing to GEOSS is mediated by the GEO-DAB. The brokering is implemented through three possible belonging options:
| (a) | Harvesting: GEO DAB harvests the whole metadata content of the enterprise system. | ||||
| (b) | Query forwarding: GEO DAB distributes (i.e. forwards) all the queries submitted by GEOSS Users on-the-fly – only mediation tasks are performed by the DAB. | ||||
| (c) | Hybrid: a mix of the previous two approaches. GEO DAB harvests the high-level metadata collections (to finalise the so-called first-level queries) and distributes the requests dealing with the data “inside” a given collection – the second-level queries. | ||||
It is important to distinguish the meaning of “first” and “second” level of query in the Hybrid option: the first targets data collections (e.g. spatial or temporal data series, mission or campaign data collections, instrument data series), whilst the second one deals with the single data contained in a data collection (in GEOSS, these data are called data granules). It is possible that a data granule does not belong to any data collection, but it is not possible that a data collection does not contain any data granules. Typical data organised through collections and granules are satellite data, mapping and cadastral data series.
A data granule that does not belong to any data collection is called siblingless data granule. This is often the case of in situ or research data made available by public administrations, universities, or large research data archives like Pangaea. In GEOSS, a first-level query addresses both data collections and siblingless data granules. Second-level queries target all data granules. In August 2017, GEOSS managed about 44.5 millions data collections and siblingless data for a total of more than 400 million discoverable data granules.
This research has utilised the GEOSS harvested metadata records, only. Therefore, only those enterprise systems implementing the Harvesting and the Hybrid belonging approaches were considered. Out of the about 44.5 million records (i.e. data collections and siblingless data granules), the harvested records at first-level query are around 1.8 million – i.e. around 4%. However, as many of these records are large data collections (and hence they represent their data granules, as well), the utilised sample actually represents the 89% of the total GEOSS data granules. This assumption is acceptable for this analysis study because it mainly focused on a set of metadata elements that data collections usually summarise well for the granules they contained, such as organisations, keywords, title and abstract. The largest collections considered are provided by CEOS and FedEO systems. The number of their data granules is about 280 and 82 million, respectively.
Some enterprise systems were not included because they are currently brokered by applying the Query forwarding belonging approach – i.e. Global Biodiversity Information Facility (GBIF), USGS Earthquake Events, National Institute for Space Research – Brazil (INPE), ArcGIS Online ESRI. The Hydrologic Information System (CUAHSI-HIS) was not included because it is still in the transition between the Query forwarding and the Harvesting belonging approach. The SeaDataNet system granules were not considered because they are not accessible and it is not possible to establish a reliable collection-granules metadata relationship. All the above systems represent about the 11% of the present GEOSS metadata content.
Metadata harvested by the GEO-DAB are stored in Big Data HStore database. Data were shared with JRC team through Amazon Web Services and replicated locally. The 1.8 million first-level metadata came in 171 zip files, 6 GB in size, unpacked to 1 828 997 files, 42 GB of text data all together.
5.2. Data preparation
All metadata records passed validation for adherence to ISO19139 metadata standard so the first step was to create a seamless database containing all the records for the thematic, spatial and temporal analysis of the GEOSS content. Parsing the metadata revealed several important deviations that can be described as ISO19139 flavours. OGC XMLs are difficult to parse due to their complexity and frequent interpretations of the standards made the conversion rather more difficult. The final data conversion was thus more probabilistic than hoped for. On the bright side, all metadata records contained titles, abstracts and keywords which are the main focus of the analysis presented in this paper. Most records were in English, another plus, but we had to translate some 300,000 records from one of the other 35 languages present in GEOSS. We used for this task the European Commission Machine Translation service (EC-MT) which worked very well, and could be trained on translation pairs relevant to the domain knowledge covered by GEOSS. Therefore, we have received consistent translation even of many technical terms.
Out of many findings from the analysis, we present here the two most interesting: institutional collaborative networks and the GEOSS thematic coverage. All the analytics were performed in Python and visualisations finalised in Gephi (https://gephi.org/ ) or Tulip (http://tulip.labri.fr/TulipDrupal/).
6. Findings
6.1. Collaborative networks
The first question we asked was: “who are the data providers in GEOSS”? Simple question but not so easy to answer because there are several fields in the metadata that offer relevant information such as originator, contact organisation, distributor and contributor, referring to either the data or the metadata record, and in a system of fully autonomous data systems with many different policies and practices, it is not immediately clear what the results of the enquiry mean. Just to give an example, there are more than 10,000 contact organisations in the metadata, but this cannot be used as the number of data providers because almost half a million records have no contact information, some contacts refer to data brokers or archives such as Pangaea (https://www.pangaea.de/), which appears as contact more than 350,000 times, and several thousand contact organisations are in fact the URLs of jpeg images from aerial surveys.
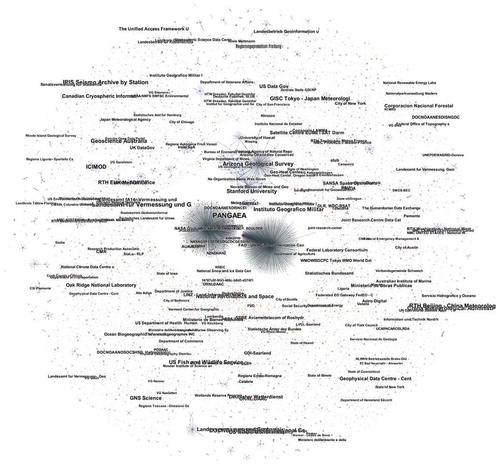
We proceeded therefore in steps. The first was to design a graph network by connecting metadata field Contact Organisation (CI_ResponsibleParty) (cleaned of spurious entries) with the field Distributor (MD_Distributor). The graph is shown in . What we see are data distribution centres linking the institutions for whom the centres are distributing data. The three sea urchin-like data distribution networks are centred around Arizona Geological Survey, FAO – UN AGL Documentation Center and NASA Global Change Master Directory. From the graph we realised that:
There are 10,303 nodes linked by 2650 connections. However, many institutions known to collaborate (e.g. all institutions publishing data through PANGAEA) have not shown up as connected here.
There must be many institutions missing as some major data hubs appear to be almost or not connected at all (e.g. PANGAEA seems to be linked only to one other organisation).
Practically all providers and distributors are real institutions, communities and companies because names of people or places do not show up in the graph.
Figure 6. Graph of contact organisation and distributor.
The list of most frequently cited institutions is shown in (numbers include all mentions) with a total of 12,427 names (7347 without hyperlinks).
Table 1. Most frequently cited institutions.
Citation was the most difficult part to parse because every data hub uses citation structurally differently and tagging styles differ even within the same provider. We decided therefore to link all the names from the fields distributor, contact organisation and citation (66,000 nodes) through 350,000 identified edges. The network layout shown in demonstrates several author clusters, ranging from “PANGAEA” cluster of nature science related institutions, US or Australian geology, Arctic research, etc. Small clusters formed at the fringe of the large ones have been identified as project teams where authors are citing all team members.
Figure 7. Who cites who in GEOSS (by organisation).
The graph in is a useful step but does not help identify different institutions and groups. As the graph behaves like a social network, we could run the basic modularity (Blondel, Guillaume, Lambiotte, & Lefebvre, Citation2008) community detection algorithm to try and provide greater clarity. The results are shown in . Individual communities are shown with different colours and unconnected organisations are left in grey.
Figure 8. Who cites who in communities of organisations.
The next step was to try and use location as an element able to give us more insights into the different communities. Once we removed the names of individual authors/contributors, the 66,000 nodes reduced to 10,947 which we geocoded using the Google Places API. There were about 1300 institutions mentioned in the citation field that could not be geolocated though their identification resembled institution names. The four main reasons were change of name, mixed languages or badly translated names, abbreviations and typos. Several URLs also contained typos (“ww.”) and needed to be checked through URL retrieval, WHOIS service and domain owner address cross validation (2355 unique domains used). The final count of institutions correctly identified was 9887 connected by 2756 edges. shows the connectedness of the network at different levels of filtering: 2451 nodes that had at least one connection, 403 nodes had at least two links and 141 institutions had three or more links. There are 31 institutions with 10 or more connections to other institutions.
Figure 9. Connectedness of institutions by citation: from left to right: at least 1 link, 2 links, 3–10, more than 10.
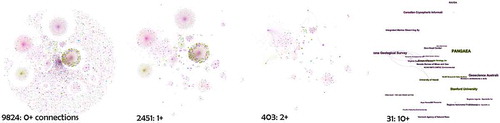
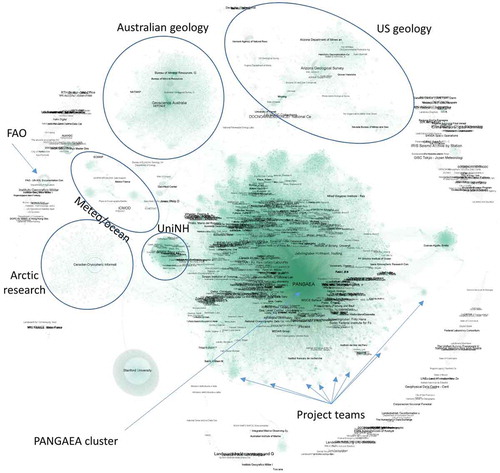
Using the geocoded institutors in as anchors, we included then all the individual authors cited in the metadata. shows an impressive collaborative network with less than 100 institutions not connected to anyone else. The largest cluster is around the USGS providing geological, mapping and satellite data such as Landsat. Drilling company reports feature quite prominently, as well as a strong geothermal community with prominent nodes around Stanford University, the Geo-Heat Center and World Geothermal Congress. Ocean research is the other large cluster, and we have highlighted in the Figure a prominent multi-domain international collaborative cluster. European networks are largely clusters around nature protection, with a clear group based in Germany. Pacific Ocean research highlights the contributions of Australia and New Zealand.
Figure 10. Labelled connectedness of institutions and authors by citation.
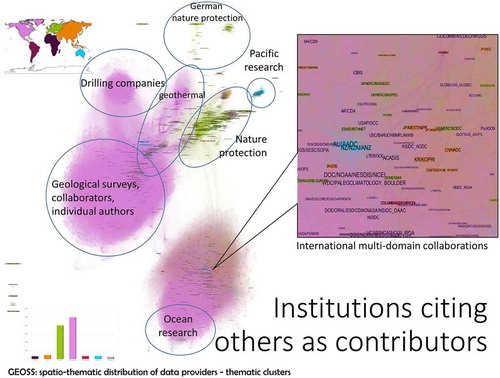
Compared with which displayed a strong European contribution around Pangaea, is striking for the predominance of North American academic and government institutions (the colour coding follows that of the bar chart at the bottom left corner). The stronger tradition of working together and citing each other’s contribution in the US compared to Europe is evident from this graph. This Figure can therefore be read as a measure of institutional thickness, and should be a matter of reflection for European research based on EO.
6.2. Thematic coverage
We used different approaches to explore the thematic coverage of the data contained in GEOSS as the systems and disciplines participating in GEOSS are very heterogeneous, and there is no agreed list of keywords or mapping of thesauri used by everybody. We started from the text analysis of the abstracts. To improve the quality of information obtained from this method, we used the Python library Spacy to identify noun chunks (uninterrupted string of adjectives and nouns) with frequency higher than 1000. These noun chunks were used to replace words in the corpus (e.g. tree ring width - > tree_ring_width).
6.2.1. Latent Dirichlet allocation (LDA)
There are 1.8 M first-level (L1) metadata records in the catalogue with rich abstracts. One of the information retrieval tasks is a topic modelling, with a notable technique called LDA (Blei, Ng, & Jordan, Citation2003). LDA is a generative statistical model able of unsupervised analysis and clustering of topics by provision of the most relevant words to identified clusters. When LDA was run over the whole corpus of the L1 metadata to generate 50 topics, the following was obtained (we show only 12 topics as example).
Table 2. Topic modelling over the GEOSS metadata.
The words chosen by the LDA algorithm for describing the topics represent the most typical words, not the unique ones. There are many drawbacks in using this technique: for example, the topic description requires interpretation and domain knowledge, it is difficult to know a priori how many topics to look for, and the algorithm is rather CPU intensive. We trained a Polynomial Naïve Bayes classifier to identify the number of metadata records associated to each topic. Though it performed better than other classifiers, we were getting false positives exceeding 20%, especially on fringe topics. Overall, we found that this approach provides a basic understanding of the contents covered by the first-level metadata (see Section 5.1), but is difficult to use to get the overall picture of the thematic coverage of GEOSS. We tried therefore other approaches as discussed below.
6.2.2. Keyword clusters
Clustering the keywords is often meaningful and it was interesting to see how the clusters will behave within such a large set of keywords. We knew that the keywords do not follow any dictionary/thesaurus and sometimes feels like they are meant to represent the content in detail (e.g. “Palynology on sediment profile Tso Kar in Ladakh” contains 666 keywords). This complexity was used in creation of a graph linking institutions and the keywords they use. In total, we found 198,767 unique keywords in all metadata records. In , one can easily identify thematic clusters, as similar institutions tend to use similar keywords if they come from similar linguistic background or use English.
Figure 11. Keyword clustering.
As we can see from , even the very basic graph based on co-occurrence of terms in one record can show us a lot on the contents of the whole infrastructure. The colours are coded blue-green-yellow with highly connected nodes in yellow. Size of nodes is given by the number of occurrences in the whole catalogue. Yet, the clusters are too large and difficult to navigate. Since the graph behaves like a social network, we can use community detection functions to help us better understand highly connected clusters as shown in .
Figure 12. Keyword clustering by community.
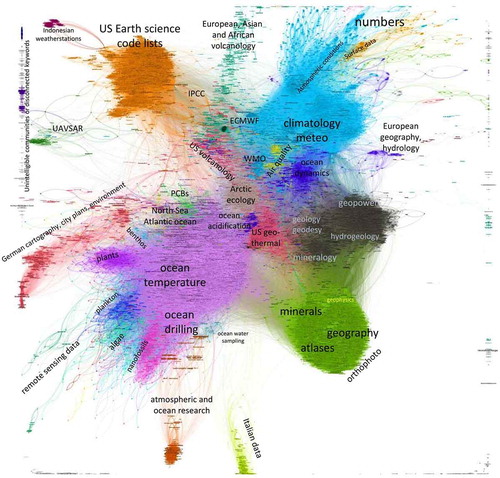
There were 1268 k-clusters identified with modularity: 0.771, k = 1. Lowering k would yield more clusters. The figure indicates the most prominent clusters as referring to ocean temperature and drilling, climate and meteo, earth sciences, minerals and hydrology.
6.2.3. Abstract and title word embedding
From practical experience, we know that the titles and abstracts are the richest elements of a metadata record, as keywords are often used rather randomly. There is much higher consistency in concepts obtained from the analysis of data abstracts than from the metadata keywords.
Neural network’s biggest advantage is its ability to learn patterns in very complex environments. We have trained neural network on English translated corpus of titles and abstract fields from all metadata records. In the CBOW model, the network learns to predict output word from it context, in skipgram to predict the context from the word given, therefore the name word embedding (Mikolov, Sutskever, Chen, Corrado, & Dean, Citation2013).
Our corpus consisted of 1.8 million documents, 653 million lemmatised lower case words without numbers and punctuation in 357 MB of plain cleaned text. The words were replaced with their bigrams when the count exceeded 10.000. The final model used CBOW in a 300 dimensional space with seven word negative sampling and down sampling the 100 most frequent words. Only words with frequency higher than 10 were used which resulted in vocabulary of 133 000 words. We utilised the Python library Genism (https://radimrehurek.com/gensim/about.html). The training for 50 iterations takes two hours on Intel Xeon CPU E5-2630 or practically the same time on Intel i7-6820HQ with 64 GB + RAM.
Keywords in GEOSS catalogue are using every possible synonym of any know research concept. What we wanted to learn were the real concepts. The word vectors calculated by the neural network have ability to push semantically similar words together due to similarities in the context as shown on the CBOW figure. Our text does not often come in sentences, yet the words show structural patterns. To explore this ability, we searched for the most similar words, as shown in .
Table 3. Similarity of concept emerging from the use of the CBOW model.
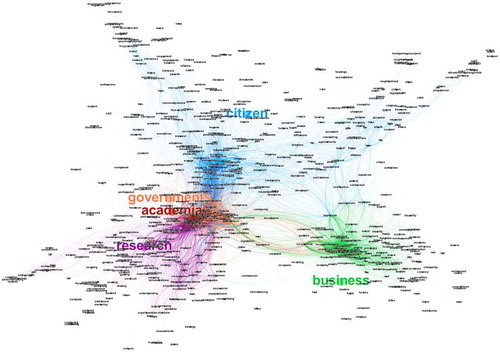
We can see that despite the relatively small corpus with highly varied dictionary, the results are quite encouraging especially for the high frequency words. One word cannot replace the whole concept so networks of word similarities were created. To explore semantic context, we have created small networks of word similarities to better understand how the concepts interlink in the GEOSS corpus. We have picked themes of our interest and had the CBOW-based network analyse the hierarchical similarities at three levels. All levels included links to words in the upper hierarchy maximising the capability of the neural network to find a word for given context.
The most interesting finding was that this neural word embedding can not only extract the semantic meaning of the word but also perception of themes by data providers. We wanted to understand roles first. Please notice in how government gets close to academia with more than half most similar words overlapping, concepts business and citizen meet in employee, administrator and applicants; government and business meet in investments; and research/academia/governments/citizen share the join keywords projects and program/programs/programme. Very interesting was to discover that research and citizen meet in words advice, specialist and discussions.
Figure 13. Different stakeholders as emerging for the neural network analysis.
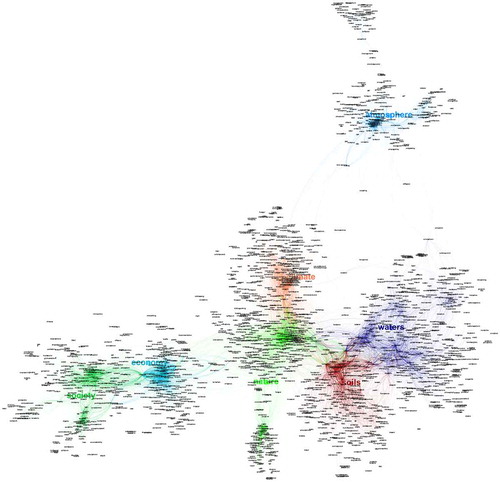
shows the content interactions. Society meets economy dominantly in interests, competitiveness, citizens and professionals. Citizen, economy and nature meet in words regulatory and weakly also in the word federal hinting on German origin of data. Soils and nature shares landscape, habitats and also share areas with water. Climate has most links with nature in variability, environmental, ecological, urbanisation and ecology. Climate meets water in temperate, warmer, floods. Climate meets atmosphere in precipitation, rain, reconstruction, emissions and thermohaline. Water–climate interactions are advection, wind-driven, undercurrent and crust. Also very interesting is the interaction of water–climate–nature in words communities, environments, regions, sites and areas.
Figure 14. Different thematic areas as emerging for the neural network analysis.
These models obviously work really well on word level and we could start exploring the real tasks on document similarity. The problem with all methods used so far was representativeness. Even when we used total keyword count as the keyword node size, still it said too little about the keyword distribution among data-sets and we got thematic clusters instead of metadata-by-theme clusters. LDA was trying to choose document topics considering cluster sizes but number of clusters was picked by guessing and topics alone require deep thematic knowledge to interpret. Organisation-keyword clusters were a nice workaround but were not working well for detailed view.
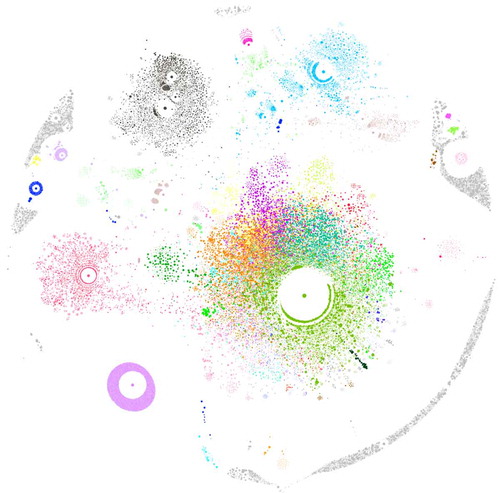
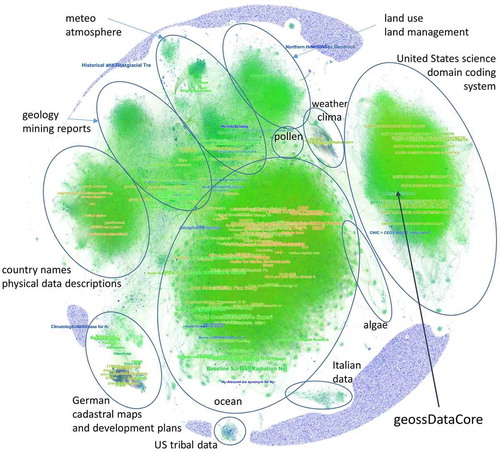
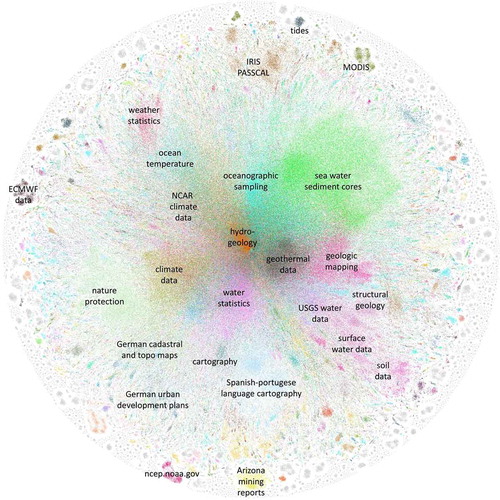
Therefore, we reused the word vectors calculated for the pictures above for highly representative clustering. By running simple mean on 300-dimensional vectors of all words present in metadata titles and abstracts, we were able to calculate document vectors (again, 300 dimensional) and thus summarise the document content. Consequently, we have attempted to cluster the documents using H/DBSCAN and spectral clustering but the matrix of 1,800,000 × 300 floats was too big for the algorithms. t-SNE 2D reduced picture shown that guessing game with the number of clusters and KMeans, Ward or agglomerative clustering had dubious results. Consequently, we have employed network analysis. For every document, we have calculated three most similar neighbours so the contents are fully reflected. Finally cluster detection was computed through network modality. We believe the resulting picture () is the best representation of GEOSS to date with respect to both the content domains and how these domains are represented by the contributors to GEOSS.
Figure 15. GEOSS domains as extracted from titles and abstracts.
7. Discussion: why this is a good case study of big data analytics
Big Data not only revolutionised the data management infrastructures but also required a profound change of those tools traditionally used for predictive analytics and the way of thinking about knowledge extraction and interpretation (NGDATA, Citation2013). For example, traditional statistical solutions typically focus on static analytics that is limited to the analysis of samples fixed in time. This is not a reliable approach for Big Data as the range of potential correlations and relationships between very diverse and large data sources is too complex and dynamic to be fully handled – i.e. modelled, tested and assessed. For these reasons, Big Data analysts have looked at machine learning systems as a valuable instrument for Big Data analytics (Harper, Citation2015; SKYTREE, Citation2017).
Machine learning deals with algorithms that improve automatically through experience in time (Jordan & Mitchell, Citation2015). They can learn from data with a limited (or nil) human supervision. In the last decade, the use of machine learning has spread rapidly throughout computer science and beyond (Domingos, Citation2012). Machine learning techniques have been successfully utilised in a variety of applications – e.g. natural language processing, spam filter, medical diagnosis. In the “Big Data” era, the use of machine learning models to develop solutions to the problem of obtaining useful insights, predictions and decisions from the vast amount of diverse data have become more and more popular (Jordan & Mitchell, Citation2015).
Since machine learning techniques are data driven and run at machine scale, the more data fed into a machine learning model, the more this can learn and apply the results to better discover and display the patterns buried in the data. In the case of GEOSS, the amount of data fed into the model was significant. However, considering the content heterogeneity of GEOSS data, an important challenge was the definition of the machine learning model – see Section 6.
In the scientific literature, four main categories of machine learning algorithms are recognised: (1) supervised, (2) unsupervised, (3) semi-supervised and (4) reinforcement learning. In supervised algorithms the training data (aka labelled data) is a sequence of (x, y) pairs – where x is the input and y is its associated output. The aim of supervised algorithm is to deduce from training data a functional relationship (i.e. equations and numerical coefficients or weights) that “link” x to y. (Wang & Summers, Citation2012). Unsupervised learning, generally, involves the analysis of unlabelled data (i.e. training data are just a collection of x values) under assumptions about structural properties of the data (e.g. algebraic, combinatorial or probabilistic) (Jordan & Mitchell, Citation2015). The main purpose is to discover relationships between the samples or reveal the latent variables behind the observations (Wang & Summers, Citation2012). Dimension reduction and clustering are examples of unsupervised learning. In semi-supervised learning, training data are composed of both labelled and unlabelled data. This technique is usually applied to augment labelled data in a supervised learning context (Jordan & Mitchell, Citation2015) – e.g. because data labelling is expensive or impossible in some applications (Wang & Summers, Citation2012). In reinforcement learning, training data are in-between the supervised and unsupervised cases. Instead of training examples that indicate the correct output for a given input, the training data in reinforcement learning are assumed to provide only an indication as to whether an output is correct or not. However, if an output is incorrect, there remains the problem of finding the correct output (Jordan & Mitchell, Citation2015). This research developed a semi-supervised learning algorithm as the GEOSS data ingested are noisy in terms of imprecise and hidden/latent values.
This sophisticated model is a significant example of Big Earth Data machine learning algorithm for a Global and multidisciplinary System-of-Systems (SoS) in the domain of Global Changes and Sustainable Development. Considering the worldwide spread of data systems contributing to GEOSS, the extreme diversity of shared data and the profound multi-organisational nature of contributions, the developed machine learning model is the first one (at the best of our knowledge) for such a complex Big Earth Data domain. Other global Big Earth Data SoS could be interested in using that for analysing the patterns and gaps of their supply chain.
The machine learning model utilised for this study demonstrated to be extremely useful to make sense of the volume of data that GEOSS have been collecting in the last decade by brokering a vast collection of sources that share very diverse content. The algorithm developed provided a valuable tool to explore and analyse the mine of (implicit) information presently stored in GEOSS and recognised important patterns and relationships as shown in Section 6.
8. Conclusions
This paper has provided the first ever view of the GEOSS data universe. As indicated in Section 5, although we have used only the 1.8 million metadata records harvested by the GEO-DAB, we have covered more than 80% of the all data in GEOSS, as the vast majority of the large data collections are included in our work. This is Big Earth Data in terms of size, variety and dynamics. It is also very rich data, and in this first part of our work we have just started scratching the surface of this data universe, characterising the collaborative networks (Section 6.1) and the thematic coverage (Section 6.2). The network analysis has linked organisations by keyword and citation. The former already highlights disciplinary bundles to some degree as contributors from similar disciplines tend to use similar keywords. The huge range of keywords used in GEOSS however, almost 200,000, shows that there is much room for improvement in data management, for example by providing some hierarchical structure to the keywords, linking together the higher level concepts and reaching some agreement among providers to use at least 1 or 2 terms from these higher concepts to label the data, in addition to the keywords currently used. This would already be very helpful to help users navigate the system and find data of relevance to them – the GEO initiatives for defining a set of Essential Variables can valuably contribute to that.
The analysis of links by citation among organisations first, and then all contributors, including individuals, has yielded two interesting insights. First of all, the use of filtering in the degree of connectivity () has identified clearly those nodes in the network that are the most connected. They then become priority targets for measure to improve the usability of the system: if convinced to adopt better data management practices (e.g. with respect to the use of keywords, licencing terms and conditions, unique identifiers and so on), they can have a very high impact because they are so well connected to others in the network. We will follow this up in the GEO context with the relevant groups responsible for the operations of the GEOSS Common Infrastructure, data sharing, data management and the evolution of the GEOSS architecture (i.e. the GEOSS EVOLVE initiative). The second insights came from the analysis of all citation connections. Here the predominance of North American institutions in the graph () became very visible compared to previous illustrations of the GEOSS network (e.g. ). We have referred to this as “institutional thickness”, i.e. a measure of established collaborations between, in this case, government agencies and academia that is obviously much more established, at least in the area of Earth Observation, in North America than in Europe or Asia. This should be a matter of reflection for organisations in charge of research policy, and we will follow this up with colleagues in Europe.
Section 6.2 has focused on the use of neural networks to extract information from unstructured content – i.e. the Abstract in the metadata characterising each data element. The text in the Abstracts is unstructured because it is not characterised by any predefined data model or not organised in a predefined manner, and can contain dates, numbers and facts – in some cases extremely useful for the scope of GEOSS. Usually, this information is called implicit to distinguish it from the explicit one, encoded using structured (e.g. DB fields) or semi-structured (e.g. HTML/XML/RDF elements) data. For historical and economic reasons, it is quite common to find valuable metadata information hidden in the Abstract – e.g. temporal acquisition, spatial and temporal resolutions, provenance elements.
As shown, the algorithms developed have been extremely useful to characterise the relationships between stakeholders (government, academia, business, individual contributors) and topic areas and more generally when reapplied to the entire corpus to characterise the main semantic/thematic structure of the GEOSS universe. This information can be used by GEOSS to augment the officially recorded metadata elements by stating extra metadata elements. The Brokering layer (i.e. the GEO DAB) might take care of this task, in keeping with its scope. Such augmentation would significantly improve GEOSS discoverability functionalities providing more evidences for a correct use of discovered data – i.e. supporting a better fit-for-purpose selection criterion. Naturally, GEOSS would also consider feeding the data providers back with the extracted information, as a valuable service and for an assessment.
Metadata augmentation is getting more and more present in large SoS, where metadata maturity and completeness is not always homogeneous across the diverse contributing systems. For example, the National Science Digital Library (NSDL) is exploring options for augmenting harvested metadata and re-exposing the augmented metadata to downstream users with detailed information on how it was created and by whom (Hillmann, Dushay, & Phipps, Citation2004). Through the work presented in this paper there is an opportunity for GEOSS to follow this line to enrich user experience.
The next stages of the research will develop over three main strands: the first is to follow up on the findings of the work presented here with respect to data management and research policy issues. The second is to dig deeper into the GEOSS universe shown in , and start picking out individual “constellation”. As an example, from a European perspective, it will be interesting to identify the Copernicus “constellation”, i.e. all the organisations that connect to Copernicus, either as a keyword or in the Abstract, and then follow over time the evolution of this constellation as new initiative to increase access and use of Copernicus data are implemented. More generally, we can do longitudinal studies of the evolution of the GEOSS using the methodology presented in this paper to measure the impact of measures taken to improve the contents and organisations of the data in GEOSS. Last but by no means least, we plan to complement these studies that focus on the supply side of GEOSS, with work on the demand side, i.e. apply these methods to the large volumes of queries made to the GEOSS portals to identify who is searching for what, what is it they find and then try and connect better both demand and supply. The overall goal is to evolve this global system of systems to support more effectively the scientific and policy objectives the international community represented in GEO.
Disclosure statement
No potential conflict of interest was reported by the authors.
Data availability statement
The data referred to in this paper is not publicly available at the current time.
Notes
The views expressed are purely those of the authors and may not in any circumstances be regarded as stating an official position of the European Commission.
References
- Blei, D., Ng, A. Y., & Jordan, M. I. (2003). Latent Dirichlet allocation. Journal of Machine Learning Research, 3(2003), 993–1022.
- Blondel, V. D., Guillaume, J. L., Lambiotte, F., & Lefebvre, E. (2008). Fast unfolding of communities in large networks. Journal of Statistical Mechanics: Theory and Experiment, 10, 1000.
- Domingos, P. (2012). A few useful things to know about machine learning. Communications of the ACM, 55(10), 78–87.10.1145/2347736
- G8. (2005). G8 Gleneagles plan of action: Climate change, clean energy and sustainable development. Retrieved from http://www.g8.utoronto.ca/summit/2005gleneagles/climatechangeplan.html
- Group on Earth Observation. (2005). GEOSS 10-year implementation plan. Retrieved from http://earthobservations.org/documents/10-Year%20Implementation%20Plan.pdf
- Group on Earth Observation. (2007). `Report of the architecture and data committee. Retrieved from http://earthobservations.org/documents/geo_iv/08_Report%20from%20Architecture%20and%20Data%20Committee.pdf
- Group on Earth Observation. (2015a). GEO strategic plan 2016-25: Implementing GEOSS. Retrieved from http://earthobservations.org/documents/ministerial/mexico_city/MS4_GEO%20Strategic%20Plan%202016-2025%20Implementing%20GEOSS_approved_by_GEO-XII.pdf
- Group on Earth Observation. (2015b). GEO Data Management Principles Implementation Guidelines. Retrieved from http://earthobservations.org/documents/geo_xii/GEO-XII_10_Data%20Management%20Principles%20Implementation%20Guidelines.pdf
- Group on Earth Observation. (2017). About us. Retrieved from http://earthobservations.org/geo_community.php
- Harper, J. (2015). Improving big data analytics with machine learning-as-a-service. Retrieved from DATAVERSITY: http://www.dataversity.net/improving-big-data-analytics-with-machine-learning-as-a-service/
- Hradec, J., Lima, V., Tomas, R., & Fullerton K. (2017). INSPIRE Visual Analytics - dissecting the infrastructure. Retrieved from https://inspire.ec.europa.eu/events/conferences/inspire_2017/submissions/379.html
- Hillmann, D., Dushay, N., & Phipps, J. (2004). Improving metadata quality: Augmentation and recombination. In DCMI International Conference on Dublin Core and Metadata Applications (pp. 1–8). Shanghai: Dublin Core Metadata Initiative. Retrieved from http://dcpapers.dublincore.org/pubs/article/viewFile/770/766
- Jordan, M., & Mitchell, T. (2015). Machine learning: Trends, perspectives, and prospects. Science, 349(6245), 255–260.10.1126/science.aaa8415
- Masser, I. (2005). GIS worlds: Creating spatial data infrastructures. Redlands: ESRI Press.
- Mikolov, T., Sutskever, I., Chen, K., Corrado, G. S., & Dean, J. (2013). Distributed representations of words and phrases and their compositionality. Retrieved from http://papers.nips.cc/paper/5021-distributed-representations-of-words-and-phrases-and-their-compositionality.pdf
- Nativi, S., Craglia, M., & Pearlman, J. (2012). The brokering approach for multidisciplinary interoperability: A position paper. International Journal of Spatial Data Infrastructures Research, 7, 1–15. Retrieved September 2017, from http://ijsdir.jrc.ec.europa.eu/index.php/ijsdir/article/view/281
- Nativi, S., Craglia, M., & Pearlman, J. (2013). Earth science infrastructures interoperability: The brokering approach. IEEE Journal of Selected Topics in Applied Earth Observations and Remote Sensing, 6(3), 1118–1129.10.1109/JSTARS.2013.2243113
- Nativi, S., Mazzetti, P., Santoro, M., Papeschi, F., Craglia, M., & Ochiai, O. (2015). Big data challenges in building the global earth observation system of systems. Environmental Modelling & Software, 68, 1–26.10.1016/j.envsoft.2015.01.017
- NGDATA. (2013). Machine learning and big data analytics: The perfect marriage. Retrieved from NGDATA: https://www.ngdata.com/machine-learning-and-big-data-analytics-the-perfect-marriage/
- Rajabifard, A., Feeney, M. E., Williamson, I., & Masser, I. (2003). National spatial data infrastructures. In I. Williamson, A. Rajabifard, & M. E. Feeney (Eds.), Development of spatial data infrastructures: From concept to reality (pp. 95–109). London: Taylor & Francis.
- SKYTREE. (2017). Why do machine learning on big data? Retrieved from SKYTREE: http://www.skytree.net/machine-learning/why-do-machine-learning-big-data/
- United Nations. (2002). Plan of implementation of the world summit on sustainable development. Retrieved from http://www.un-documents.net/jburgpln.htm
- United Nations. (2015). The sustainable development goals. Retrieved from http://www.un.org/sustainabledevelopment/sustainable-development-goals/
- United Nations. (2016). Framework convention on climate change. Retrieved from http://unfccc.int/paris_agreement/items/9485.php
- United Nations Office for Disaster Risk Reduction. (2015). Retrieved from http://www.unisdr.org/we/coordinate/sendai-framework
- Vaccari, L., Craglia, M., Fugazza, C., Nativi, S., & Santoro, M. (2012). Integrative research: The EuroGEOSS experience. IEEE Journal of Selected Topics in Applied Earth Observations and Remote Sensing, 5(6), 1603–1611.10.1109/JSTARS.2012.2190382
- Wang, S., & Summers, R. (2012). Machine learning and radiology. Medical Image Analysis, 16(5), 933–951.10.1016/j.media.2012.02.005