
Abstract
Petascale archives of Earth observations from space (EOS) have the potential to characterise water resources at continental scales. For this data to be useful, it needs to be organised, converted from individual scenes as acquired by multiple sensors, converted into “analysis ready data”, and made available through high performance computing platforms. Moreover, converting this data into insights requires integration of non-EOS data-sets that can provide biophysical and climatic context for EOS. Digital Earth Australia has demonstrated its ability to link EOS to rainfall and stream gauge data to provide insight into surface water dynamics during the hydrological extremes of flood and drought. This information is supporting the characterisation of groundwater resources across Australia’s north and could potentially be used to gain an understanding of the vulnerability of transport infrastructure to floods in remote, sparsely gauged regions of northern and central Australia.
1. Introduction
The ubiquitous global coverage, diversity of information, and frequent revisit rates provided by public good satellites, such as the European Commission’s Sentinel missions, represent a previously unimaginable source of insight into the world’s progress towards the global challenges and development goals outlined in the United Nation’s 2030 agenda for sustainable development (Griggs et al., Citation2013; UN General Assembly, Citation2015). Similarly, the multi-decadal history of continuous information from the United States’ Landsat missions provides a robust baseline of historical change against which to compare our current progress.
The amount of data and information being provided by Earth observations from space (EOS) is enormous with Overpeck, Meehl, Bony, and Easterling (Citation2011) estimating that by 2030 there will be over 150 Pb of Earth observation data available for the climate domain alone. Numerous approaches have emerged in recent years to ensure that these growing volumes of data are organised and made available in a fashion that lowers the barrier to their use (e.g. Baumann et al., Citation2016; Gorelick et al., Citation2017; Lewis et al., Citation2017; Sinergise, Citation2017).
In May 2016, the Australian Government outlined over a half a billion dollars of investment to protect, enhance or monitor the health and productivity of the Australian landscape (e.g. Joyce & Nash, Citation2017). Australia’s size and comparatively sparse population make it impractical to build a comprehensive understanding of Australia’s land, coasts and oceans without harnessing the information that can be provided by continental scale EOS. Indeed, EOS have been identified as “… the single most important and richest source of environmental information for Australia” (Australian Academy of Science, Citation2009).
In recognition of these challenges, the Australian Government is establishing Digital Earth Australia (DEA). DEA is a big data platform that supports the exploitation of EOS and other geospatial data to provide insights into Australia’s changing land, coasts and oceans. Prior to June 2016, DEA was known as the Australian Geoscience Data Cube (AGDC) a partnership between Geoscience Australia (GA), the Australian Commonwealth Scientific and Industrial Research Organisation (CSIRO) and Australia’s National Computational Infrastructure (NCI) and the winner of the 2016 Content Platform of the Year at the Geospatial World Leadership Awards (Lewis et al., Citation2016, 2017).
There are a growing number of examples of DEA being used to create information products and insights into issues ranging from the presence of observable surface water (Mueller et al., Citation2016) through to estimates of water quality (Lymburner et al., Citation2016). However, the majority of the published examples to date only exploit data from the Landsat series of satellites. This paper demonstrates the power of DEA and extends the concepts outlined in Lewis et al. (Citation2017). In particular, it outlines how the analysis capabilities of the DEA can be used to draw together and effectively “link” data from multiple domains to provide rich insights into the state of the Australian environment.
2. Methodology
2.1. Analysis ready data
The DEA provides both the analytical tools and the high-performance computing (HPC) infrastructure needed to facilitate analysis of multi-decadal continental time series data. The underpinning concept is the provision of Analysis Ready Data (ARD) in a central HPC system where users can remotely access everything they need rather than having to download very large data volumes to perform analyses locally. The international Committee on Earth Observation Satellites (Citation2016) defines ARD for land as
… satellite data that have been processed to a minimum set of requirements and organized into a form that allows immediate analysis with a minimum of additional user effort and interoperability both through time and with other datasets.
The advantage of ARD is that all data is pre-computed to a high correction standard so that the low level pre-processing and data corrections that were traditionally conducted by users before they could start to analyse data are no longer a barrier to the exploitation of EOS data. To enable efficient time series analyses, the data has been stored in a grid structure independent of the traditional EOS data storage structures. For example the Landsat data contained within DEA is stored in 100 by 100 km grid cells at 25 m spatial resolution in an Albers Equal Area projection. The advantage of this structure is that it provides a data-agnostic approach to storage and analysis. Where different data at different spatial resolutions and projections are required to be combined into analyses, reprojection and resampling are conducted “on the fly” so an end user does not need to conduct processing steps that bring all data into common formats before beginning their scientific investigations.
2.2. Approach to continental scale, multi-domain analyses
The broader concept behind DEA is that EOS data is one continuous source of observations of the Earth, and that to properly understand biophysical phenomena requires simultaneous analysis of data in both spatial and temporal terms using more than just simple image differences or small study areas. This opens users to the application of analysis techniques from other fields such as high-dimensional statistical analysis (Roberts, McIntyre, & Mueller, Citation2017) and deep learning techniques, and supports the examination of the dynamic behaviour of the Earth’s surface through time.
The DEA platform provides a number of simple querying and spatial analysis tools that support the combination of data from multiple sources into analyses that describe biophysical phenomena. Some analyses have combined EOS data with rainfall grids, river gauge information or tidal data, to create continental scale products that were previously unable to be computed. For example, the observations from the Australian Landsat archive have been associated with modelled tidal data from the Oregon State University tidal model (Egbert & Erofeeva, Citation2002) to arrange the satellite observations into tide-based clusters that then describe the intertidal zone of the Australian coast (Sagar, Roberts, Bala, & Lymburner, Citation2017). Similarly, placing the archive into the context of a tidal model also enables the generation of cloud free composites of imagery acquired at high tide or low tide.
In general terms, this approach can be considered as switching an analysis away from the classic temporal domain, as in a traditional time-series analysis, to an alternate biophysical domain. In essence, this approach allows for data-sets to be analysed without being constrained by the natural flow of time.
For example, by combining stream gauge data with an EO archive it is possible for a user to quickly organise imagery according to in-stream hydrological extremes and provide rapid estimates that relate streamflow to inundation extent. Similarly, examining the archive in the context of gridded rainfall data provides the ability to generate continental scale, cloud-free composites for periods of severe drought. Likewise, placing the archive into the context of a tidal model enables the generation of cloud free composites of imagery acquired at high tide or low tide. These examples are elaborated in detail in the following section.
The examples outlined in this paper are all based on the DEA Landsat ARD collection. This collection consists of surface reflectance measurements from the Landsat 5, 7 and 8 sensors covering the period of 1987–2016.
3. Applications of digital earth Australia
3.1. Understanding flooding regimes of Australia’s rivers
Little is known about the flooding characteristics of many of Australia’s catchments, particularly in the remote parts of northern and central Australia, due to the challenges associated with the modelling of large and complex floodplains. Understanding the temporal and spatial characteristics of these water resources is crucial for supporting a wide range of future development activities including both agriculture and resource extraction (e.g. Australian Government, Citation2015).
Two of the key information sources for understanding water resources in Australia are the Australian Hydrologic Reference Station (HRS) stream gauge network (Bureau of Meteorolgy, Citation2017) and Water Observations from Space (Mueller et al., Citation2016). The HRS is a well-maintained stream gauging network managed by Commonwealth, State, and Territory water agencies. The data-set is compiled and hosted by the Australian Bureau of Meteorology and includes 222 stream gauges that:
are within unregulated catchments with minimal land use change;
hold high-quality streamflow data covering at least 30 years, with little missing data; and
are distributed throughout spatially representative areas within all the hydro-climate regions across Australia.
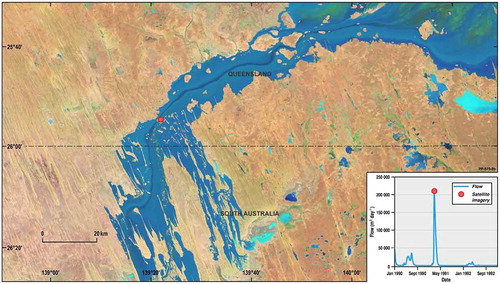
While both of these datasets are valuable in and of themselves, the DEA has allowed them to be linked to provide a richer and more useful initial characterisation of surface water distribution at hydrological extremes (flood and drought). To demonstrate the concept, hydrographs from a stream gauge in Diamantina River at Birdsville in south central Queensland were linked to Landsat satellite images, allowing the visualisation of imagery corresponding to streamflow events of interest. shows the extent of inundation as a false colour image acquired at the peak of the Diamantina River hydrograph. This provides a visual, qualitative understanding of where water goes during flood events.
Figure 1. Linked Landsat imagery for a flooding event observed at the Diamantina River stream gauge on 26 February 1991.
Notes: The inset shows the stream gauge data with the red dot signifying the time of the Landsat image that is shown in the main section of the figure. The red dot on the main section of the image shows the location of the stream gauge.
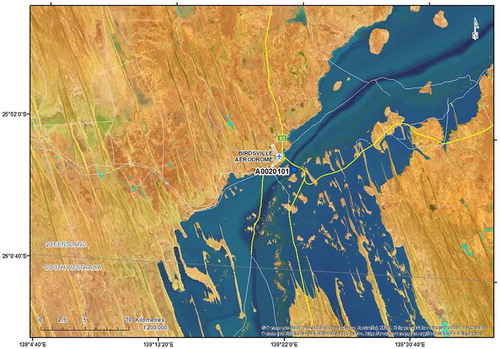
One of the most important uses of this information is to support emergency managers during future flood events in regions where there is no quantitative flood modelling available. This is particularly important in remote regions where major flooding events have the potential to reduce or eliminate road access for extended periods. shows the same peak flood event from in the context of local road infrastructure and provides an immediate, albeit approximate, understanding of potential future impacts of similar flood events.
Figure 2. Identification of current day transport infrastructure located near or in the extent of inundation observed during the flooding event observed on 26 February 1991.
Note: The Diamantina River stream gauge is shown on this image as the blue dot labelled A0020101.
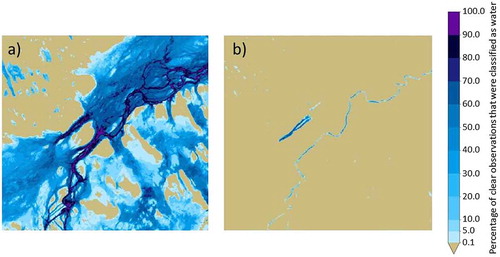
DEA also allows us to progress from this to more quantitative analyses of similar flood events that summarise observed inundation associated with peak flow events as well as the distribution of residual pools during periods of extreme drought. (a) summarises the distribution of water for all flood events observed over three decades of available Landsat data. (b) highlights residual pools within that portion of the river system during the droughts that occurred over the same period of time.
Figure 3. Demonstration of the use of water classified imagery from WOfS summarised over (a) periods of flooding and (b) periods of drought.
3.2. Identifying potential sources of groundwater in Northern Australia
Australia is the driest inhabited continent on Earth (Pigram, Citation2007). The management of water resources is vitally important and EOS data provide the only practical way of capturing water information at continental scales (Thomas, Kingsford, Lu, & Hunter, Citation2011). Using EOS is especially important for developing northern Australia, where relevant physical quantities (such as bores, streams and rainfall) are sparsely gauged (Petheram, McMahon, & Peel, Citation2008).
Australia’s scarce water resources can be better understood by reorganising EOS data on the basis of available climatological data. This approach is supporting the ongoing characterisation of potential groundwater discharge areas in Northern Australia.
Bureau of Meteorology (BoM) rainfall grids (Jones, Wang, & Fawcett, Citation2009) were used to find the hydrological extremes of wet and dry years in the satellite record. The driest years in rainfall based on an October–September hydrological year were used to generate polygons of areas that share a common driest year. The dry year polygons were used to define areas that share common rainfall characteristics. The same approach was used to identify the wettest year polygons.
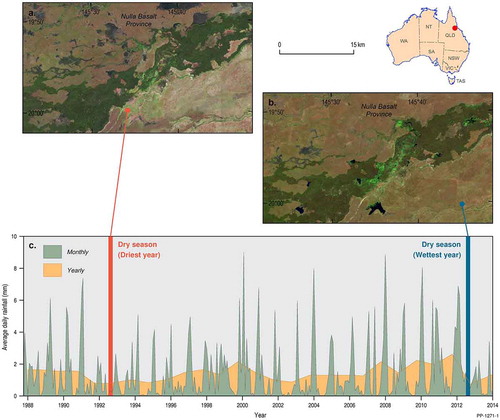
Based on these polygons, average yearly rainfall was calculated. The driest and wettest years in rainfall were selected for each polygon based on the 1987–2013 record. The geometric median or “geomedian” method of Roberts et al. (Citation2017) was used to create cloud-free dry season composite mosaic images (July–November) for the wettest and driest hydrological years. The dry season months for the wettest and driest hydrological years were used to produce the wet-and dry-year composite images to avoid wet-season flooding in the composite and to capture more cloud-free observations, a significant challenge in the wet season in this region.
Comparison of these wet-and dry-year composites () shows differences in the persistence of water between the wettest and driest years for the area, with persistent water indicating possible areas of groundwater discharge or groundwater-dependent ecosystems.
Figure 4. Wet- and dry-year composites for the Nulla Basalt in the Upper Burdekin area of Queensland, Australia, and corresponding rainfall showing the dry seasons of the wettest and driest years in the record used to produce the composite images.
4. Discussion and conclusion
DEA is providing a new tool to exploit EOS in both the spatial and temporal domains. It has opened the analysis of the environment to techniques not traditionally associated with earth observation analysis and is providing invaluable insights into Australia’s water resources by allowing for the combination and joint analysis of large scale EOS and other biophysical data. Prior to technologies such as DEA, such multi-domain analyses were extremely challenging and impractical at continental scale. The combination of high-performance computing co-located with structured high-performance data infrastructure is unlocking the value of these data.
The analyses described above all follow a fairly simple pattern of connecting EOS data with other modelled or observed parameters and then reordering the EOS data to extract features of interest. While even these simple analyses have proven to be incredibly useful, they are only scratching the surface of what can be done when the available data is organised and made available for analysis. For example, DEA envisages combining a range of datasets from EOS, on-ground observations and official agricultural statistics to provide Australia with new tools for forecasting rangeland productivity.
There is also incredible potential for more sophisticated analysis using a range of machine learning and statistical analysis techniques to unlock vastly more value from this data and this will be a focus for future work. For example, the use of rainfall and EOS data for identifying groundwater resources could be significantly improved if we were to use advanced analytic techniques to effectively deconvolve greenness associated with climatic events as opposed to groundwater availability. Similarly, DEA aspires to crop yield forecasting tools that exploit machine learning approaches applied to historical rainfall and yield data.
Ultimately, the analysis platforms such as DEA that provide simple access to a wide range of continental scale, analysis ready data have the potential to transform our understanding of the environment.
Disclosure statement
No potential conflict of interest was reported by the authors.
Data availability statement
Raw data were generated at the Australian National Computational Infrastructure large-scale facility. Derived data supporting the findings of this study are available from the corresponding author on request.
Notes
This paper is published with the permission of the CEO, Geoscience Australia.
References
- Australian Academy of Science. (2009). An Australian strategic plan for earth observations from space [online]. Canberra: Author. Retrieved November 1, 2017 from, https://www.science.org.au/files/userfiles/support/reports-and-plans/2015/earth-observations-from-space.pdf
- Australian Government. (2015). Our north, our future: White paper on developing northern Australia [online]. Retrieved November 1, 2017 from, http://northernaustralia.gov.au/sites/prod.office-northern-australia.gov.au/files/files/NAWP-FullReport.pdf
- Baumann, P., Mazzetti, P., Ungar, J., Barbera, R., Barboni, D., Beccati, A., … Wagner, S. (2016). Big data analytics for earth sciences: The earthserver approach. International Journal of the Digital Earth, 9, 3–29. doi:10.1080/17538947.2014.1003106
- Bureau of Meteorolgy. (2017). Hydrologic reference stations, dataset version October 2015 [online]. Retrieved November 1, 2017 from, http://www.bom.gov.au/water/hrs/
- Committee on Earth Observation Satellites. (2016). CEOS analysis ready data for land (CARD4L) description document [online]. Retrieved from http://ceos.org/document_management/Meetings/Plenary/30/Documents/5.5_CEOS-CARD4L-Description_v.22.docx
- Egbert, G. D., & Erofeeva, S. Y. (2002). Efficient inverse modeling of barotropic ocean tides. Journal of Atmospheric and Oceanic Technology, 19, 183–204. doi:10.1175/1520-0426(2002)019<0183:EIMOBO>2.0.CO;2
- Gorelick, N., Hancher, M., Dixon, M., Ilyushchenko, S., Thau, D., & Moore, R. (2017). Google earth engine: Planetary-scale geospatial analysis for everyone. Remote Sensing of Environment, In-press,. doi:10.1016/j.rse.2017.06.031
- Griggs, D., Stafford-Smith, M., Gaffney, O., Rockström, J., Öhman, M. C., Shyamsundar, P., … Noble, I. (2013). Policy: Sustainable development goals for people and planet. Nature, 495, 305–307. doi:10.1038/495305a
- Jones, D., Wang, W., & Fawcett, R. (2009). High-quality spatial climate data-sets for Australia. Australian Meteorological and Oceanographic Journal, 58, 233–248.10.22499/2.00000
- Joyce, B., & Nash, F. (2017). Regional Australia – Driving our economy 2017–18 [online]. Australian Government, Department of Infrastructure and Regional Development. Retrieved November 1, 2017 from https://infrastructure.gov.au/department/statements/2017_2018/ministerial-statement/2017-18-Regional-Ministerial-Budget-Statement.pdf
- Lewis, A., Oliver, S., Lymburner, L., Evans, B., Wyborn, L., Mueller, N., … Wang, L.-W. (2017). The Australian geoscience data cube – Foundations and lessons learned. Remote Sensing of Environment, p. S0034425717301086). In Press. https://doi.org/10.1016/j.rse.2017.03.015
- Lewis, A., Lymburner, L., Purss, M. B. J., Brooke, B., Evans, B., Ip, A., … Wyborn, L. (2016). Rapid, high-resolution detection of environmental change over continental scales from satellite data – the Earth Observation Data Cube. International Journal of Digital Earth, 9(1), 106–111. doi:10.1080/17538947.2015.1111952
- Li, F., Jupp, D. L., Reddy, S., Lymburner, L., Mueller, N., Tan, P., & Islam, A. (2010). An evaluation of the use of atmospheric and BRDF correction to standardize landsat data. IEEE Journal of Selected Topics in Applied Earth Observations and Remote Sensing, 3(3), 257–270. doi:10.1109/JSTARS.2010.2042281
- Li, F., Jupp, D. L. B., Thankappan, M., Lymburner, L., Mueller, N., Lewis, A., & Held, A. (2012). A physics-based atmospheric and BRDF correction for Landsat data over mountainous terrain. Remote Sensing of Environment, 124, 756–770. doi:10.1016/j.rse.2012.06.018
- Lymburner, L., Botha, E., Hestir, E., Anstee, J., Sagar, S., Dekker, A., & Malthus, T. (2016). Landsat 8: Providing continuity and increased precision for measuring multi-decadal time series of total suspended matter. Remote Sensing of Environment, 185, 108–118. doi:10.1016/j.rse.2016.04.011
- Mueller, N., Lewis, A., Roberts, D., Ring, S., Melrose, R., Sixsmith, J., … Ip, A. (2016). Water observations from space: Mapping surface water from 25 years of Landsat imagery across Australia. Remote Sensing of Environment, 174, 341–352. doi:10.1016/j.rse.2015.11.003
- Overpeck, J., Meehl, G. A., Bony, S., & Easterling, D. R. (2011). Climate data challenges in the 21st century. Science, 331, 700–702. doi:10.1126/science.1197869
- Petheram, C., McMahon, T. A., & Peel, M. C. (2008). Flow characteristics of rivers in northern Australia: Implications for development. Journal of Hydrology, 357(1–2), 93–111.10.1016/j.jhydrol.2008.05.008
- Pigram, J. (2007). Australia’s water resources: From use to management. Collingwood, Victoria: CSIRO Publishing.
- Roberts, D., McIntyre, A., & Mueller, N. (2017). High-dimensional pixel composites from earth observation time series. IEEE Transactions on Geoscience and Remote Sensing, 55(11), 6254–6264. doi:10.1109/TGRS.2017.2723896
- Sagar, S., Roberts, D., Bala, B., & Lymburner, L. (2017). Extracting the intertidal extent and topography of the Australian coastline from a 28 year time series of Landsat observations. Remote Sensing of Environment, 195, 153–169. doi:10.1016/j.rse.2017.04.009
- Sinergise. (2017). Sentinel playground [online]. Retrieved November 1, 2017 from, http://apps.sentinel-hub.com/sentinel-playground
- Thomas, R. F., Kingsford, R. T., Lu, Y., & Hunter, S. J. (2011). Landsat mapping of annual inundation (1979–2006) of the Macquarie Marshes in semi-arid Australia. International Journal of Remote Sensing, 32(16), 4545–4569.10.1080/01431161.2010.489064
- UN General Assembly. (2015). Transforming our world: The 2030 Agenda for Sustainable Development. Retrieved November 1, 2017 from, http://www.refworld.org/docid/57b6e3e44.html