
 ?Mathematical formulae have been encoded as MathML and are displayed in this HTML version using MathJax in order to improve their display. Uncheck the box to turn MathJax off. This feature requires Javascript. Click on a formula to zoom.
Abstract
Big Earth Data-Cube infrastructures are becoming more and more popular to provide Analysis Ready Data, especially for managing satellite time series. These infrastructures build on the concept of multidimensional data model (data hypercube) and are complex systems engaging different disciplines and expertise. For this reason, their interoperability capacity has become a challenge in the Global Change and Earth System science domains. To address this challenge, there is a pressing need in the community to reach a widely agreed definition of Data-Cube infrastructures and their key features. In this respect, a discussion has started recently about the definition of the possible facets characterizing a Data-Cube in the Earth Observation domain. This manuscript contributes to such debate by introducing a view-based model of Earth Data-Cube systems to design its infrastructural architecture and content schemas, with the final goal of enabling and facilitating interoperability. It introduces six modeling views, each of them is described according to: its main concerns, principal stakeholders, and possible patterns to be used. The manuscript considers the Business Intelligence experience with Data Warehouse and multidimensional “cubes” along with the more recent and analogous development in the Earth Observation domain, and puts forward a set of interoperability recommendations based on the modeling views.
1. Introduction
Data-Cube cyber-infrastructures have gained a great deal of attention recently in the Satellite Imagery management domain. They are understood as software infrastructures that allow the ingestion, storage, access, analysis, and use of data elements inherently ordered according to shared attributes, one of which has to be their geospatial location (Strobl et al., Citation2017).
Many space agencies are considering Data-Cube technology as a promising instrument to perform time-series analysis of large satellite data-set like Landsat and Sentinel.
Data-Cube concepts and technologies have developed in domains other than Satellite imagery. In particular, data cubes (aka data hyper-cubes) have been introduced in the Business Intelligence domain in the 1990s, as a dimensional model approach to implement the Data Mart and Dashboard concepts and develop Data Warehouse architectures. In such a context, a Data-Cube infrastructure commonly refers to a cyber-system that manages at least a cube of data. In the Business Intelligence domain, the term cube is utilized as a shortcut for multidimensional data-set – i.e. a multidimensional generalization of a two- or three-dimensional spreadsheet, or table of facts. In principle, the managed data-set can have an arbitrary number of dimensions and, in particular, greater than three. Thus, the correct term would be hyper-cube as a generalization of cube. In the database engineering and computer science disciplines, another term related to data cube is commonly utilized: the OLAP (Online Analytical Processing) cube. This refers to a multidimensional array of data (Gray, Bosworth, Layman, & Pirahesh, Citation1996) ready to be analytically processed online (Dubler & Wilcox, Citation2002) using a well-defined computer-based technique to analyze data and look for insights.
More generally, (big) data analytics has its root in business analytics or business intelligence models. OLAP is the main concept behind many Business Intelligence services making use of data hyper-cubes utilized for data discovery, reporting, what-if analysis, budgeting, forecasting, planning etc. To facilitate analytical tasks, with a data hyper-cube, OLAP common operations include: slice and dice, drill down, roll up, and pivot (Vassiliadis, Citation1998).
The Business Intelligence experience is important to realize that Data-Cube (and more generally multidimensional data modeling) is not only about data schema design but includes many other important aspects (Adamson, Citation2017), such as:
Capturing business requirements (information needs by business function).
Managing scope (definition and prioritization of data management projects).
Designing data marts (structure data for query and analysis).
Presenting information (a business view of managed data assets).
Providing a rich user experience (exposing the most effective APIs (Application Program interfaces) to allow Users generate, access, and manipulate necessary information).
1.1. Existing data-cube infrastructures in the earth observation domain
Multidimensional array data structures have long been used by Earth observation (and in particular Remote Sensing) experts. However, only recently with the advent of Cloud and Big data technologies, Data-Cube (i.e. data hypercube) infrastructures have been recognized as an effective instrument to manage and share Earth Observation (EO) resources and services – in particular analytical ones. Well-known examples of Data-Cube infrastructure implementations to achieve Earth system science applications include:
The Open Data Cube (ODC) initiative,Footnote1 managed by CEOS, has released an open source toolkit to develop Data-Cube infrastructures and provide Analysis Ready Data (ARD). There are already three valuable examples of existing infrastructures based on such a technological framework: the Australian, Colombian, and Swiss national Data-Cube infrastructures (Ariza-Porras et al., Citation2017; Giuliani et al., Citation2017; Lewis et al., Citation2017). CEOS vision is that more than 20 countries will be implementing their own Data-Cube infrastructure by 2022 (Killough, Citation2017). According to ODC a Data-Cube may be defined as a time series multidimensional (space, time, data type) stack of spatially aligned pixel ready for analysis.
In the last five years, the European Commission has funded a project called EarthServerFootnote2 that aims at implementing Data-Cube services for EO (Baumann et al., Citation2016). Such a framework is built around an array DB technology called RASDAMAN.Footnote3 Another array DB, called SciDB,Footnote4 enables a more recent Data-Cube infrastructure developed by the Brasilian INPE (Camara et al., Citation2017) for using satellite image time series to produce land use and land cover classification over large areas in Brazil (Picoli et al., Citation2017). In the next future, more Data-Cube solutions and infrastructures are expected to be experimented and developed.
Finally, the DG Joint Research Centre (JRC) of the European Commission has recently developed a Data-Cube infrastructure based on the JRC Earth Observation Data and Processing Platform (JEODPP)Footnote5 to integrate and analyze the combination of satellite and in situ EO for the generation of a set of indicators relevant for the SDG (Sustainable Development Goals) 2030 Agenda (Soille, Burger, Rodriguez, Syrris, & Vasilev, Citation2017).
1.2. Opportunities and challenges for the digital earth domain
For the Digital Earth realm, it is possible to recognize a set of promising opportunities but also specific challenges stemming from the introduction of Data-Cube solutions.
1.2.1. Integration into the society and economy
The main opportunities seem to be related to the role that Data-Cube infrastructures can play in addressing important challenges characterizing Big Data management – e.g. Volume, Variety, Velocity, and Visualization. To this end, the Big Earth Data community should leverage the rich legacy (on Data-Cube) of Business Intelligence and re-use existing and mature technologies, models, and solutions – avoiding to waste time and resources. In doing so, the Earth Data sector can enter a new and large business domain whose customers are not its traditional ones. This contributes to the evolution of the Earth Data sector (and in particular the space one) into a new era. In Europe, this evolution of space “out of the space sector” is seen as necessary to achieve the objectives of the Digital Single Market (DSM) (European Commission, Citation2015). In particular, the Space Strategy for Europe (European Commission, Citation2016) calls for the space sector to contribute more to the DSM, and connect better to other policies and economic areas to do so. Space agencies themselves recognize the need to change in the face of the evolving landscape: For example, ESA (European Space Agency) recently launched its Space 4.0 strategy: i.e. a time when space is evolving from being the preserve of the governments of a few spacefaring nations to a situation in which there is the increased number of diverse space actors around the world, including the emergence of private companies, participation with academia, industry and citizens, digitalization and global interaction (European Space Agency, Citation2016).
Big (Earth) data analytics can play an important role for being part of the Web 3.0 (i.e. Data Web) revolution but a major challenge is how to extract information from the deluge of data collected and generated every day, especially in the EO domain. In this context, data warehouse and OLAP (i.e. Data-Cubes) became extremely valuable in extracting and organizing information from Big Data. Enriched by machine learning and artificial intelligence procedures, Big Earth Data-Cubes infrastructures can contribute to the current trend of automation and data exchange in manufacturing technologies – see Internet of Things (IoT) and Industry 4.0 revolutions.Footnote6
1.2.2. Toward the foundation of an effective interoperability framework
Cross-organizational and cross-domain applications dealing with Global Change and the SDG 2030 agenda need to be supported by a diverse set of global and macro-regional Data-Cube ecosystems. We clearly see this in the context of GEOSS (the Global Earth Observation System of Systems)Footnote7 platform being developed under the aegis of GEO (the Group on Earth Observation).Footnote8 In particular, the GEOSS EVOLVEFootnote9 initiative which is responsible for designing the GEOSS evolution toward a software ecosystem has recognized the need for an effective interoperability framework among the existing (and future) Data-Cube infrastructures. These should go beyond the exchange of data-sets and implement conceptual composition and analytical orchestration, as well as establishing a set of well-defined, general, and effective APIs to access and use Earth Data-Cubes services.
It is possible to envisage several Data-Cube interoperability challenges; however, in our opinion, most of them can be recognized and mitigated by introducing a comprehensive, harmonized, and conceptual model of Data-Cube infrastructures – going beyond the present situation characterized by a substantial lack of an agreed meaning and description of such a complex system (Strobl et al., Citation2017). The use of the Data-Cube term (and its related concepts) often depends on the sector that has contributed to the realization of a cube infrastructure – they include: data analysis, database engineering, business intelligence procedures, multidimensional analysis algorithms, satellite time series analysis, etc. (Strobl et al., Citation2017).
As to the domains related to data modeling and structure design, for example, in the satellite imagery realm, Data-Cube is commonly defined as a spatio-temporal dimensional array of values commonly used to describe a time series of image data (Killough, Citation2017). However, as already mentioned, the term “cube” is a shortening for “hyper-cube” (i.e. a multidimensional concept from geometry) because any valuable N-dimensional data-set should be managed – not only those characterized by a spatial dimensional domain, i.e. 2–3D. Data cubes have been commonly used to implement Data Marts – as alternatives to star, snowflakes, and columnar schemas. Therefore, a Data-Cube may be also defined as a multidimensional data modeling solution to implement a problem-specific data store, designed to hold information for reporting/analysis/insight around a specific organizational function, and contains a subset of data from a data warehouse (Quora, Citation2011). Such a definition, commonly used in the Business Intelligence domain, outlines the role played by Data-Cube on structuring and subsetting a Data Mart for satisfying the specific query and analysis needs posed by a given business process (Stackoverflow, Citation2011).
More characterizations and definitions come from the cyberinfrastructure aspects necessary to develop a Data-Cube and, in particular, its computational and interoperability aspects – inevitably characterized today by the diverse possible Web-enabled solutions.
Based on the lessons learned by implementing and operating existing Big Earth Data-Cubes (Section 1.1), a set of Data-Cube characteristics (as well as challenges) have been recognized to lay the foundation for a well-agreed definition (Strobl et al., Citation2017). They were called the six “faces” of the cube:
The Parameter Model face;
The Data Representation model face;
The Data Organization model face;
The Access and Analysis Operation face;
The Infrastructure face;
The Interoperability face.
2. Big data, multidimensional data-sets, and data-cubes
2.1. Multidimensionality challenges for big data
In 2001, a well-known definition of Big Data built on three management challenges, exemplified by three Vs: Volume, Velocity and Variety (Laney, Citation2001). Later, other challenges have been recognized as relevant in the Big Data arena; in keeping with the successful V notation, they were called: Veracity, Value, and Visualization. Although rather old, this definition is still effective and useful, especially for EO data (Nativi et al., Citation2015). In the case of high multidimensionality of data, most of these Big Data challenges are even more complex to address. Volume and Velocity challenges are influenced because highly multidimensional data are inherently more complex to handle; while, Variety is relevant as different data-sets to be combined can be defined on diverse dimensions.
2.2. Hyper-cube representation of data-sets
We can interpret a data-set as the representation of a function f from a domain D to a codomain C:
The domain is the set of values of the independent variables for which the function is defined (and therefore for which the data-set provides a value in the codomain). The codomain is the set of values into which all of the output of the function is constrained to fall.
For example, in the geospatial information domain, ISO TC211 defined a coverage element (i.e. the representation of a space/time-varying phenomena) as a function mapping from space and time (i.e. the coverage domain) to a set of parameters of interest (i.e. the coverage codomain) (ISO TC211, Citation2005).
Both domain and codomain may be multidimensional with values in a proper set (e.g. integer, real, complex numbers).
where the symbol “x” represents the Cartesian product, creating ordered pairs.
For example, let us consider a multidimensional data-set collecting values measured by different instruments at different times. Each instrument is characterized by an index (i) that belongs to a set of possible values (I), which is a subset of the natural number set (ℕ). The notation is: i ∊ I ⊂ ℕ. According to such notation, measurements occur at multiple times t ∊ T ⊂ ℝ. All the instruments measure the following parameters: pressure (indexed as p ∊ P ⊂ ℝ where ℝ is the real number set) and wind velocity (indexed as v ∊ V ⊂ ℝ). The data-set would be represented as:
This means that each instrument-time ordered pair (i, t) ∊ I × T corresponds to a pressure–velocity ordered pair (p, v) ∊ P × V.
This general interpretation of data-set matches the Data-Cube concept, where an hypercube can be represented as a functional f mapping from a N dimensions (domain) to M values (co-domain), for each hypercube voxel.
The choice of the domain and codomain variables (or parameters) depends on what the data-set aims to model. The co-domain includes the parameters (or facts) of interest, while the domain includes those variables that the facts depend on. In the previous example, the facts of interest are pressure and wind velocity depending, in this case, on instrument and time variables. It is essential to note that the same set of values can be represented in different ways, moving parameters from the domain to the co-domain.
In the example above, it is possible to move all the variables to the co-domain. Assuming we have n instrument-time pairs (i.e. samples), we can associate a four-uple of pressure–velocity-instrument-time to each sample (i.e. measurement), which is represented as an integer number defined in the ordered set of integers [1, n] ⊂ ℕ. The new hypercube can be represented by the new functional f′
The Multipoint representation of coverages adopts this approach, with [1, n] as the set of point indices representing the domain, and space/time values provided as part of the co-domain attributes.
On the contrary, generally, it is not possible to move parameters from the co-domain to the domain. This depends on the fact that f is a function, i.e. an application assigning a unique value in the co-domain for each value in the domain. In general, it is possible to move parameters from the co-domain to the domain only if the relationship between those parameters and the current domain is bijective.
In the previous example, it is not generally true that we can write instrument and time as depending on pressure and wind velocity. Hence, we cannot move pressure and velocity to the domain:
2.3. The coverage data model and data-cube dimension neutrality
Traditionally, the geospatial information domain has considered environmental parameters as depending on space and time, in agreement with ISO TC 211 definition of coverage geometries (ISO TC211, Citation2005) to represent space/time-varying phenomena. However, Big Data analytics and the recent digital transformation revolution demand new (processing) capabilities to the Digital Earth that go beyond the traditional coverage model. In particular, the environmental parameters of interest may depend on variables (dimensions) other than space and time. As in the previous example, measurements may depend on the instrument, or, in the case of simulations, on a set of model parameters. For instance, a data-set may contain simulated values of precipitation depending not only on space and time (i.e. as a traditional coverage) but also on the values characterizing a set of simulation parameters – e.g. model driving parameters.
The Data-Cube concept refers more to the data-set usage scenarios rather than to its conceptual modeling. For example, in the case of applications dealing with change detection, a satellite time series (i.e. a set of satellite images acquired at different times) can be considered as a functional (i.e. a data-set, as previously defined) mapping from a space and time domain to a co-domain consisting of one or more parameters, e.g. multi-band brightness temperatures – represented as vector Q:
However, from a computational point of view, it is evident that slicing along the space dimensions (i.e. extracting time-series for a given point or area in space) is much more demanding than slicing along the time dimension i.e. extracting a linear profile at fixed time. The data-set encoding, although conceptually representing a hypercube, does not facilitate the usage scenario, breaking an important Data-Cube requirement.
What should characterize Data-Cube is the dimension neutrality: it means that the complexity of a specific processing request (e.g. a query) on a subdomain does not depend on the dimensions involved in the request. Data-Cubes should expose the data-set in a way that assure dimension neutrality. For the previous example, the multipoint functional representation f′: [1, n] P × V × I × T seems to assure (in principle) the dimension neutrality by handling all the parameters in the same way.
2.4. Optimization issues
To achieve such neutrality, recently, NoSQL (Not Only SQL) technologies have been used (e.g. using a large bi-dimensional table) providing an alternative to the more popular array and relation DB instruments. However, these techniques must face optimization issues, as the relationship between domain and co-domain is lost – for example, a heavy pre-processing and indexing task is required to speed up queries.
In any case, a careful selection of the dimensions to be optimized (by pre-processing or by moving them to the data-set domain) is necessary in order to support the many different use-cases that are becoming of great importance for Digital Earth. A valuable example is represented by the generation of iso-surfaces and slices (based on a set of parameter values in addition to space and time) to enable 3-D and 4-D Big Earth Data Visualization. Data-Cube solutions for the Digital Earth should provide fast execution of such queries, requiring dimension neutrality.
3. A data-cube model for enabling interoperability
For a comprehensive and harmonized modeling of Data-Cube in the Big Earth Data domain, it is important to introduce few essential principles that must characterize Data-Cube infrastructures – with a focus on their interoperability:
Data-Cube is a digital system to manage data hyper-cubes and allow data analytics; | |||||
Data-Cube is able to manage N-dimensional hyper-cubes (i.e. cubes of N-dimensional data), assuring dimension neutrality;
| |||||
| (3) | Data-Cube system must be accessible and interoperable at the programmatic level from the external world; | ||||
| (4) | Data-Cube, as any other cybernetic system must have a governance mechanism. | ||||
3.1. The separation of concerns pattern and viewpoints modeling
Software engineering manages the complexity characterizing multifaceted systems like Data-Cubes by applying a pattern called “separation of concerns” – a break down and manage strategy that is often argued to be the most important pattern for software engineering (Laplante, Citation2007). According to this design pattern, Data-Cube systems must be separated into distinct sections, such that each section addresses a separate concern. In this case, a concern is a set of requirements and constraints that affect the system design and represent a stakeholder needs. By applying the separation of concerns pattern, Data-Cubes can be represented in a way that is manageable and comprehensible by a range of different business and technical stakeholders. The benefits are multiple including: maintainability, extensibility, interoperability.
Viewpoints modeling (ISO, IEC 10746-1, Citation1998; ISO, IEC, IEEE 42010, Citation2011) is commonly used to capture and formalize the diverse business and technology “concerns” characterizing the different system stakeholders. For Data-Cubes, a viewpoint is a collection of challenges, possible design specifications, templates, and conventions for constructing one type of view. Therefore, a view is the representation of specific structural aspects of a Data-Cube that illustrate how the system addresses the concerns of a certain category of its stakeholders.
Recognizing different viewpoints and formalizing the related views helps defining complex systems like Data-Cube infrastructures and contribute to their conceptual harmonization and interoperability. An effective system design modeling recognizes a set of orthogonal views (i.e. independent from each other) collectively representing the whole system.
3.2. The interoperability views
With the ultimate goal of enabling and facilitating interoperability and, in keeping with the facets concepts introduced by Strobl et al. (Citation2017), diverse interoperability viewpoints can be recognized for designing and implementing the architecture of a Big Earth Data-Cube system, as showed by . The first three views cope with Data-Cube content (i.e. the multidimensional hyper-cube), while the other ones deal with Data-Cube cyber-infrastructural characteristics.
Figure 1. Modeling a data-cube cyber-infrastructure using interoperability views.
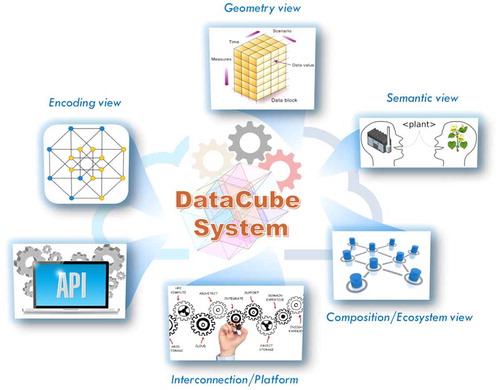
3.2.1. Content views
The Semantic view;
The Geometry view;
The Encoding view.
3.2.2. Cyber-infrastructure Views
The Interaction/Interface view;
The Interconnection/Platform view;
The Composition/Ecosystem view.
In the next section, each view will be described by defining its main concerns/challenges, engaged stakeholders, and providing possible patterns to be used for the design task.
3.3. The semantic view
In the Big Earth Data realm, Data-Cube infrastructure is commonly used to share one or more EO parameters, for example, physical products or indicators derived from observations, providing advanced analytical functionalities – such as spatial and temporal slicing and dicing. Semantically, parameters meaning can be quite complex and their use (i.e. fit-for-purpose) can be misunderstood – e.g. physical parameter index changes, atmospheric gas concentrations, sea temperature distribution, land use or classification distribution, population growth rates, etc. To allow a sound and effective (re-)usability and interoperability of cube parameters and indicators, geometric and encoding descriptions are not sufficient; semantic description of parameters/indicators is essential. Therefore, a parameter model must be formalized and shared, either on-line or off-line. This is closely related to the cube analytical purpose.
Needs and requirements asking for semantic description are provided by those domain experts who want to use Data-Cube infrastructures to discover, access, and utilize big multidimensional products and indicators to fit in their applications. They have the intention to build one or more business cases asking for data and information management – including analytical processing.
For such a view, existing specifications, good practices, and patterns mainly stem from a couple of IT sectors: data and information types classification, and ontology specification languages. A significant example of typing pattern is the CF (Climate and Forecast) convention standard names (CF Standard Names, Citation2017) commonly used for netCDF/HDF variables (Domenico & Nativi, Citation2013). Good examples of semantic specification languages are provided by W3C: the OWL Web Ontology Language (W3C, Citation2004a) and the general-purpose language for representing information in the Web, RDF (Resource Description Framework) (W3C, Citation2004b). The RDA (Research Data Alliance) issued a recommendation on Persistent Identifier Types (PIT) and Registry.Footnote10 Semantic view characteristics are summarized in .
Table 1. Semantic View main characteristics.
3.4. Geometry view
While the semantic view aims to capture the meaning of the hypercube content, the structural view deals with the geometry model structuring the content. Data representation is the way in which a cube parameter is discretized and structured along the different axes or dimensions of the cube – e.g. space, time, and other dimensional properties. Dimensions characterize “facts” that constitute the cube content – i.e. parameters. A given content (i.e. set of facts or parameters) might be represented in different ways and the same representation model and related schema might be used for different contents. For instance, if a parameter is represented as a coverage, it is essential to decide what are the coverage domain (i.e. cube dimensionalities) and its co-domain – i.e. the range of possible values. Depending on the representation type a specific set of metadata needs to be supplied including (for example) range, interval, scale, precision, or reference. To organize the variables of a Data-Cube we introduced the importance of the Dimension neutrality pattern. This view must apply such principle.
Needs and requirements dealing with this view come mainly from geospatial information and business domain experts. In addition, data hypercube experts should be engaged to provide valuable contributions for optimizing the analytical processing functionalities (depending on data structure), and the Dimension neutrality pattern.
ISO-TC211/OGC geometry models (e.g. feature and coverage ones) are important specifications developed in the geospatial information and geomatics areas (Domenico, Caron, Davis, Nativi, & Bigagli, Citation2006). More recently, some Common Data Models (CDM) have been introduced to classify and characterized structural representation of EO, including: netCDF CDM (Nativi, Caron, Domenico, & Bigagli, Citation2008), CF CDM,Footnote11 OGC SWE (Sensor Web Enabling) CDM (Robin, Citation2011) – they are also known as “feature types”. Finally, other more general multidimensional data modeling schemas can be used, like those introduced by business intelligence and online analytical processing – e.g. facts tables, star schemas, snowflakes schemas, and multi-cube. Geometry view characteristics are summarized in .
Table 2. Geometry View main characteristics.
3.5. Encoding view
Content values, structured according to a given geometry, must be encoded and physically stored in a way to optimize a set of desired functionalities e.g. content retrieving and analysis. Hypercube voxel values, generated by the discretization of cube content (i.e. parameters), need to be physically arranged and stored in a machine-readable way. This encompasses challenges like file formats and systems, database types and structures, etc.
File-based storage and exchange can be based on ASCII format (e.g. OGC GML,Footnote12 ECMA JSON,Footnote13 W3C RDFFootnote14 ), binary format (e.g. GeoTIFF,Footnote15 OGC netCDF,Footnote16 HDF,Footnote17 WMO GRIBFootnote18 ), or on a mix of both formats embedded in some bundle encoding (e.g. ISO/IEC Zip file format,Footnote19 OGC GeoPackageFootnote20 ).
Multidimensional DB storing data in multidimensional arrays are commonly used to optimize data warehousing and online analytical processing applications. They are able to support interactive analysis of large volumes of data (i.e. Big Data) for decision-making applications. Relational DB that have a two-dimensional (i.e. table-based) organization, can be used too. In this case, the need to implement complex joins of many tables can be mitigated by adopting dimensional modeling (Star schemes, Snowflake schemes, and Fact tables) data representation. More recently, for Big Data, column-oriented NoSQL database (e.g. Google BigTable and Hadoop) have been also utilized to store and retrieve multidimensional data. Data-Cubes managing Big Data are typically required to implement multidimensional data partitions (aka tiles) (Furtado, Citation1999).
The main stakeholders engaged in the definition and design of this view are Multidimensional data storage and exchange experts as well as online analytical processing experts, in particular for query optimizations. Encoding view characteristics are summarized in .
Table 3. Encoding View main characteristics.
3.6. Interaction/Interface view
Within a Data-Cube system, a number of software functionalities are implemented to discover, access, manipulate, and analyze the data stored in the hyper-cube. The external world (i.e. human users and other systems) mainly evaluate a Data-Cube system through the effectiveness of these functionalities. For this reason, they must be well documented and accessible to the external world via open APIs (e.g. JSON/REST) and (where necessary) interactive human interfaces, like notebooks applications and Web Portals.
Data-Cube functionalities largely depend on the hypercube representation of data-sets (see the geometry view) that, in turn, is bound to the business cases implemented by the stakeholders. Therefore, different Data-Cubes are likely to implement different APIs. However, a common set of basic functionalities may be recognized referring to the hyper-cube nature of all Data-Cube instances. This would greatly help interoperability. For example, the OLAP (Online Analytical Processing) operations (Slice, Dice, Drill Down/Up, Roll-up, and Pivot) are well-recognized and implemented by the so-called OLAP cubes (Bolt & van der Aalst, Citation2015; Thanisch, Niemi, Niinimaki, & Nummenmaa, Citation2011).
OLAP API implementations include technologies like: Apache Lens,Footnote21 MDX (Multidimensional Expressions),Footnote22 the RDF vocabulary for OLAP cube: QB4OLAP,Footnote23 OLAP Java APIs,Footnote24 Microsoft OLE DB for OLAP,Footnote25 Python OLAP.Footnote26
For Data-Cube applying the ISO coverage model (ISO TC211, Citation2005), the OGC WCPS (Web Coverage Processing Service) (Baumann, Citation2009) defines an analytics language for gridded data. OPeNDAP and Google Earth Engine have also adopted similar languages. The CEOS Data Cube Platform version 2 (CEOS2) released a set of APIsFootnote27 specification, while recently, a set of specific interfaces for (satellite) Time Series analysis were proposed in the OGC frameworkFootnote28 (e.g. Satellite Image Time SeriesFootnote29 and Web Time Series ServiceFootnote30 APIs).
As to notebook Web application, there are several tools available such as: JupyterFootnote31 and IPython.Footnote32
Interoperability (especially Web APIs based) and multidimensional data analytics experts should be engaged for designing and documenting this view. The Interaction/Interface view characteristics are summarized in .
Table 4. Interaction/interface view main characteristics.
3.7. Interconnection/Platform view
An actual Data-Cube system is enabled by a cyber-infrastructure, which empowers, connects, and orchestrates all the software components that are necessary to constitute a data hyper-cube along with its functionalities, the exposed APIs, and the necessary control mechanisms. This cybernetic platform provides all the data management, computational, and networking capabilities needed. For example, the platform must finalize user’s requests allowing for data handling and use.
Performance and scalability are important challenges for designing a Data-Cube digital platform. For this reason, important design criteria might be considered the optimization of a set of given performances – e.g. the rapid data access and transfer between storage and processing instances (Lewis et al., Citation2017). However, such optimization strategies and technological solutions should not prevent the possibility, for the cybernetic platform, to interoperate at different levels with other sibling platforms. Naturally, the Data-Cube APIs (see the Interface view), exposed by the platform, are the first interoperability point.
To push interoperability, the platform design is an important phase and should apply well-accepted software design patterns, such as: the separation of concerns, decentralization, transparencies, and re-usability.
To design this view, in addition to software system analyst and designers, the following stakeholders should be engaged for their competences: HPC experts (in particular middleware interoperability), System-of-Systems (SoS) architecture interoperability experts, software design pattern experts. The Platform view characteristics are summarized in .
Table 5. Interconnection/platform view main characteristics.
3.8. Composition/Ecosystem view
Data-Cube software platforms can implement operational interoperability with other sibling platforms and/or with some opportunistic or enabling software components realizing a sort of Software Ecosystem (SECO). This potential aspect is of particular interest for the Communities working on Global Changes and SDG agenda assessment.
For example, several instances of data cubes could be coupled to act as a bigger one, sharing storage and analysis capacities. On the other hand, a lack of Data-Cube systems interoperability will inevitably lead to silo effects undermining the multidisciplinary concept of data cubes and potentially hindering its use. Interoperability challenges across different “cubes” can be many. In particular, for Big Earth Data-Cubes, an important challenge deals with the use of a well-accepted solution for representing data defined on a spherical geometry domain – e.g. using a Discrete Global Grid System (DGGS) (OGC, Citation2014).
Any cybernetic platform interoperability is first addressed by exposing a set of open and standard APIs (see the Interface view). Secondly, it is important to recognize the type of architecture implemented by the platform system – e.g. fully centralized or distributed (see the Interconnection/Platform view).
Keeping its autonomy and scope, a Data-Cube infrastructure can decide to belong to a SoS. In such a case, it is important to recognize the kind of governance strategy adopted by the SoS – e.g. directed, collaborative, acknowledged, or virtual. While the directed governance style imply full central control, and the virtual one a free interaction among autonomous entities, the acknowledged and collaboration styles seem to be the most promising ones for interoperability.
For the Composition/Ecosystem view design, important stakeholders are: SECO and SoS experts, international standards experts.
For the Data-Cube implementing the coverage model, useful standards are the OGC Coverage Implementation Schema (CIS) and Web Coverage Service (WCS). OLAP and Multidimensional Model schemas are well-accepted by the Community of Business Intelligence. The Committee on Earth Observation Satellites (CEOS) is working on guidelines for “Analysis Ready Data” meant to harmonize parameter descriptions and metadata.
Business Intelligence association, standardization organizations, and EO federations seem to be the right fora for discussing possible governances for Data-Cube SoS. The Ecosystem view characteristics are summarized in .
Table 6. Composition/Ecosystem View main characteristics.
4. Interoperability recommendations
To enable and facilitate Data-Cube infrastructures interoperability, the specified views permit the introduction of a set of interoperability recommendations, for designing and implementing the system architectures. Some of these recommendations are general best practices, dealing with the viewpoint modeling appliance; others address specifically the Data-Cube content and its cyber-infrastructural (and systemic) design.
4.1. General recommendations
Keep the views as orthogonal (i.e. independent) as possible to recognize specific system aspects and address particular user concerns. Each view should represent the whole system from the point of view of a specific stakeholder category along with related requirements and concerns. In the ideal situation, it is possible to obtain a complete separation of concerns and the different views result orthogonal. In designing a complex system, this greatly helps since changes in a view do not affect the other views – the consequent benefits for system implementation and interoperability are evident. Where this is not possible, due to the extreme complexity of the system or to the intrinsic overlap of concerns specified by different stakeholder categories, the views must be kept as much independent as possible.
Keep the views technology-neutral. The experience of past years in information technology clearly shows how technologies quickly change in response to innovation. Solutions that are strictly related to a specific set of technologies may be not able to move toward or integrate new technologies, hampering the evolvability of the system. In addition, abstraction is always a good practice to enable interoperability – see for example the model driven interoperability, conceptual interoperability strategies.
Make sure all views are adequately addressed. The different views should be selected reflecting the points of view of the most relevant stakeholder categories. Therefore, the different views should be adequately addressed according to a well-defined prioritization of stakeholder categories and related requirements and concerns. Inadequate characterization of stakeholders, insufficient requirements analysis, and unclear definition of concerns may fail to address a view in a proper manner. Failing to address a view may result in loss of effectiveness and efficiency of the system as a whole and more specifically for the stakeholder category that expressed the view.
4.2. Content recommendations
Use well-known ontologies and variables types – domain-oriented. There exists several types of data sharing “interoperability” (Nativi, Craglia, & Pearlman, Citation2013), ranging from the simple technical and syntactical interoperabilities to the more complex semantic, dynamic, and conceptual ones. Different levels of interoperability support diverse functionalities characterizing the process of data sharing (Vaccari, Craglia, Fugazza, Nativi, & Santoro, Citation2012): discovery, evaluation, access, visualization, and use. To achieve all of them (and in particular the use functionality), semantic interoperability and conceptual composability are necessary. Well-accepted (domain-related) data typing and ontology specification are two instruments to reach Community consensus on these issues. For example, in the EO domain, the Data-Cube system Designers should make use of existing EO variable types and, more generally, open EO vocabularies for characterizing the “cube” content, and existing registries to share the definitions of such characteristics. The same should be done with other domain data-sets covering domains such as: economy, social sciences, health, etc. RDA PIT recommendations should be considered.
Apply multidimensional modelling and dimension neutrality – using cube as an alias for hyper-cube. A Data-Cube implements a multidimensional structure that contains information for analytical purposes. Therefore, for a given analysis, a Data-Cube should be the place where all useful data are stored and managed for such an investigation. Since a “cube” contains dimensions and measures, it should not have significant constraints on supported dimensions and measurements to be flexible, re-usable and interoperable with other “cubes”. Multidimensional model stems from the need to accommodate the disparate business queries (requested by customers) and not from the acquisition strategy typically used by EO sensors. N-dimensional data-sets should be supported, with N greater than three: as in the Business Intelligence domain, the cube term must be used as a short notation for hyper-cube. In particular, for the Big Earth Data domain, this entails the need to support geometry models more general than the traditional ISO TC211 coverage geometries, defining a limited spatio-temporal domain.
4.3. Cyber-Infrastructural and systemic recommendations
Implement the basic (and abstract) OLAP functionalities. The Data-Cube concept was introduced in the Business Intelligence realm and mature technological solutions already exist in such a domain. To push interoperability and facilitate applications sustainability, a general consensus was achieved on a set of abstract OLAP functionalities enabling a business-oriented environment. For the EO domain, it is important to implement the same functionalities for several reasons, including: the increasing importance of interoperability with the existing Business Intelligence applications and systems (e.g. to contribute to economic and social objectives), the prospect of contributing to a variety of multidisciplinary applications and joining well-established SECO, and the opportunity to converge on an already mature, general, and abstract APIs.
Apply SoS ecosystem patterns to enable distribution, viability, and to preserve users freedom. Fluidity of user choice should be allowed by supporting multi-regional, multi-domain, and multi-organizational interoperability. This requires a change of perspective, where a Data-Cube platform does not aim to confine users but, on the contrary, is part of larger cyber-infrastructures, such as global (or macro-regional) Data-Cube SECOs. To achieve that, Data-Cube architectures should leverage the successful experience gained on data and service sharing in the SoS and SECO domains. In the near future, several Data-Cube systems are expected covering different domains, applications, geographical and political areas. Creating a macro-regional and/or global Data-Cubes would require the development of a SoS to avoid duplication of effort and provide the flexibility and sustainability requested by the stakeholders. For these reasons, the creation of a Data-Cube SoS seems a good viable solution.
Apply Collaboration/Acknowledge governance patterns to administrate the Data-Cube SoS. SoS can be classified according to the degree of autonomy or belonging attitudes characterizing the component systems (called enterprise systems) versus the overall SoS. In a Virtual SoS, the enterprise components are completely autonomous, and the SoS emerges from a free interaction among them. On the other side, Directed SoS are created by a central organization and its enterprise systems have no autonomy. Collaborative and Acknowledge SoS stay in the middle, enterprise systems are neither fully autonomous nor belonging to the SoS. In Collaborative SoS, enterprise systems privilege belonging; while, in Acknowledged SoS, they privilege autonomy. Global and Macro-regional Data-Cubes should first consider the implementation of an Acknowledged SoS as it is characterized by a very low entry barrier – it imposes few interoperability constraints to the enterprise systems. In a second phase, it is possible to implement a transition toward a Collaborative SoS, which would allow to improve the Data-Cube effectiveness by acting also on its enterprise components.
Make use of well-accepted solutions for representing data defined on a spherical geometry domain. In the Big Earth Data domain, global and macro-regional Data-Cube infrastructures must deal with the representation of data defined on spherical geometry domain (in alternative to the usual plane one utilized for local scales). This can be an important challenge for establishing interoperability among different Data-Cube infrastructures. For example, to deal with that, Discrete Global Grid Systems (DGGS) have been utilized. They are spatial references that use a hierarchical tessellation of cells to partition and address the entire globe (Peterson, Citation2017). DGGS provide an organizational structure that permits fast integration between multiple sources of large and variable geospatial data sources sufficient for web-based visualization and analysis – see virtual globes.
5. Conclusions and future work
Data-Cube infrastructures are likely to become increasingly important to underpin the study of Earth systems science, enabling new global change applications. These infrastructures can provide the useful functionalities to analyze and extract information from the present and (more significantly) the future long (satellite based) time series that are characterized by a spatial and temporal resolution never seen before. Big Data Analytics requires Analysis Ready Data, and multidimensional data warehouses proved to be able to satisfy such demand. The multidimensional data “cube” concept originated in the Business Intelligence realm in the final decade of the twentieth century. In such a context, since data-sets dimensionality can be greater than three, cube is used as a short notation for hyper-cube. Traditionally, Data-Cubes have been used along with another computational technology: OLAP (Online Analytical Processing) for analyzing (big) data to look for insights. Today, data warehouse and hyper-cube technologies are supported by the majority of data management systems – e.g. relational, array, columnar NoSQL. Such a rich legacy must be leveraged by the (Big) Earth Data Community to integrate better with other domains outside space, re-use existing and mature technologies, models, and solutions and avoid wasting time and resources.
This manuscript proposed a Data-Cube infrastructure model based on a set of viewpoints. The overall modeling purpose was to stress important interoperability and re-usability aspects that should be carefully considered when designing an Earth Data-Cube infrastructure. A set of interoperability views were introduced and characterized to facilitate the comprehension of the complexity of Data-Cube systems and the possible interoperability levels necessary for being part of larger ecosystems. This model aims to support and complement the ongoing discussion on the “cube” facets, initiated by the developers of some significant Data-Cube infrastructures (Strobl et al., Citation2017).
The views introduced can lay the foundations to compare the interoperability features characterizing the different data cubes implementations, accelerating Data-Cube infrastructures composability and re-usability. For this purpose, building on the views defined, a set of (preliminary) interoperability recommendations were presented.
The future success of Big Earth Data-Cube infrastructures will largely depend on aspects such as: usability and flexibility to address customers’ needs, effectiveness and sustainability in a competing Web data market, and interoperability for contributing to the digital industry revolution. The existence of an interoperability model for Data-Cube infrastructures (outlining the key architectural interoperability levels) can significantly contribute to address all these success factors. In the context of (Big) Earth Data-Cube infrastructures, such a model is necessary also to develop interoperable regional and global Data-Cube ecosystems.
Potential users want to keep choice fluidity and use as many Data-Cube services as possible regardless of the platform and organization that control them. This asks Data-Cube systems for belonging to larger SoS (such as global or macro-regional software ecosystems) and avoiding to confine user in their service platform. For this aim, Data-Cube architecture designers should consider the valuable experience gained in the SoS domain for Big Earth Data.
Future work will include the analysis and comparison of present Data-Cube infrastructures applying the view-based model introduced here to assess their interoperability potentialities.
Disclosure statement
No potential conflict of interest was reported by the authors.
Funding
This research was supported by the European Commission in the framework of the H2020 ECOPOTENTIAL project (ID 641762), the H2020 SeaDataCloud project (ID 730960), and the FP7 EarthServer project (ID 283610).
Acknowledgments
The Authors would like to thank our colleagues who co-authored the abstract “The Six Faces of the Data Cube” recently submitted to the BiDS conference for the useful discussion: Peter Strobl, Peter Baumann, Adam Lewis, Zoltan Szantoi; Brian Killough, Matt Purss, Alex Held, Trevor Dhu.
Data availability statement
Data sharing is not applicable to this article as no new data were created or analysed in this study.
Notes
The views expressed are purely those of the authors and may not in any circumstances be regarded as stating an official position of the European Commission.
References
- Adamson, C. (2017). Dimensional models in the big data era. Retrieved September 25, 2017, from https://tdwi.org/Articles/2017/04/12/Dimensional-Models-in-the-Big-Data-Era
- Ariza-Porras, C., Bravo, G., Villamizar, M., Moreno, A., Castro, H., Galindo, G., … Lozano, P. (2017). CDCol: A geoscience data cube that meets colombian needs. In Advances in computing. Communications in computer and information science (Vol. 735, pp. 87–99). Cham: Springer.
- Baumann, P. (2009). Web coverage processing service (WCPS) language. OGC IS 08-068r2.
- Baumann, P., Mazzetti, P., Ungar, J., Barbera, R., Barboni, D., Beccati, A., … Campalani, P. (2016). Big data analytics for earth sciences: The EarthServer approach. International Journal of Digital Earth, 9(1), 3–29. doi:10.1080/17538947.2014.100310610.1080/17538947.2014.1003106
- Bolt, A., & van der Aalst, W. (2015). Multidimensional process mining using process cubes. In K. Gaaloul, R. Schmidt, S. Nurcan, S. Guerreiro, & Q. Ma (Eds.), Enterprise, business-process and information systems Modeling. CAISE 2015. Lecture notes in business information processing (Vol. 214, pp. 102–116). Cham: Springer.
- Camara, G., Vinhas, L., Queiroz, G., Ferreira, K., Souza, R., Assis, L. F., … Sánchez, A. (2017). The E-sensing architecture for big earth observation data analysis. 2017 BiDS. Toulouse.
- CF Standard Names. (2017). CF standard names. Retrieved September 27, 2017, from http://cfconventions.org/standard-names.html
- Domenico, B., & Nativi, S. (2013). CF-netCDF3 data model extension standard. OGC IS 11-165r2.
- Domenico, D., Caron, J., Davis, E., Nativi, S., & Bigagli, L. (2006). GALEON: Standards-based web services for interoperability among Earth sciences data systems. In Geoscience and Remote Sensing Symposium, 2006. IGARSS 2006. IEEE International Conference. Denver, CO.
- Dubler, C., & Wilcox, C. (2002). Just what are cubes anyway? (A painless introduction to OLAP technology). Retrieved from Msdn.microsoft.com: https://msdn.microsoft.com/en-us/library/aa140038(v=office.10).aspx#odc_da_whatrcubes_topic2
- European Commission. (2015). A digital-single-market-strategy-europe-com2015-192-final. Retrieved from https://ec.europa.eu/, https://ec.europa.eu/digital-single-market/en/news/digital-single-market-strategy-europe-com2015-192-final
- European Commission. (2016). Space strategy for Europe. Retrieved from Europa.eu: https://ec.europa.eu/transparency/regdoc/rep/1/2016/EN/COM-2016-705-F1-EN-MAIN.PDF
- European Space Agency. (2016). What is space 4.0. Retrieved from Esa.int: http://www.esa.int/About_Us/Ministerial_Council_2016/What_is_space_4.0
- Furtado, P. e. (1999). Storage of multidimensional arrays based on arbitrary tiling. ICDE’99. Sydney.
- Giuliani, G., Chatenoux, B., De Bono, A., Rodila, D., Richard, J.-P., Allenbach, K., … Peduzzi, P. (2017). Building an earth observations data cube: Lessons learned from the Swiss data cube (SDC) on generating analysis ready data (ARD). Big Earth Data Journal. Submitted.
- Gray, J., Bosworth, A., Layman, A., & Pirahesh, H. (1996). Data cube: A relational aggregation operator generalizing group-by, cross-tab, and sub-totals. In Proceedings of the International Conference on Data Engineering (ICDE) (pp. 152–159).
- ISO TC211. (2005). ISO 19123:2005 geographic information – Schema for coverage geometry and functions. Geneva: ISO.
- ISO, IEC 10746-1. (1998). Information technology – Open distributed processing – Reference model: Overview. Geneva: ISO.
- ISO, IEC, IEEE 42010. (2011). Systems and software engineering – Architecture description. Geneva: ISO.
- Killough, B. (2017). Open data cube background and vision. Retrieved September 25, 2017, from https://www.opendatacube.org/documentation
- Laney, D. (2001). 3D data management: Controlling data volume, velocity and variety. Retrieved September 20, 2017, from http://blogs.gartner.com/doug-laney/files/2012/01/ad949-3D-Data-Management-Controlling-Data-Volume-Velocity-and-Variety.pdf
- Laplante, P. (2007). What every engineer should know about software engineering. CRC Press.10.1201/CRCWEESK
- Lewis, A., Oliver, S., Lymburner, L., Evans, B., Wyborn, L., Mueller, N., & Raevksi, G. (2017). The Australian geoscience data cube – Foundations and lessons learned. Remote Sensing of Environment. doi:10.1016/j.rse.2017.03.015
- Nativi, S., Caron, J., Domenico, B., & Bigagli, L. (2008). Unidata’s common data model mapping to the ISO 19123 data model. Earth Science Informatics, 1(2), 59–78.10.1007/s12145-008-0011-6
- Nativi, S., Craglia, M., & Pearlman, J. (2013). Earth science infrastructures interoperability: The brokering approach. IEEE Journal of Selected Topics in Applied Earth Observations and Remote Sensing, 6(3), 118–1129.
- Nativi, S., Mazzetti, P., Santoro, M., Papeschi, F., Craglia, M., & Ochiai, O. (2015). Big data challenges in building the global earth observation system of systems. Environmental Modelling & Software, 68, 1–26.10.1016/j.envsoft.2015.01.017
- OGC. (2014). Discrete global grid systems (DGGS) standards working group charter. OGC.
- Peterson, P. (2017). Discrete Global grid systems. In The International Encyclopedia of geography. New York, NY: John Wiley & Sons Ltd.
- Picoli, M., Camara, G., Sanches, I., Simões, R., Carvalho, A., Maciel, A., …, Almeida, C. (2017). Big earth observation time series analysis for monitoring Brazilian agriculture. ISPRS Journal of Photogrammetry and Remote Sensing.
- Quora. (2011). What’s the difference between a data mart and a cube? Retrieved September 25, 2017, from www.quora.com, https://www.quora.com/Whats-the-difference-between-a-data-mart-and-a-cube
- Robin, A. (2011). OGC® SWE common data model encoding standard. OGC IS 08-094r1.
- Soille, P., Burger, A., Rodriguez, D., Syrris, V., & Vasilev, V. (2017). Towards a JRC earth observation data and processing platform. In Proc. of the 2016 conference on big data from space (BiDS’16). Santa Cruz de Tenerife.
- Stackoverflow. (2011). Datamart vs. reporting Cube, what are the differences? Retrieved September 25, 2017, from Stackoverflow: https://stackoverflow.com/questions/360900/datamart-vs-reporting-cube-what-are-the-differences
- Strobl, P., Baumann, P., Lewis, A., Szantoi, Z., Killough, B., Purss, M., … Dhu, T. (2017). The six faces of the data cube. 2017 BiDS. Toulouse.
- Thanisch, P., Niemi, T., Niinimaki, M., & Nummenmaa, J. (2011). Using the entity-attribute-value model for OLAP cube construction. In J. Grabis & M. Kirikova (Eds.), Perspectives in business informatics research. BIR 2011. Lecture notes in business information processing (Vol. 90, pp. 59–72). Berlin: Springer.
- Vaccari, L., Craglia, M., Fugazza, C., Nativi, S., & Santoro, M. (2012). Integrative research: The EuroGEOSS experience. IEEE Journal of Selected Topics in Applied Earth Observations and Remote Sensing, 5(6), 1603–1611.10.1109/JSTARS.2012.2190382
- Vassiliadis, P. (1998). Modeling multidimensional databases, cubes and cube operations. In Scientific and statistical database management Proceedings, 10th International Conference. Capri.
- W3C. (2004a). OWL web ontology language. Retrieved September 27, 2017, from https://www.w3.org/TR/owl-features/
- W3C. (2004b). RDF/XML Syntax Specification (Revised). Retrieved September 27, 2017, from https://www.w3.org/TR/REC-rdf-syntax/