
ABSTRACT
The Geza arc is an important part of the Sanjiang tectono-magmatic belt and is a newly discovered copper polymetallic ore concentration area in northwest Yunnan province, Southwest China. The area comprises numerous metal ore deposits, including one super-large deposit, three large deposits, etc. The formation of these deposits was closely related to intermediate–acidic magmatic intrusions. Based on previous studies, the “big data” analysis technique was used for a comparative study of large geochemical datasets of granite related to ore-formation in the Geza porphyry copper deposit and global adakites. As a result, 1313 element combinations and 127,765 overlap ratios were obtained. The results show that the Geza porphyry has similar geochemical characteristics to global adakites (the ratios of REE and Ga to major elements are in the range of global adakites). However, the Cu, Mo, and Zn contents of the porphyry are significantly higher than those of global adakites, and the porphyry may, therefore, represent an end-member of the global range of adakite composition. In addition, the geochemistry of adakites associated with the porphyry copper deposits overlaps in part with that of global adakites, although most of the data lie outside of the range of global adakites (i.e. low Mn/Cu, Sr/Cu, Na/Cu, and Zr/Cu values, and high Th/Cu, Ba/Cu, Na/Mo, Rb/Mo, Th/Mo, Ta/Mo, Ba/Mo, Mn/Zn, and Ba/Zn values). The samples with characteristics that deviate significantly from the geochemistry of global adakites show more advanced mineralization and alteration, and a stronger relationship with Cu and Mo mineralization. The results of geochemical data mining can be used as a prospecting indicator, and provide a new scientific basis for geological prospecting of the deep levels and periphery of the Geza Cu polymetallic ore belt.
1. Introduction
The Yidun arc is located in the eastern part of the Qinghai–Tibet Plateau and between the Garzê–Litang Fault Zone and the Dege–Zhongdian Block on the southwestern edge of the Yangtze Block. The arc is the product of the Garzê–Litang western orogenic subduction in the southwest Sanjiang Paleo-Tethys. It is an important arc belt for studying the subsidence of the Garzê–Litang ocean basin and closure of the East Tethys, and an important Cu polymetallic ore belt (comprising non-ferrous metal mineral resources) in western China. The westward subduction of the Garzê–Litang oceanic crust commenced in the earliest Early Triassic, followed by westward subduction beneath the Zhongza–Zhongdian micro-continental block during the latest Late Triassic (Deng et al., Citation2014; Li, Citation2007; Liu, Li, Zhang, & Yang, Citation2017; Li, Yu, & Yin, Citation2013; Li, Zeng, Hou, & White, Citation2011; Liu, Li, & Yin, Citation2012; Liu, Zhang et al., Citation2018; Yang, Hou, Huang, & Qu, Citation2002; Zeng, Li, Wang, & Li, Citation2006).
Frequent magmatic activity has occurred in the Geza area of northwest Yunnan. Large amounts of geochemical data have been collected from magmatic rocks in the area during long-term geological exploration (Liu, Li et al., Citation2018). These rocks have I-type granite geochemistry with an adakitic affinity; however, only some are related to copper–gold mineralization. The large amounts of available data have not yet been effectively exploited and utilized, which limits our assessment of the resource potential of porphyry Cu deposits in the region and thus the efficiency of geological prospecting. Geological big data, including construction of big data-based intelligent metallogentic and identification of prospecting sign. At present, intelligent geology is still at its primary stage. The construction of big data based intelligent metallogentic and mineral prospecting is an important part of intelligent geology (Zhang & Zhou, Citation2017; Zhou, Chen et al., Citation2018; Zhou, Zhang et al., Citation2018).
This paper studies the geochemical data (including elements related and unrelated to mineralization) and discusses the reliability of geochemical indicators of ore deposits, thereby providing a scientific basis for the study and prospecting of these deposits.
1.1. Regional geological background
1.1.1. Regional structural evolution
The study area is located on the eastern margin of the Dege–Zhongdian Block in the western Garzê–Litang Fault Zone, and is bounded by the NNW-trending Jinsha River Fault Zone (). A carbonate platform developed in the area during the late Paleozoic, in a passive continental margin setting associated with the development of the Garzê–Litang ocean basin. An active continental margin formed along the Garzê–Litang subduction zone during the latest Middle–Late Triassic. The Late Triassic represents the stage of magmatic arc development, which involved deposition of a great thickness of clastic–carbonate–volcanic rocks. These rocks are divided into the Qugasi (T3q), Tumugou (T3t), and Lamaya (T3lm) formations, which comprise mainly sand slate limestone, basaltic andesite to andesite, and dacite, respectively. These Late Triassic formations make up the wall-rock of the intermediate–acidic mineralized porphyry in the region.
Figure 1. Simplified geological map of Geza arc (revised after Yunnan geological survey) (a) Tectonic map of Geza island arc, (b) Distribution diagram of magmatic rocks and mineral resources.
Early tensile fractures in the area trend NW–SE. The distribution of Late Triassic intermediate–acid volcanic rocks (related to the shallow porphyry and porphyrite) is controlled by NW- and NE-trending faults. The Jurassic–Cretaceous was marked by intracontinental convergence and post-orogenic extension. Large-scale collision-type intermediate–acidic magmatic intrusions developed during this time, comprising mainly monzogranite and remelted continental crust granite. Magmatic intrusions during the Late Cretaceous were accompanied by Mo, W, and Cu mineralization events.
1.1.2. Regional geochemistry and geophysical features
The Cu content of the Geza intrusive belt is generally higher than that of the host strata. Therefore, there is a high background level of Cu in the areas where magmatic rocks exist, compared with a low background level in strata without magmatic intrusions. The small porphyry intrusions (units γδπ, ηοπ, λπ, etc. in ) in the larger intermediate–acid composite body (unit δομ; ) have high contents of Cu, W, Mo, Au, and Ag, indicating that the area contains Late Triassic–Late Cretaceous porphyries with favorable ore-bearing properties. These geochemical characteristics are beneficial for the formation of porphyry (or skarn) type copper deposits. The Late Cretaceous biotite monzogranite (unit ηγ, ηγ; ) is characterized by high background contents of W, Mo, and Cu. Monzonitic granite-porphyry has a W content of 27.35 × 10⁻⁶ and Mo content of 9.4 × 10⁻⁶. Biotite monzogranite has a W content of 8.87 × 10⁻⁶ and Mo content of 2.66 × 10⁻⁶. These contents are much higher than those of the host strata, indicating that these magmatic intrusions generated suitable conditions for metallogenesis. Therefore, these rocks may represent the ore-forming source of the Xiuwacu and Relin quartz-vein-type W–Mo polymetallic deposit in the region.
The Geza arc is located near an N–S-trending low-gravity anomaly and low-tempered positive magnetic anomaly, which is consistent with the moderate-intensity local anomaly in the intermediate–acid volcanic alteration zone, beaded distribution in the trend. The distribution of Cu polymetallic deposits is characterized by the east–west axial elliptical positive magnetic anomalous (0–100 nT) edge or positive and negative magnetic anomaly transition zones centered on Hongshan. Interpretation of remote sensing images revealed that a line-and-ring structure is developed in the area, comprising medium- and small-scale ring structures, magmatic rings, and volcanic rings overlapping each other, with an approximately N–S-trending beaded distribution. Comprehensive analysis of regional gravity, aeromagnetic, geological, and remote sensing data indicates the occurrence of numerous buried intermediate–acidic magmatic rocks in the low-gravity belt (Liu et al., Citation2015). The Xiuwacu, Relin, Hongshan, Chundu, and A’re rocks are distributed in the area (listed from north to south), and are important in exploration for porphyry Cu deposits and skarn-type Cu polymetallic deposits.
2. Research methods
2.1. Data sources and data volume
Data for all Cenozoic granites (SiO2 > 56%) were collected from both the GEOROC and PetDB databases, and duplicated data from both databases were deleted (Supplementary Table 1). The sign of adakites is Sr> 400 × 10−6, Yb< 2 × 10⁻⁶, Y < 20 × 10−6, and not the Sr/Y ratio commonly used in academia. Because Sr/Y is a derivative symbol, element content is a primary symbol. Most samples of the databases have Y and Yb data, but some samples only have Y but no Yb. Therefore, when selecting a sample, first use Yb as a marker, and then take Y data (Y < 20 × 10−6) for those samples without Yb, thus obtaining a total of 6954 samples of global adakites.
There are 411 porphyry geochemical data in the Geza arc belt, including 11 typical ore-forming porphyries in the belt (), Pulang (Cao, Xu, Chen, Huang, & Ren, Citation2014; Li, Citation2007; Li, Li, Liu, Lai, & Yang, Citation2017; Li & Liu, Citation2015; Li et al., Citation2009; Li, Yin, Yu, Lu, & Liu, Citation2011; Liu, Li, Yin, & Zhang, Citation2013; Pang et al., Citation2009; Ren, Xu, Chen, Zhang, & Liang, Citation2011), Xuejiping (Leng, Zhang, Wang, Qin, & Gou, Citation2007; Lin, Xia, & Zhang, Citation2006), Hongshan (Huang, Xu, Chen, & Ren, Citation2012), Songnuo (Lai, Li, Liu, Yang, & Li, Citation2016), Chundu (Zou et al., Citation2011), Disuga (Liu, Li, Zhang, Yin, & Deng, Citation2014), Langdu (Ren, Zhong, Chen, Zhu, & Zhang, Citation2011), Zhuoma (Liu, Li, & Zhang, Citation2016), Qiansui (Li et al., Citation2017), Lannitang (Meng, Wang, Fan, Wang, & Tang, Citation2018), Xiuwacu (Liu, Li, Zhang, Lai et al., Citation2016; Meng, Citation2014; Wang et al., Citation2015; Yu & Li, Citation2016; Zhang, Li, Yin, Yang, & Tang, Citation2017), and Relin (Liu, Li, Zhang, Lai et al., Citation2016; Meng, Citation2014; Yang et al., Citation2017), and these above are the data foundation of the study (Supplementary Table 2).
Table 1. Porphyry geochemical data statistics in the Geza arc belt.
2.2. Data filtering principles
① Retain the data with SiO2 content more than 56% and less than 90%; ② Exclude some samples with abnormally high content of major elements, such as Fe2O3 > 30%, samples with abnormally high content of MnO; and ③ Remove abnormally high data of trace elements (samples are remained).
2.3. Confidence ellipses drawing
Confidence ellipses, also known as error ellipses, are geometric representations that intuitively reflect the difference between the estimate and the expected value of a point or average function. Using linear algebra knowlegde, the covariance matrix of the data points is calculated. The eigenvalues and eigenvectors of the matrix can be used to determine the axis lengths (major axis, short axis) and direction of the confidence ellipse, and the center of the ellipse is obtained from the mean value of the data. A confidence ellipse can be drawn after a given confidence interval.
2.4. Overlapping ratio calculating
An overlapping ratio represents the overlap degree of two data regions, namely, confidence ellipses, calculated by the Monte Carlo method. We generate a sufficient number of data points (x, y) randomly within the coordinate system, and determine the positions of the points (inside the ellipse or outside the ellipse) based on the confidence ellipse equations, and obtain the overlapping ratio between the ellipses by calculating. This paper uses the Python language to write a program that reads the cleaned data, analyzes the data and plots diagrams, and selects the best discrimination diagrams in all combinations. In constructing a discrimination diagram, in order to enhance the discriminant effect and reduce overlapping and multiple solutions, the ratios of the elements are often used as the horizontal and vertical coordinates of the diagram, such as Ti/Y-Nb/Y, La/Yb-Sc/Ni, etc. (Zhao, Qian, & Huang, Citation2007). In addition, the value distribution range of each element in the overall data tends to be much larger than the sampling data. In order to make the data relatively concentrated, the logarithm method is usually used to process the original data, and base-10 logarithm is generally taken to calculate the elements ratios (Liu, Zhang, & Zhang, Citation2017).
2.5. Data mining process
1) Collect geochemical data of all granites in the GEOROC and PetDB databases; Consult the original literature in the study area and obtain rock geochemical data; 2) Delete the duplicated data from two databases and perform data cleaning. The cleaning process should be as objective and fair as possible; 3) Secondary data cleaning, delete the abnormally high and negative values, excluding the influence of abnormal values on the statistical results; 4) Compute the data of 44 elements in pairs to obtain element combination and overlapping ratios; 6) Protract scatter plots and confidence ellipses to find their correlations; 7) Gain geochemical information through correlativity analysis and get the results from comparative studies (Liu, Li et al., Citation2018).
3. Results
This study involved comparison of the geochemistry (45 selected major and trace elements) of (1) global adakites and (2) porphyries in the Geza arc belt. Ratios of different element pairs were calculated according to the 85% confidence ellipse, resulting in a total of 127,765 overlapping ratios and 1,313 combinations (in terms of the values of different overlapping ratios; e < 0.3). The results are as follows.
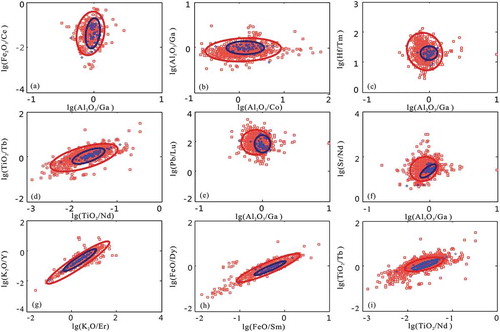
The geochemical characteristics of the porphyries of the Geza arc belt are similar to those of global adakites, within the same range of values (e.g. Fe2O3/Ce–Al2O3/Ga, Al2O3/Ga–Al2O3/Co, Hf/Tm–Al2O3/Ga, TiO2/Tb–TiO2/Nd, Pb/Lu–Al2O3/Ga, Sr/Nd–Al2O3/Ga, K2O/Y–K2O/Er, FeO/Dy–FeO/Sm, and TiO2/Tb–TiO2/Nd; ). The confidence ellipses of each group fit well and show similar trends (), indicating that they have similar geochemical characteristics. In addition, the ratios of Hf, Sr, and Pb to Al2O3, FeO, K2O, TiO2, and other major elements are similar for both the global adakites and Geza porphyries, the second is related to Ga, Co, Nd, Sm elements. This Figure shows the geochemical similarities between the Geza porphyries and global adakite.
Figure 2. Fiducial confidence ellipse scatter plots of Pulang porphyry being included in the range of global adakite In the figure, the red dots represent the global adakite data; blue dots represent Pupang data; red ellipse represents the distribution of glo.
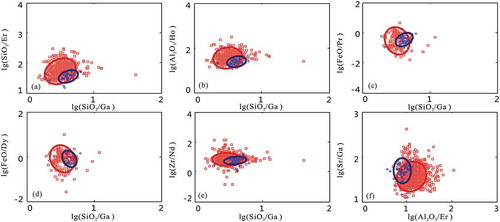
Although the data of the Geza porphyries overlap with those of global adakites, they plot mainly in one corner of the global adakite field (e.g. SiO2/Er–SiO2/Ga, Al2O3/Ho–SiO2/Ga, FeO/Pr–SiO2/Ga, FeO/Dy–SiO2/Ga, Zr/Nd–SiO2/Ga, and Sr/Ga–Al2O3/Er; ). This indicates that although the correlations between some elements ratios of the Geza porphyries and global adakites are generally similar, the Geza porphyries show less variation in their geochemistry. The geochemistry of the Geza porphyries indicates that they may represent an end-member component of global adakites, and this requires further investigation.
Figure 3. Data distribution correlation graph of Pulang porphyry and the global adakite In the figure, the red dots represent the global adakite data; blue dots represent Pupang data; red ellipse represents the distribution of global adakite data; bule ellips.
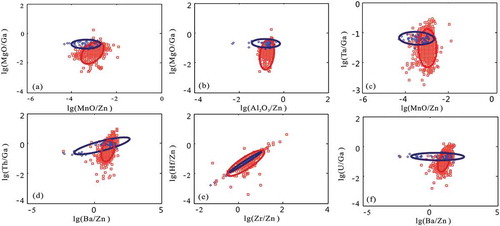
Most of the geochemical data of the Geza porphyries plot outside of the range of data for global adakites (e.g. Sr/Cu–Al2O3/Ga, Ta/Ga–Al2O3/Cu, Ta/Cu–SiO2/Cu, Ta/Ga–Na2O/Mo, Ta/Ga–Rb/Mo, MgO/Ga–MnO/Zn; –). The Geza porphyries differ from the global adakite in having lower Sr/Cu, Ta/Cu, Mn/Cu, Na/Mo, Rb/Mo, Mn/Zn, Hf, K, Ti, P, Co, Th, and Ca/Cu values; i.e. most of the data plot outside of the range of values for global adakites when the denominators in chemical ratios are Cu, Mo, or Zn. These differences in geochemistry indicate that the porphyries are ore-bearing, with a range of diagenetic and mineralization histories. The metallogenetic element Mo and incompatible elements Ta, Rb, Th, Sr, Th, and Hf are highly variable, enabling the Geza porphyries to be distinguished from the adakites. These differences may be attributed to the activity of ore-bearing fluids, and therefore these geochemical signatures may provide valuable indicators of ore-bearing porphyries for use in prospecting in deep and peripheral areas.
Figure 4. Fiducial confidence ellipse scatter plots of metallogenic element Cu in Pulang porphyry copper deposit In the figure, the red dots represent the global adakite data; blue dots represent Pupang data; red ellipse represents the distribution of global a.
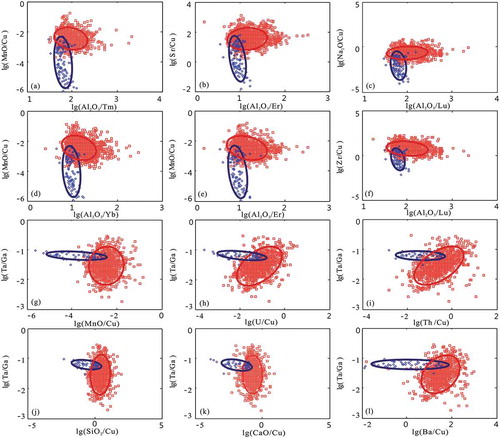
Figure 5. Fiducial confidence ellipse scatter plots of metallogenic element Mo in Pulang porphyry copper deposit.
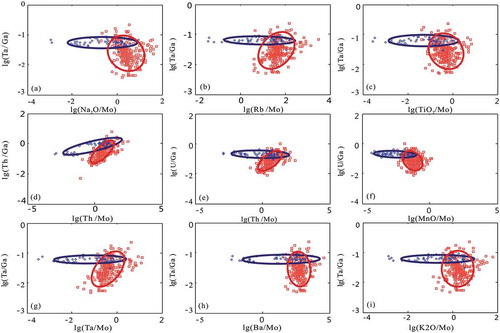
Figure 6. Fiducial confidence ellipse scatter plots of metallogenic element Zn in Pulang porphyry copper deposit In the figure, the red dots represent the global adakite data; blue dots represent Pupang data; red ellipse represents the distribution of global a.
4. Discussion
Here we discuss the significance of the differences in average trace-element contents of the Geza porphyries and global adakites. shows a spiderdiagram for the Geza adakites normalized by the average global adakite, revealing (1) elements with similar distributions between the Geza porphyries and global adakites; (2) elements with different distributions between the Geza porphyries and global adakites; and (3) elements with anomalous contents (e.g. Cu and Mo) in the Geza porphyries. Cu and Mo are ore-forming elements in the Geza porphyry, and Cu–Mo contents are anomalously high in those Geza porphyries that are most strongly affected by ore-bearing fluids, reflecting ore-related hydrothermal or mineralization alteration. This is the most important prospecting criterion for the Geza porphyry Cu deposit. Elements that belong to the second category are Ba, K, Zn, W, Ga, Sr, and Ti, among which W and Ga exhibit negative anomalies, and the remaining elements belong to the first category and occur at concentrations similar to those of the average global adakite. These element groupings have a number of implications: the first group contains elements with similar concentrations between the porphyries and global adakites, and the third group includes elements that show the greatest differences between the two types of rock, and may therefore be used as a prospecting tool.
Figure 7. Primitive mantle normalized spider diagram of trace element of Geza porphyry.
The main geochemical differences between the Geza porphyries and global adakites are illustrated in –. illustrates three important features: (1) the red data points represent the range of values for global adakites (the dotted line represents the 85% confidence ellipse, so the data points outside of the ellipse may be unreliable); (2) the blue data points represent the Geza porphyries, including altered samples, and many of the data points fall in the range of the 85% confidence ellipse for the adakite data, indicating that most of the Geza porphyry data are reliable; and (3) there is a partial overlap between the Geza porphyries and global adakites. The yellow arrow indicates the trend of alteration and mineralization of the Geza porphyries. In the case of low ore-bearing fluid activity and weak mineralization, the Geza porphyry samples plot within the range of the adakite samples (i.e. feature 3, as outlined above). With increasing intensity of ore-bearing fluid activity and mineralization, the data points of the Geza porphyry deviate increasingly from those of global adakites.
Figure 8. Example of fiducial confidence ellipse scatter plot of Sr/Cu-Al2O3/Er of Pulang porphyry and the global adakite In the figure, the red dots represent the global adakite data; blue dots represent Pupang data; red ellipse represents the distribution o.
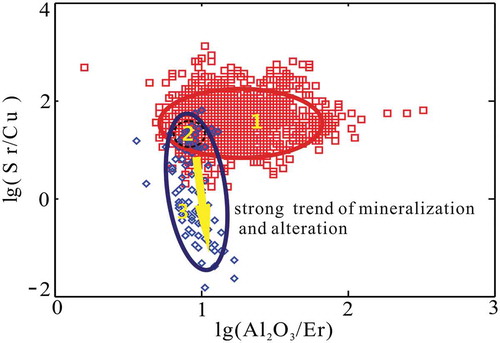
also provides information on three “zones” of geochemical distributions, as follows. In Zone 1, the geochemistry of global adakites overlaps with the range of global adakites. In Zone 2, data points of adakites associated with Cu-polymetallic mineralization in the Geza porphyries overlap with those of global adakites (–; i.e. there is a close relationship between adakite and the formation of porphyry Cu–Mo–Au deposits). Porphyry associated with porphyry copper deposits also plots in this zone. In Zone 3, the greater the degree to which the data deviate from the global adakite range, the stronger the alteration and mineralization; consequently, these geochemical characteristics can be used in prospecting. The granite samples from the Geza area plot in the lower part of the global adakite field in the Al2O3/Er versus Sr/Cu diagram () and in scatter diagrams of MnO/Cu–Al2O3/Tm, Na2O/Cu–Al2O3/Lu, MnO/Cu–Al2O3/Yb, MnO/Cu–Al2O3/Er, and MnO/Cu–Al2O3/Lu (). In contrast, the granite samples plot in the higher parts of the global adakite field in the scatter diagrams of Ta/Ga–MnO/Cu, Ta/Ga–U/Cu, Ta/Ga–Th/Cu, Ta/Ga–SiO2/Cu, Ta/Ga–CaO/Cu, Ta/Ga–Ba/Cu, Ta/Ga–Na2O/Mo, Ta/Ga–Rb/Mo, and Ta/Ga–TiO2/Mo (). Thus, the three zones identified from adakite geochemistry are not necessarily related to mineralization.
5. Conclusions
(1) Our analysis of very large geochemical datasets (“big data”) of porphyries in the Geza arc shows that the porphyries have a positive correlation with global adakites (), indicating that they have adakitic properties. The data are concentrated in a corner of the global adakite field (), which illustrates the unique geochemical characteristics of the Geza porphyries. This unique geochemistry may have been derived from the source rocks, the degree of partial melting, magma mixing, and/or contamination, and may also reflect the influence of hydrothermal fluid activity on the ore-bearing rocks. Most of the Geza porphyry data plot outside the range of global adakites (–), due to mainly the anomalous contents and ratios of some elements. This enables the identification of ore-bearing porphyries.
(2) Some of the geochemical data of the Geza porphyries overlap with the data of the adakite field (Zone 1), which reflects porphyries unrelated to copper–molybdenum mineralization. Samples that plot in the area of Zone 2 (far from Zones 1 and 3) have been strongly affected by ore-bearing fluids and are closely related to copper–molybdenum mineralization. Samples in Zone 3 are related to copper–molybdenum mineralization. Therefore, geochemical data mining has identified new geochemical signatures that can be used for geological prospecting in deep and peripheral areas of the Geza copper polymetallic deposit.
Data availability statement
The data referred to in this paper is not publicly available at the current time.
Supplemental Material
Download Zip (3 MB)Disclosure statement
No potential conflict of interest was reported by the authors.
Supplementary material
Supplementary data for this article can be access here.
Additional information
Funding
Related Research Data
References
- Cao, K., Xu, J. F., Chen, J. L., Huang, X. X., & Ren, J. B. (2014). Origin of porphyry intrusions hosting superlarge Pulang porphyry copper deposit in Yunnan Province: Implications for metallogenesis. Mineral Deposits, 33(2), 307–322.
- Deng, J., Wang, Q. F., Li, G. J., Li, C. S., & Wang, C. M. (2014). Tethys tectonic evolution and its bearing on the distribution of important mineral deposits in the Sanjiang region, SW China. Gondwana Research, 26(2), 419–437.
- Huang, X. X., Xu, J. F., Chen, J. L., & Ren, J. B. (2012). Geochronology, geochemistry and petrogenesis of two periods of intermediate-acid intrusive rocks from Hongshan area in Zhongdian arc. Acta Petrologica Sinica, 28(5), 1493—1506.
- Lai, A. Q., Li, W. C., Liu, X. L., Yang, F. C., & Li, Z. (2016). Zircon U-Pb dating, geochemical characteristics of Songnuo quartz monzonite porphyries in the Geza arc, Yunnan Province, and their geological significance. Geological Review, 62(4), 955–969.
- Leng, C. B., Zhang, X. C., Wang, S. X., Qin, C. J., & Gou, T. Z. (2007). Geochemical characteristics of porphyry copper deposits in the Zhongdian area, Yunnan as exemplified by the Xuejiping and Pulang porphyry copper deposits. Acta Mineralogica Sinica, 27(3–4), 414–422.
- Li, W. C. (2007). The tectonic evolution of the Yidun Island Arc and the metallogenic model of the Pulang porphyry copper deposit, Yunnan, SW China. Doctoral thesis of China University of Geosciences in Beijing, 15–80.
- Li, W. C., & Liu, X. L. (2015). The metallogenic regularity related to the tectonic and petrographic features of Pulang porphyry copper orefield, Yunnan, and its ore-controlling characteristics. Earth Science Frontiers, 22(4), 53–66.
- Li, W. C., Yin, G. H., Lu, Y. X., Liu, X. L., Xu, D., Zhang, S. Q., & Zhang, N. (2009). The evolution and 40 Ar-39Ar isotopic evidence of the Pulang complex in Zhongdian. Acta Geologica Sinica, 83(10), 1421–1429.
- Li, W. C., Yin, G. H., Yu, H. J., Lu, Y. X., & Liu, X. L. (2011). The porphyry metallogenesis of Geza volcanic magmatic arc in NW Yunnan. Acta Petrologica Sinica, 27(9), 2541–2552.
- Li, W. C., Yu, H. J., & Yin, G. H. (2013). Porphyry metallogenic system of Geza arc in the Sanjiang region, Southwestern China. Acta Petrologica Sinica, 29(4), 1129–1144.
- Li, W. C., Zeng, P. Z., Hou, Z. Q., & White, N. C. (2011). The Pulang porphyry copper deposit and associated felsic intrusions in Yunnan Province, Southwest China. Economic Geology, 106(1), 79–92.
- Li, Z., Li, W. C., Liu, X. L., Lai, A. Q., & Yang, F. C. (2017). Geochronological and geochemical characteristics of Qiansui quartz diorite porphyrite in the Geza Arc, Yunnan Province, and their constrairts on diagenesis and mineralization. Geology in China, 44(3), 541–555.
- Lin, Q. C., Xia, B., & Zhang, Y. Q. (2006). Zircon SHRIMP U-Pb dating of the syn-collisional Xuejiping quartz diorite porphyrite in Zhongdian, Yunnan, China, and its geological implications. Geological Bulletin of China, 25(1), 133–137.
- Liu, X. L., Li, W. C., & Yin, G. H. (2012). The metallogenic system of porphyry-skarn type Cu, Mo (Au) polymetallic deposits in Geza island arc of Yunnan Province. Geology in China, 39(4), 1007–1022.
- Liu, X. L., Li, W. C., Yin, G. H., & Zhang, N. (2013). The geochronology, mineralogy and geochemistry study of the Pulang porphyry copper deposits in Geza arc of Yunnan Province. Acta Petrologica Sinica, 29(9), 3049–3064.
- Liu, X. L., Li, W. C., & Zhang, N. (2015). The crustal uplift history of the southern tip of Yidun Island Arc in Southwest Sanjiang region and significance of resource evaluation. Acta Geologica Sinica, 89(2), 289–304.
- Liu, X. L., Li, W. C., & Zhang, N. (2016). Zircon U-Pb age and geochemical characteristics of the quartz monzonite porphyry from the Zhuoma deposit, Yunnan, China. Bulletin of Mineralogy, Petrology and Geochemistry, 35(1), 109–117.
- Liu, X. L., Li, W. C., Zhang, N., Lai, A. Q., Li, Z., & Yang, F. C. (2016). Metallogenic system of the Yanshanian porphyry Mo polymetallic deposit in the Xiangcheng-Lijiang suture zone, western margin of Yangtze block, SW China. Acta Petrologica Sinica, 32(8), 2281–2302.
- Liu, X. L., Li, W. C., Zhang, N., & Yang, F. C. (2017). Geochemistry and petrogenesis of Triassic mineralized porphyries in the Geza of the Sanjiang orogenic belt, Southwestern China. International Geology Review, 59(8), 965–980.
- Liu, X. L., Li, W. C., Zhang, N., Yin, G. H., & Deng, M. G. (2014). Geochronological, geochemical characteristics of Disuga Ore-forming I-type granitic porphyries in the Geza arc, Yunnan Province, and their geological significance. Geological Review, 60(1), 103–114
- Liu, X. L., Li, W. C., Zhang, N., Zhu, J., Luo, Y., Yang, F. C., Wang, S. S. (2018). Comparative study on mineralization-related granite of Pulang porphyry copper deposit in Northwestern Yunnan and Global adakite: The preliminary results of big data research. Acta Petrologica Sinica, 34(2), 289–302.
- Liu, X. L., Zhang, Q., Li, W. C., Yang, F. C., Zhao, Y., Li, Z., & Du, X. L. (2018). Applicability of large-ion lithophile and high field strength element basalt discrimination diagrams. International Journal of Digital Earth, 11(7), 752–760
- Liu, X. Y., Zhang, Q., & Zhang, C. L. (2017). A discussion on the tectonic setting of global Cenozoic andesite. Chinese Journal of Geology, 52(3), 649–667
- Meng, M. L. (2014). The Porphyry Copper-polymetallic deposit in Zhongdian, West Yunnan: Magmatism and mineraliztion. Doctoral thesis of China University of Geosciences in Beijing, 30–80.
- Meng, M. L., Wang, C. L., Fan, T., Wang, Y. P., & Tang, S. J. (2018). Analysis on geochemical characteristics and genesis of lannitang porphyry copper deposit, Yunnan. Mineral Exploration, 9(2), 223–231.
- Pang, Z. S., Du, Y. S., Wang, G. W., Guo, X., Cao, Y., & Li, Q. (2009). Single-grain zircon U-Pb isotopic ages, geochemistry and its implication of the Pulang complex in Yunnan Province, China. Acta Petrologica Sinica, 25(1), 159–165.
- Ren, J. B., Xu, J. F., Chen, J. L., Zhang, S. Q., & Liang, H. Y. (2011). Geochemistry and petrogenesis of Pulang porphyries in Sanjiang region. Acta Petrologica et Mineralogica, 30(4), 581–592.
- Ren, T., Zhong, H., Chen, J. F., Zhu, W. G., & Zhang, X. C. (2011). Geochemical characteristics of the Langdu high-k intermediate-acid intrusive rocks in the Zhongdian area, Northwest Yunnan Province, P. R. China. Acta Mineralogica Sinica, 31(1), 43–54.
- Wang, X. S., Bi, X. W., Hu, R. Z., Leng, C. B., Yu, H. J., & Yin, G. H. (2015). S-Pb isotopic geochemistry of Xiuwacu magmatic hydrothermal Mo-W deposit in Zhongdian area, NW Yunnan: Constrains on the sources of metal. Acta Petrologica Sinica, 31(11), 3171—3188.
- Yang, F. C., Li, W. C., Liu, X. L., Li, Z., Lai, A. Q., Yan, T. L., & Wang, S. S. (2017). Rock genesis and Dynamic background of Relin Monzogranite in Geza arc belt, Yunnan: Constrains from Lithogeochemistry, Chronology, Hf Isotope. Geology and Exploration, 53(2), 283–299.
- Yang, Y. Q., Hou, Z. Q., Huang, D. H., & Qu, X. M. (2002). Collision orogenic process and magmatic metallogenic system in Zhongdian arc. Acta Geoscientia Sinica, 23(1), 17–24.
- Yu, H. J., & Li, W. C. (2016). Geochronology and geochemistry of Xiuwacu intrusions, NW Yunnan: Evidences for two-period magmatic activity and mineralization. Acta Petrologica Sinica, 32(8), 2265–2280.
- Zeng, P. S., Li, W. C., Wang, H. P., & Li, H. (2006). The Indosinian Pulang superlarge porphyry copper deposit in Yunnan, China: Petrology and chronology. Acta Petrologica Sinica, 22(4), 989–1000.
- Zhang, Q., & Zhou, Y. Z. (2017). Big data will lead to a profound revolution in the field of geological science. Chinese Journal of Geology, 52(3), 637–648
- Zhang, X. F., Li, W. C., Yin, G. H., Yang, Z., & Tang, Z. (2017). Geological and mineralized characteristics of the composite complex in Xiuwacu W-Mo mining district, NW Yunnan, China: Constraints by geochronology, oxygen fugacity and geochemistry. Acta Petrologica Sinica, 33(7), 2018–2036.
- Zhao, Z. H., Qian, H. D., & Huang, S. (2007). Application of multivariate statistic analysis to two kinds of ores in Jinchuan copper-nickel sulfide deposit. Geological Journal of China Universities, 13(1), 127–136.
- Zhou, Y. Z., Chen, S., Zhang, Q., Xiao, F., Wang, S. G., Liu, Y. P., & Jiao, S. T. (2018). Advances and prospects of big data and mathematical geoscience. Acta Petrologica Sinica, 34(2), 256–263.
- Zhou, Y. Z., Zhang, L. J., Zhang, A. D., & Wang, J. (2018). Big data mining & machine learning in geoscience (pp. 1–274). Guangzhou: Zhongshan University Press.
- Zou, G. F., Li, F., Li, B., Xu, G. D., Yang, X. T., Jian, R. T., … Li, N. (2011). Rock geochemistry of inrusive rocks in the Chundu porphyry copper deposit in the Northwest of Yunnan Province. Mineral Resources and Geology, 25(5), 405–411.