
ABSTRACT
Big Earth Data analysis is a complex task requiring the integration of many skills and technologies. This paper provides a comprehensive review of the technology and terminology within the Big Earth Data problem space and presents examples of state-of-the-art projects in each major branch of Big Earth Data research. Current issues within Big Earth Data research are highlighted and potential future solutions identified.
1. Introduction
Over the last 30 years the rate of production and collection of Big Earth Data has been increasing rapidly (Gantz & Reinsel, Citation2012; Mahdavi-Amiri, Alderson, & Samavati, Citation2015), with Earth Observation data alone doubling in volume every 2 years (Riensel, Gantz, & Rydning, Citation2017). This rise in data volume is accompanied by an equivalent increase in velocity and variety (Soubra, Citation2012) and these bring along with them further issues in terms of verifying the data and determining what value the data holds (Guo et al., Citation2017). While this problem is not unique to Big Earth Data (Chen, Mao, & Liu, Citation2014; Guo, Wang, Chen, & Liang, Citation2014; Wu, Zhu, Wu, & Ding, Citation2014), it is an area in which many different types of organizations interact: Governmental, research, commercial, and nonprofits, which gives rise to unique collaboration, interaction (Liu, Li, Li, & Wu, Citation2016; Philip Chen & Zhang, Citation2014), and communication (Chi et al., Citation2016; Nativi et al., Citation2015) problems.
This review paper draws together the background, terminology, and technology of Big Earth Data systems to provide a comprehensive overview for researchers in the field. The paper will introduce the terminology of the field (including the five Vs above) and then cover: the Big Data problem space; existing visualization platforms and tools—the state of the art in terms of storage, management, visualization, mining, and processing; and finally presenting current issues and future solutions to Big Earth Data problems.
2. Terminology
As in many fields Big Earth Data introduces many new concepts, rebrands existing terms, and contextualizes others. This section discusses the main terms of art within the Big Earth Data field and contextualizes them for the reader.
2.1. Big Earth Data
Big Earth Data is a subset of Big Data (SAS Institute Inc, Citation2018) which is based around Earth Sciences and primarily includes Earth Observation data, e.g. satellite, weather, Human-derived activity, etc. with the primary purpose of enabling data-driven analysis, interpretation, and understanding of Earth-based interactions. The following is as close to a concise definition as can be found (International Society for Digital Earth, Citation2017)
Big Earth data refers to big data associated with the Earth sciences, derived from but not limited to Earth observation. Big Earth data is characterized as being massive, multi-source, heterogeneous, multi-temporal, multi-scalar, highly dimensional, highly complex, nonstationary, and unstructured. It consists of all data related to the Earth, including the Earth’s interior, surface, atmosphere, and near-space environment. Following the lead of big data in other disciplines, big Earth data serves as the basis of data-intensive scientific discovery in the Earth sciences, and gradually becomes a new engine of knowledge innovation.
2.2. The five Vs
The characteristics of Big Earth Data systems are typically classified as the five Vs, velocity, variety, volume, value, and veracity. These effect all big data systems; however, the scale and effects of Big Earth Data mean that we must consider these with particular attention. We define these terms further.
2.2.1. Velocity
Velocity refers to either the rate at which new data are being generated or to the rate at which data must be processed to be useful.
2.2.2. Variety
Variety refers to the number of unique types of data present in a Big Data project. Typically, this will have an impact on the ability to utilize structured data storage systems such as databases efficiently and effectively (Soubra, Citation2012).
2.2.3. Volume
Volume refers to the amount of data associated with a Big Data project, most big data projects will involve a minimum of 10s of terabytes of data with many projects being in the multipetabyte range. With this scale of data traditional database single-device database systems will struggle to manage and utilize the data effectively. If these data are unstructured then this storage becomes more complex as many entries are effectively unique.
2.2.4. Value
Value refers to the concept that data must provide some usable output or knowledge in order to have made collecting and storing it worthwhile. Value can be seen in many Big Earth Data studies such as climate investigations (Guo et al., Citation2017); however, the data value density is often very low with only a small subset of the complete data set being valuable to each project. This low data value density, however, high data value clustering requires highly effective data storage, retrieval, and processing techniques to efficiently acquire information from the dataset.
2.2.5. Veracity
Veracity refers to the overall quality of the data available. The quality of data can be impacted by noise or abnormalities in the original data gathering process, or through improper processing (Lakshen, Vraneš, & Janev, Citation2016). Big Data presents some unique issues due to the methods of data collection—slight variations in both the state of the recording equipment and the environmental conditions of the subject can dramatically alter the quality of incoming data. Postprocessing is often required to reorientate and reorganize the data set, however care must be taken while doing this to protect the veracity of the data (Batini et al., Citation2017).
Veracity can also be impacted during the presentation of data, poor usage of visualization methods can completely create a distorted view of the data leading to invalid conclusions being drawn and communicated (Bresciani & Eppler, Citation2018).
2.3. Geo/Earth Science
Geo and Earth Science are the terms which have taken hold as the primary terms for the study of the planet Earth at all levels—though primarily broken down into four branches of study: the lithosphere (surface topology, geology, and effects), the hydrosphere (the effects of surface and subsurface water), the atmosphere, and the biosphere (ecological effects including human factors). Until fairly recently Earth Science has been a very hands on branch of science involving direct observation and mapping of effects and results of experimentation “in the field.” As we gain more and more capability to observe remotely this has given rise to a special area: Earth Observation.
Earth Observation is then a specialization of Earth/Geo Science specifically focused on our ability to gather data remotely. Earth Observation focuses on the gathering of information about the Earth under categories such as physical geography, chemical and biological composition, natural resources, and human factors primarily through remote-sensing technologies (EO-MINERS, Citation2018) and backed up by direct Earth surface and subsurface surveying techniques (van der Meer, Citation2018). These data are then utilized to allow for the extrapolation and mapping of trends including: weather forecasting, natural disaster tracking and monitoring, disease and health monitoring, or climate change analysis.
Groups such as ESA (European Space Agency), NASA (National Aeronautics and Space Administration), and Google, gather terabytes (TB) of data about the planet each day from various satellite platforms, such as Landsat (Land Remote-Sensing Satellite), MODIS (Moderate Resolution Imaging Spectroradiometer), EOS (Earth Observing System), and GPS (Global Positioning System). That feeds large volumes of free data into the Big Earth Data system allowing for an increasing complexity of analysis (NASA, Citation2018c).
2.4. Structured data
Structured data are organized data which have a known structure, size, and format, making it suitable for indexing and automated metadata creation allowing for the creation of searchable, indexable, and retrievable data management systems. Structured data will typically include data such as temperature measurements, rainfall, or other well-structured data.
2.5. Unstructured data
Unstructured data refers to all other forms of data (Taylor, Citation2018) and comprises data of variable types, sizes, multidata set collections, and other arbitrary data formats. Typically, common data such as audio, video, and images will fall under the category of unstructured due to variable size, format, and resolutions.
2.6. Data cubes
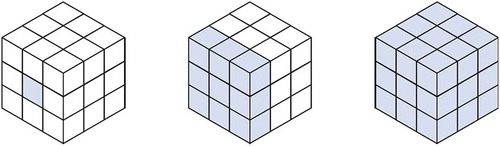
A data cube is at its simplest a three-dimensional (3D) array of data with meaning applied to layers within the cube as well as to the rows and columns (illustrated in ). Data cubes are a way of applying structure to unstructured data or to provide an aggregate data set that pulls together multiple individual data sources. An example of this would be the changes in rainfall over a geographic area—each layer within the cube would represent a time period with the value in each cell being the rainfall value at a geographic location indicated by the row and column.
Figure 1. Illustration of the elements of a data cube, from left to right a cell which contains a single data element; a layer which contains a related set of data elements; and a cube which contains multiple related sets of data elements, e.g. geographic, hydrological, and human effects over time.
3. The Big Earth Data problem space
Data acquisition in Big Earth Data is a massive challenge, data are collected from an extremely varied number of sources, from satellites beaming back gigabytes of data to earth each day to remote sensors in internet of things devices providing a constant stream of poll data. Storing these data in a way such as to make it useable and compatible with other datasets requires significant time investing into management strategies to ensure usability of the data. Once acquired initial processing is performed to increase the usefulness of the data, extracting the useful features relevant for the current task, and adding metadata describing the information extracted for future reference, from here the data can be combined with other datasets to produce meaningful and useful results.
Big Earth Data as a problem space is too large to sensibly discuss with any form of structure. We have instead broken the problem space down into: storage, processing, visualization, management, and mining as the five primary problem areas.
3.1. Data storage
The storage issues of Big Earth Data are generally similar to those of any Big Data project, commonly referred to as the three Vs of Big Data (Gewirtz, Citation2018): volume, velocity, and variety (with the addition of two supplemental Vs Variety and Value to make 5). Data being gathered by Big Earth projects are growing in line with Moore’s law (Moore, Citation2006) to fill the available space. Riensel et al. (Citation2017) show this trend is likely to continue, with an expected 163 ZB (Zetabytes) of data being generated in 2025. This dramatic increase has largely been made possible due to the shift/evolution in computing from centralized datacenters of the 1980s, which were often underutilized and extremely expensive, to the more dynamic and responsive cloud computing systems utilize in modern data centers.
4. Basic concepts and technology
The increased use of distributed computing technologies and the growth of available cloud computing facilities (Assunção, Calheiros, Bianchi, Netto, & Buyya, Citation2015; Yang, Huang, Li, Liu, & Hu, Citation2017) have begun to address the core issues of distributing/sharing and processing the extremely large data sets involved in Big Earth Data projects (Munroe, Citation2017). At the same time large scale simplified processing technologies have been developed to enable realistic use of these distributed computing platforms. With HADOOP style open source projects (Fernández et al., Citation2014; Patel, Birla, & Nair, Citation2012) it is now feasible for independent researchers to manage Big Earth Data projects.
4.1. Data cubes
Data cubes are a way of representing large data sets over a common series, however, as Baumann points out (Baumann, Citation2017), there are issues with standardization of data cubes—currently no such standardization exists. Each layer of the cube is made up of a multidimensional array of cells with each cell containing the data (e.g. a data point, complex structure, data value, or even another data cube). These layers each represent the same measurement points for each cell, but modified by an external series (Technopedia, Citation2018).
While the lack of standardization can make it difficult to deal with even data sets where commonalities exist due to packaging order, representation, and axes. Metadata (Devillers et al., Citation2007) can be attached to data cubes to give information on how to understand, manage, and process the data within the cube. These data can be provided as purely Human readable formats or more ideally in automatically processable formats allowing cubes to be refactored by web services and data processing languages such as XSLT (W3C, Citation2017a). Ironically the lack of standardization applies to the metadata attached to data cubes as well and can lead to unnecessary confusion and difficulty in processing (Harinarayan, Rajaraman, & Ullman, Citation1996).
As part of the EarthServer2 (Earth Server, Citation2015), an attempt is being made to combine two common standards, i.e. XPATH (W3C, Citation2017b) and WCPS (Open Geospatial Consortium, Citation2009) into the new xWCPS (EarthServer, Citation2016) standard which hopefully addresses the issues associated with data cube, and data cube metadata standardization (Baumann, Citation2017).
4.2. Structured and unstructured data
Big Earth Data comes in structured and unstructured forms:
Instruments making regular-timed measurements, e.g. a temperature sensor may be structured due to regular and consistent timing of measurements combined with a known range of values (minimum and maximum temperatures).
Instruments that produce data at inconsistent times, locations, or contain other similarly unpredictable components are classed as unstructured data, e.g. an opportunistic sensor network tracking wildlife (inconsistent temporal and geolocation characteristics).
Instruments which produce data so varied that classification or organization into traditional models management system results in trivial gains to storage size (Buckler, Citation2015) would also be classed as unstructured. Examples of this would include satellite observation data (images) or traffic camera footage (video).
describes the characteristics of structured and unstructured data in terms of the core characteristics of the data, where the data can reasonably be stored, how processing and management can be implemented, and how solutions need to scale to manage that data.
Table 1. Comparison of structured and unstructured data types showing the key differences in storage and management techniques and tools required to process and analyze the data. Adapted from Taylor (Citation2018).
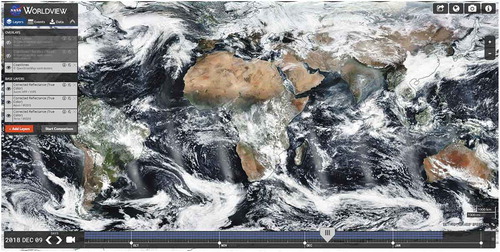
To aid in the understanding of these classifications we provide the following examples of structured data () and unstructured data ().
Figure 2. Visualization of route discovery on vector data showing multiple tree structures from local roots to end points, © GRASS Development Team, Citation2017.
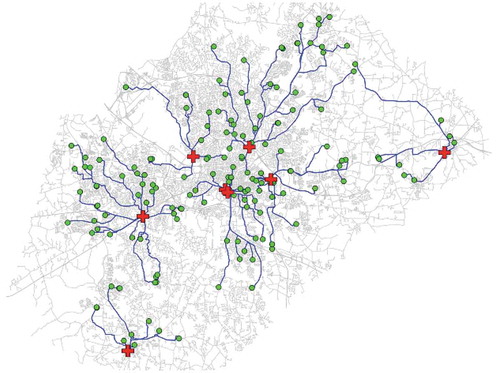
Figure 3. Visualization of color satellite images through NASA’s worldview platform, showing cloud layers over a geographic map (NASA, Citation2018a).
Both datatypes are generated in GIS systems, depending upon the methods used to gather the data: sources such as images from satellites, aeroplanes, and UAV create large repositories of unstructured data; while other sources such as GPS readings and Internet of things compatible sensors (e.g. metrological sensors) gather large quantities of structured data.
With both structured and unstructured data there is the potential for additional metadata that acts to introduce additional information about/associated with the original data allowing us to contextualize or understand the data better. While metadata can provide some structure or information about unstructured data we cannot realistically rely on this as metadata as it is often incomplete, missing, incoherent, wrong, or a combination of all of these.
4.2.1. Database management systems
As discussed above, the distinct characteristics of structured and unstructured data require different storage techniques, these can be broadly broken down into: (a) traditional relational database models, (b) NOSQL style alternative solutions including: key-value storage; graph databases; and document databases. As highlighted by Yang, Huang, Li, Liu, & Hu (Citation2016), the combination of SQL and NoSQL databases into a big data context (i.e. high scalability, fault tolerance, and availability) allow for the creation of Big Data specific cloud style platforms, e.g. Knowledge as a Service (KaaS).
Traditional relational databases with an SQL (W3C, Citation2018) (Structured Query Language) implementation for access and management are common. Examples of these include: Oracle (https://www.oracle.com/database/index.html); Rasdaman (http://www.rasdaman.com); and Microsoft SQL Server (https://www.microsoft.com/en-gb/sql-server).
Common examples of NoSQL implementations include: Redis (https://redis.io)—an in memory database, cache and messaging system; MongoDB (https://www.mongodb.com)—a document database; and HBase (https://hbase.apache.org/)—a key-value store running on the HADOOP File System (Saraladevi, Pazhaniraja, Paul, Basha, & Dhavachelvan, Citation2015) and utilizing Map-Reduce (Dean & Ghemawat, Citation2010). A brief comparison of the strengths and weaknesses of SQL and NoSQL databases is provided in .
Table 2. Comparison of the characteristics of No SQL databases and relational databases. Derived from Andres (Citation2017).
To obtain optimal performance the type of database selected must be suitable for the project. The AGDC (The Australian Geoscience Data Cube) project (Lewis et al., Citation2017) shows significant change to the database model from a fully relational database in version 1 to a combination minimalist relational database with NoSQL in version 2. This change facilitated the addition of multiple different sensor data types and integration of the associated metadata types into the project. The integration of the metadata presented a unique benefit/difficulty as the data were often bespoke to the dataset making storing it in a traditional relational database in a meaningful way challenging. The inherently bespoke nature of nonrelational databases means interaction with external datasets can be complicated by the unique data models and interactions involved in multiple data sets. This can be addressed by the effective use of metadata to identify the contents and structure of the data stored within; however, this is again hampered by the lack of standardization of metadata discussed earlier.
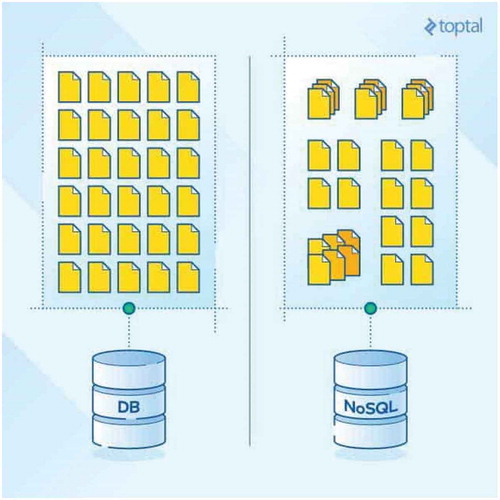
While optimal storage size is a key consideration of Big Earth Data, a more pressing issue comes in the form of access speed. Querying a relational database requires the assembling of data from multiple tables each requiring an additional processing to be performed by the server. illustrates the issues encountered when accessing large volumes of data in quick succession, the overhead of reassembling these records quickly adds up incurring a significant overhead which only increases as the data set gets larger. As nonrelational databases do not have these joins access times for individual records are faster and more suited to the mass processing performed in Big Earth Data analysis (Taylor, Citation2018). The nature of Big Earth Data sets is that they are nonrepetitive and largely unique and so cannot fully leverage the data dereplication inherent in an SQL database.
Figure 4. Image showing difference between structured and homogeneous file storage within a traditional database vs the unstructured and/or heterogeneous data implemented in NoSQL databases. © Andres, Citation2017.
Relational databases typically scale vertically—increasing the performance of the host machine to increase processing speed. Vertical scaling models are not ideal for handling very large datasets as processing large volumes of data quickly and efficiently require a large increase in the performance of the host machine, which then has to rely on significantly more expensive high performance parts, and may approach and reach a performance cap (Krishnaprasad, Citation2001). Nonrelational databases in contrast typically scale horizontally—they increase the number of resources working on the problem at once and distribute the load across multiple host machines. By distributing the load over an increased number of resources cheaper and more replaceable hardware can be utilized which makes horizontal scaling generally cheaper at the expense of increased infrastructure and management systems (VCloudNews, Citation2016). Utilizing this horizontal scaling model also allows the system to fit naturally into the dynamic, and adaptive cloud computing systems that exist to leverage large scale distributed computing projects.
Querying these databases and retrieving the data in a useable format is a huge task and requires matching the processing language to the appropriate platform. While there are many languages that exist to perform this task there are only two major standards that dictate how these languages operate: WCPS (Web Coverage Processing Service) (Open Geospatial Consortium, Citation2009) is used to control the retrieval of raster based data; XPATH (XML Path Language) (W3C, Citation2017b) is designed to control the retrieval of data stored in an XML format.
Currently with mixed data (such as images with an attached xml metadata file), neither solution is able to fully handle the problem, one solution maybe in the form of xWCPS (XPATH Enabled WCPS) (EarthServer, Citation2016), a new language which aims to combine the strengths of xPATH and WCPS into a single language eliminating the need for multiple languages.
4.3. Cloud storage systems
The increasing availability and reduced cost of cloud-based storage and processing has greatly aided the ability of researchers to analyze and process data (Assunção et al., Citation2015). While techniques and tools for large scale distributed computing have been around for decades the ability to dynamically and responsively acquire, utilize, and importantly release processing and storage power on demand has brought these systems to the forefront of large scale data storage and management. Cloud services are typically available as public, private and hybrid varieties based upon the security and budget of the organization. The key differences between localized storage solutions and cloud storage are summarized in .
Table 3. Comparison of the benefits of local data storage against cloud data storage in terms of speed, security, capacity, cost, and backup strategies. Adapted from Taylor (Citation2018).
Most projects turn to distributed cloud computing systems to handle issues such as temporary data storage and processing requirements. Software solutions such as Amazon S3 (https://aws.amazon.com/s3/) and Google file services (Ghemawat, Gobioff, & Leung, Citation2003). Distributed across many hardware elements, these packages offer a large, and expandable storage capacity, data redundancy and basic analytics functionality for the data. At current there are no specific cloud computing services aimed at Big Earth Data and the specific challenges of the Earth Science domain; however, general purpose cloud services are being built upon to create processing platforms that mirror and manage the data types, flow, and output that we expect.
Cloud computing platforms do introduce one major issue into our pipeline: vendor lock in. Each cloud platform requires its own management and processing functions be observed unless we build from raw hardware up, this can introduce significant issues with data migration (Ramachandran et al., Citation2018).
4.4. HADOOP FS and other distributed storage systems
There are many in use distributed file systems designed for big data problems. Typically, these file systems are specialized to provide storage for small files (or block data) while transitioning from a single machine paradigm to either network attached storage (StoneFly, Citation2018) or a storage area network (Sabeesh, Citation2017) paradigm (Park & Kim, Citation2018) while adding load balancing, copy consistency, and deduplication systems (Yang et al., Citation2017).
In 2003, Google published Google File System (GFS) which is a large-scale extensible distributed file system (Ghemawat et al., Citation2003) after Google put forward the GFS, Apache realized an open source implementation of GFS and launched its own project—Hadoop whose key storage technology is the Hadoop Distributed File System (HDFS) (Shvachko, Citation2010). Hadoop created a new way for massive Earth data storage and management, attributed to its high throughput of massive data, high performance distributed database and effective use of distributed and heterogeneous computing capacity.
4.5. State of the art
Pan & Zhang (Citation2012) put forward a Hadoop-based Earth Observation image processing system (HBRSIPS). The system redefines the storage structure to suit for the characteristics of remote sensing images and deploys the data processing algorithms in cloud computing environment. Cheng et al. presented an Earth data management system for massive Earth data based on HBase and GeoSOT (Wang, Cheng, Wu, Wu, & Teng, Citation2015). The basic idea of the system is splitting Earth Observation images into patches and storing them into HBase based on GeoSOT global discrete grid system and further processing the data in a distributed manner. George Vafiadis et al. proposed a Hadoop-based remote sensing image cloud storage model based on cloud computing framework (Vafiadis, Moulos, Sykas, Baglatzi, & Vohora, Citation2013). Its storage is a multilayer structure, supporting image processing and image data searching of various algorithms.
Examples of these kinds of specialized distributed file systems include:
Google Earth and Google Maps take advantage of GFS and BigTable (https://cloud.google.com/bigtable/) to manage the global Earth data.
Bing Maps store the Earth data based on the distributed cluster storage system and cloud computing platform of Microsoft’s data centers, where all the Earth data are structured using quad-tree tile layers (Beureuter, Citation2015).
ArcGIS Image Server is Esri’s solution for storing, analyzing, and serving massive collections of diverse Earth Observation imagery and raster geospatial data. It is designed to take advantage of the storage and computational power provided by the cloud with a new approach to distributed storage and distributed computation.
NASA’s utilizes Earth Observation System Data and Information System (EOSDIS) which is used to store and manage all the Earth data it gathers. EOSDIS follows a distributed and open storage architecture (NASA, Citation2018b), where data are stored in an extensible multilayer data format (Ramachandran et al., Citation2018).
While it is easy to highlight that the five Vs of big data will continue to give use trouble in the coming years (Hashem et al., Citation2015). It is also clear that the horizontal scaling models of NoSQL, HADOOP, and similar technologies address the scaling issue well in terms of storage capacity and capability (Pourabbas, Citation2014). The increasing capability to deploy the processing capability to the data in a structured layered model allows us to address scaling issues appropriately and well, and with modern containerized data centers (Diamanti, Citation2018). We can even address dynamic deployment of resources to areas of need.
4.6. Data processing
4.6.1. Distributed computing systems
Distributed computing is the concept of taking a computationally intensive task and breaking it into multiple tasks and distributing these tasks to multiple systems essentially turning a single large linear task into multiple smaller ones which can be processed in parallel speeding up execution times (Dean & Ghemawat, Citation2010; Lämmel, Citation2008). This concept is far from new and has been the core of multiuser computing systems since the 1960s, however, as tasks grow larger we need to move from manual parallelization of tasks to the automated application of processing to data, and them the subsequent aggregation and integration of that data.
To aid in this process many frameworks and paradigms have been created that work to reduce the complexity of parallelization while aiding in the automated management and control of task flows. The primary frameworks in use currently are HADOOP and its derivatives and the Apache suite (STORM, SPARK, SAMZA, FLINK).
4.6.2. Frameworks and paradigms
To execute these queries in a reasonable amount of time, distributed computing is needed to effectively share the workload across multiple computational resources. There are two different types of distributed computing frameworks, batch only frameworks like map reduce (Dean & Ghemawat, Citation2008), where events are processed as blocks for more efficiency with volume of tasks at the cost of immediate speed or stream-only frameworks such as Apache Storm (http://storm.apache.org) where events are processed on receipt which sacrifice efficiency to deliver more immediate individual results. Hybrid systems, such as Spark (https://spark.apache.org) and Flink (https://flink.apache.org), capable of operating in both modes as a hybrid system but require more in depth management to ensure the correct method is used for the correct situation.
The MapReduce (Dean & Ghemawat, Citation2010) framework which is designed for processing parallelizable problems across large datasets is a possible solution for this task. The MapReduce programming model is composed of a map function and a reduce function. The map function splits the input data into independent chunks which are distributed to available computational resources and processed in a completely parallel manner. The reduce function is responsible for collecting all of these individual results into the final query result which is then provided as an output to the user (IBM, Citation2018). This divide and conquer solution effectively reduces the waiting time between submitting a query and receiving a response. Benefitting from the high efficiency of distributed computing solutions, analysts can effectively access to systems, which can process queries at a reasonable pace, without incurring a prohibitively expensive cost.
Indexing and searching of data is now handled by frameworks such as Hadoop (Patel et al., Citation2012), Spark, and Flink. These packages handle data storage, and distributed processing, as well as effectively managing the indexing of the data. Indexing significantly speeds up the retrieval of data by creating a list of where things are within the dataset as queries are run. As the index builds up, it gains Knowledge about what data are stored where, effectively skipping/reducing the processing requirement for the search phase, retrieving the relevant data from the indexed location. This system is not without its problems though, large datasets themselves can generate indexes of vast sizes requiring their own storage management solutions, reassembly of the indexed data added an overhead in terms of processing, with transition speeds between nodes becoming a significant limiting factor in processing speeds, finally keeping the index up to date requires either sharing changes to the dataset across the whole system or risk inaccurate links within the database. Each of these frameworks has benefits and flaws under specific datasets and so the choice of frameworks needs to be calibrated against the dataset in use for optimal performance (Inoubli, Aridhi, Mezni, Maddouri, & Nguifo, Citation2018).
4.6.3. Cloud processing systems
EarthServer is one of the major systems used for Big Earth Data analysis. In 2015, the second iteration of the EarthServer project was launched (Earth Server, Citation2015) to expand the functionality of the original EarthServer project. Baumann et al. (Citation2016) outline the improvements EarthServer 2 aims to bring over the original project. A lot of this is just expanding the project to increase capacity, but most interestingly is the push for the creation and implementation of standards for Big Earth Data storage, processing, and retrieval. Given the success of the first project, the results of EarthServer 2 will likely have a significant impact on how Big Earth Data is processed.
The ArcGIS platform (http://desktop.arcgis.com/en/) is another major visualization tool facilitating the construction of visualizations in addition to the analysis, management, and sharing of GIS data. ARCGIS represents a complete system for GIS analysis using visual models and scripting to combine outputs from multiple processing tools automating workflows, increasing the effectiveness of the GIS researcher. Unlike most other platforms ARCGIS attempts to address the researcher familiarity, query complexity, and feedback issues discussed below through the provision of a Unix style program integration visual programming language.
For researchers on a smaller budget, open source solutions exist to the Big Data puzzle. QGIS (https://qgis.org/en/site/) while not as visually impressive as the commercial projects identified above, has all the features a GIS researcher needs—data input, management, analysis, and visualization as well as the capability to add modules in Python. Due to its open source nature, QGIS can be added to by any researcher in an open manner through add-on modules as well as editing core functionality to fit their needs and (in the spirit of open source software) feed these improvements back into the software.
4.6.4. Complexity in language
Most of the existing tools for data processing introduce a level of complexity to the process—they often utilize SQL (Structured Query Language) like languages to produce queries over data. When it comes to using these queries, the process is a little more complex—all require the understanding of an SQL like language which, due to the lack of standards, varies widely in their implementation from standardized SQL. The actual processing of these queries also leaves a lot to be desired with most implementations lacking many basic text editing functions and providing bad support and feedback for query design and execution (Kong, Zhang, & Stonebraker, Citation2015).
Most packages simply implement a text window into which a query is entered, and no feedback is given when queries fail. While there are many parsing tools for SQL and similar languages it is often more useful to see where something has failed rather than simply that it has.
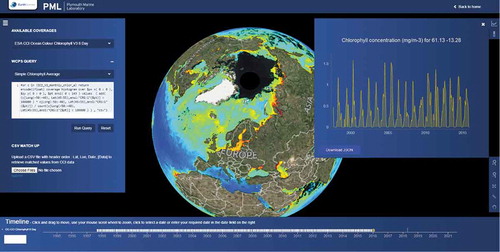
Plymouth Marine Laboratory (http://earthserver.pml.ac.uk/www) provides an example implementation of EarthServer technologies, which provides visualizations, , relating to various sets of ocean data. The example query highlights two significant problems with the current system. Firstly, there is a significant amount of complexity within the query making it difficult to follow exactly what it is doing. Individuals unfamiliar with WCPS will have significant trouble getting the desired output from the system. Second, as with most packages of this type, when a query is entered incorrectly, no feedback is provided to the user, in this case infinitely hanging at the processing query stage, never progressing, and never informing the user there is a problem.
Figure 5. Sample EarthServer implementation from Plymouth Marine Laboratory (http://earthserver.pml.ac.uk/www) showing chlorophyll concentrations within oceans and the WCPS query to generate this output.
Modern IDE’s (Integrated Development Environment), such as Visual Studio 2018 (https://visualstudio.microsoft.com) and NetBeans (https://netbeans.org) or text editors such as notepad++ (https://notepad-plus-plus.org) have implemented systems familiar to users of word processors to highlight problems to users, but even without this most software packages will at least return an error code when a query fails, while implementing the systems of mainstream software development environments may be a bit of a stretch, providing the user an error code would at least mean it could be looked up in the manual.
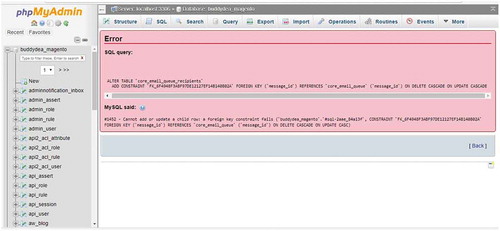
Another significant challenge in complex programming comes from fixing problems in algorithms and queries, traditional DBMS such as phpMyAdmin and PostgreSQL provide basic error messages (see ) but these are often cryptic and to a novice user can be of no help at all in solving the problem. As visual programming systems are designed to lower the skill requirement for implementing GIS queries, reducing the probability for mistakes to be made, by not allowing incorrect data types to be entered or preventing modules from being connected to incompatible ones, however no system is fool proof and therefore care must be paid to ensure these error messages are able to be processed by novice users (Munson & Schilling, Citation2016). Plain English instructions effectively communicate the problem to novice user better than the error codes traditionally used in software development (usually acceptable due to these not reaching the end user), though both allow the user to utilize the internet to find resources which may be helpful to their problem.
Figure 6. Example SQL error message generated by phpMyAdmin showing the lack of user focused feedback on error conditions.
4.6.5. Approximate query processing
One of the largest challenges for data visualization is the processing of the data, which is a computationally intensive process taking a significant amount of time to complete due to size of the data. This processing time is undesirable as it reduces productivity and even small interruptions have been shown to have a significant impact on an analyst’s performance (Adamczyk & Bailey, Citation2004).
Approximate query processing is the idea that we can speed up the processing of a query by approximating its output from a subsample of data (Fisher, Popov, Drucker, & Schraefel, Citation2012; Moritz, Fisher, Ding, & Wang, Citation2017). When applied correctly, AQP performed via subsampling of data can produce results accurate enough to make reasonable decisions (displaying the confidence of certainty the final result will be similar to this output ) without the need for full processing of the query.
Figure 7. Example of AQP rendering of data (left) against the complete data rendering (right). Taken from Figure 7 (Moritz et al., Citation2017).
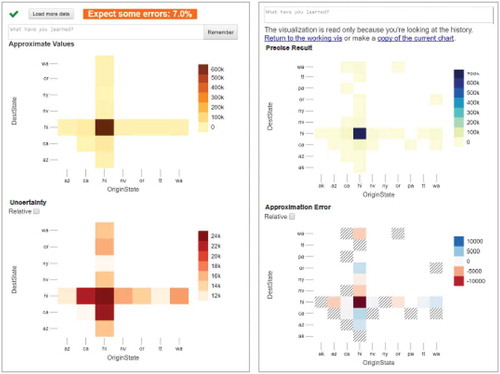
In any AQP process, it is still important to run the full query, while for most data providing the subsampling are appropriate the full query will resemble a more accurate version of the AQP query this is always an approximation not a guarantee, as such there exist cases where the full query will not be reflected in the subsampled query. Consider Simpsons paradox as an example of this, the subsampled data show one thing while the fully sampled data show the inverse (Wagner, Citation1982). AQP certainly shows potential to allow predictive visualization of Big Earth Data; however, a practical implementation of this has yet to surface.
4.6.5.1. Workflow concerns
Implementing new systems and workflows is not as easy as it first appears. Bad updates often face public backlash, recent Snapchat (Constine, Citation2018) and Twitter (Titcomb, Citation2017) updates caused massive backlash from the user base, resulting in users switching to competing services. While these are high profile examples, they do illustrate how easy it is to alienate a user base when decisions about a piece of software’s usability are taken without due consideration. On the flip side software updates can have a positive response, The ribbon interaction system (Microsoft, Citation2007) has standardized the controls between many core office applications and beyond on the windows operating system, increasing usability by removing the confusing cluster of icons and menus previously used.
This is not to say that the change was easy, a review by Toms Hardware (https://www.tomshardware.co.uk) (Yam, Citation2011) showed initial productivity was hampered due to unfamiliarity with the system despite evidence to the contrary (Neagu, Citation2017) that the systems were mechanically more efficient. This suggests that there is more to consider than the mechanical effectiveness of a UI (user interface) when implementing it, usability is key, and while changes may be technically more efficient, disrupting the established mental models of the user will certainly cause difficulties at least in the short term (Brown, Citation1998).
4.7. Data visualization
4.7.1. Basic concepts and technology
Data visualizers commonly perform two distinct roles. The first is the processing of data into a useable form, detecting desired features, and removing unwanted ones. This is achieved by utilizing a suite of feature selection (e.g. removing attributes and range checks) and pattern recognition algorithms (e.g. data cleaning techniques, normalization, and subsampling) within the environment. Secondly, visualizers produce graphs, images, and plots used to convey the data to the analysist. This can be as simple as producing a common graph or chart from data values or creating more complex outputs, such as raster images or vector plots of the data. Tools are also provided to assist with the extraction of information such as area/shape detection algorithms, and filters such as variance filter for edge detection and Fourier transform. Each different package however will provide unique features depending upon its purpose and the constraints under which it operates.
4.7.1.1. Visual queries
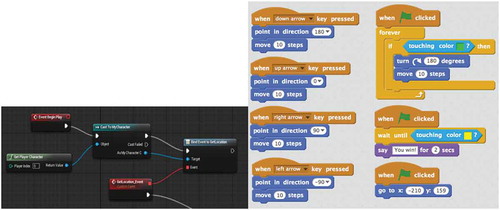
An alternative does exist however, visual programming systems such as Scratch (https://scratch.mit.edu), Kodu (https://www.kodugamelab.com), and the Blueprints system (https://docs.unrealengine.com/en-us/Engine/Blueprints) from the unreal game development engine, do address some of the issues raised here. By using simple drag and drop systems, these applications remove the need to learn a complex programming language such as C++, C#, or Java (illustrated in ). They also reduce the chance of making simple mistakes such as typos by removing the need to enter anything into the system other than the parameters which drive the query. Liu et al. (Citation2017) proved this concept with the grid workflow system, which shows a drag and drop system is possible however its effectiveness had not been fully tested.
Through the implementation of a visual query language, it may be possible to utilize these systems to remove the need to learn a language or provide a wrapper to make these systems language neutral removing the need to learn multiple languages (Costagliola, Tortora, Orefice, & de Lucia, Citation1995).
Figure 8. Unreal Engine Blueprint (left) showing a nodal approach to visual programming languages, and Scratch (right) showing an event-driven flow-based system for visual programming.
Whether ultimately implementing a system such as this would actually prove to be more work that upgrading the text input to the standard of a modern IDE, it certainly has the potential to greatly improve the usability of these tools and reduce the skill level required for their usage.
4.7.2. State of the art
Most common tools for big data analysis such as Zoomdata (https://www.zoomdata.com) Tableu (https://www.tableau.com), and Plotly (https://plot.ly), are of some use to Big Earth Data analysis, however, to get the most out of the data, particularly for Earth visualizations, specialist tools are required for visualizing raster and vector data such as ArcGIS (), GRASS GIS (https://grass.osgeo.org), and Mapbox (https://www.mapbox.com). While these tools can perform the task, they certainly fall behind the more mainstream big data analytics tools when it comes to usability (Haklay & Jones, Citation2008; Komarkova, Sedlak, Habrman, & Cermakova, Citation2017) likely due to the smaller target audience as a specialist application. There is still room to improve the usability of these tools and bring them up to a higher quality standard.
NASA provides serval public visualization tools for viewing satellite data Worldview (https://worldview.earthdata.nasa.gov) and Giovanni (https://giovanni.gsfc.nasa.gov/giovanni). Worldview provides a major source of geographic visualization to individuals. This data has been obtained from a wide variety of different satellite scans produced by NASA and its partners over the last 18 years. Its primary purpose is to show “The entire Earth as it looks ‘right now’.” This said it is not an analytical tool, providing few ways to manipulate the data and only simple visualizations. Giovanni offers more complexity in terms of allowing data filtering and plotting, animation and many different plot types. Neither tool allows the importation of other data sets.
4.7.3. Future research
Looking to the future, the rise of AR (Augmented Reality) and VR (Virtual Reality) technologies have seen widespread adoption in the fields of architecture and engineering (Joyce, Citation2017; Quirk, Citation2017), data visualization is likely to follow soon (Donalek et al., Citation2014; Tarolli, Citation2017). These technologies show the potential to have a significant impact on data discovery, allowing new and novel interactions to aid with the task (Olshannikova, Ometov, Koucheryavy, & Olsson, Citation2015). What is critical however is the need to overcome the traditional issues related to the visualization of volumes angles and curves (Evergreen, Citation2016) which VR and AR aim to exploit.
4.7.3.1. Virtual and augmented reality
The future of virtual reality is always uncertain, every new iteration improves the technology slightly and yet, so far none have managed to achieve true mainstream penetration. Films like Minority Report (Spielberg, Citation2002) have been promising the widespread distribution AR and VR systems into modern life and yet this future has yet to materialize. Mainly this is due to these systems over promising (Drummond et al., Citation2014) and largely failing to deliver on this promise.
The desire for VR systems is largely to do with removing the limitations of current interaction methodologies (Garbaya et al., Citation2014), while traditional desktop displays can produce pseudo-3D images, but with the addition of stereo-3D effects object recognition and perception can be improved (Bennet, Citation2006). Also while traditional interaction technologies (such as keyboard and mouse, trackballs, etc.) perform adequately, they are not what would be considered natural interaction methods, and the potential exists for gesture-based systems being able to improve on these methods (Nielsen, Störring, Moeslund, & Granum, Citation2003).
However, the current generation of hardware may be due to buck the trend both the Oculus rift (https://www.oculus.com) and the HTC Vive (https://www.vive.com/uk) seem to being going strong, with both entering a new hardware iteration soon, and attracting significant investment and support from blue-chip companies, particularly from engineering and architecture firms (Joyce, Citation2017; Rotella, Citation2018) who are already taking advantage that the novel visualizations the hardware provides. While this does not represent a significant investment by these firms, who spend tens of thousands of ponds every year on infrastructure, it does show that the technology is beginning to permeate industry and a desire to utilize the technology, beyond a gaming setting is present.
4.7.3.2. Adoption
Both AR/VR and gesture control systems are currently seeing a round of strong commercial development. Many competing products exist in the VR field (HTC Corporation, Citation2018; Oculus, Citation2018) and commercial AR technologies (Microsoft, Citation2018) are on the horizon. However, previous technologies have shown that distribution of a technology and getting mainstream penetration is a challenging task. Generally, only products which provide a major quality of life boost (such as smart phones) (Hall & Khan, Citation2003) survive long enough to become more than a flash in the pan novelty. VR and AR represent the potential for real opportunities and challenges in visual analytics, being able to render and manipulate 3D visualizations in real-world space in front of a user. They may completely change the way we think about visualizations maybe reversing some of the currently known facts about visualization relating to the perception of volume curves and angles (Evergreen, Citation2016), ushering in a new wave of visualization technologies enhancing data usefulness and communication in ways we have never experienced before.
4.7.3.3. Gesture control
As well as new visualization methods, potentially gesture control systems such as the leap motion (https://www.leapmotion.com) could provide an innovative leap similar to that produced by the mouse in the late 1990s, due to the ability to produce a near infinite number of gestures assigned to a unique amount of functions, not to mention the ability to assign natural motion to actual tasks such as picking up and manipulating objects or graphs. Research into gesture control and its effect is still ongoing (Malizia & Bellucci, Citation2012). Primarily researching into the design of gesture control systems and the mechanics of usage of gestures, however a shortage of research exists to demonstrate its effect on data visualization and its effect on visualization confidence.
4.8. Data processing
Due to the large volumes of data being generated in Earth Science/Earth Observation fields it is an obvious step to take to attempt to apply machine learning techniques to the data that we have in order to produce new insights and new metadata JIN (Jin, Wah, Cheng, & Wang, Citation2015). Multiple attempts have been made to produce a unified framework for Big Data analysis such as the work by Wu et al. (Citation2014), and to define the standards and future of the field (Fan and Bifet, Citation2013). The nature of the data, however, often adds an additional challenge to perform this meta-analysis due to the highly variable and unstructured nature of much of the data. Additional problems are typical of Big Data—scalability and parallelism. There are benefits to applying these techniques though as an example drawing from the Healthcare industry as an example, Herland, Khoshgoftaar, and Wald (Citation2014) and Yuan et al. (Citation2013) have shown that massive savings can be made by relying on machine learning rather than human analysis of data. There are many projects underway to approach these issues and make data mining of Big Data more feasible in addition to the frameworks we have looked at before, these include: NIMBLE (Ghoting, Kambadur, Pednault, & Kannan, Citation2011), BC-PDM (Yu et al., Citation2012), PEGASUS (Kang, Tsourakakis, & Faloutsos, Citation2009), and Graphlab (Low et al., Citation2012). Gandomi and Haider (Gandomi & Haider, Citation2015) provide an excellent overview of simple processing techniques.
Data mining techniques vary greatly in complexity, ranging from simple-rule-based systems up to complex neural networks, for a general overview it is likely best to consider a book such as Witten, Frank, Hall, & Pal, Citation2016, van der Aalst, Citation2018, or Han, Citation2017. We can consider most data mining techniques under the following categories:
Pattern Tracking
The simplest level of data mining is performing pattern analysis—that is looking at the data for general trends, e.g. spikes in traffic in coastal areas when the temperature rises (Giannotti, Nanni, Pinelli, & Pedreschi, Citation2007; Luigi, Oana, Mihai, & Simona, Citation2012).
Classification (DataminingTools Inc, Citation2018)
This involves the grouping of attributes and variables together in order to provide a simpler and aggregated view of a topic, i.e. we draw together factors of “town location” in order to determine its appeal as a holiday destination.
Association (Borne, Citation2014; Wesley, Citation2012)
Association is similar to pattern tracking, however, involves the tracking of highly correlated events. Natural disasters as an example often have many social and human factors that are associated with their destruction such as spikes in twitter traffic.
Anomaly/outlier Detection (Agrawal & Agrawal, Citation2015; Chandola & Kumar, Citation2016)
Anomalies and outliers are very important in data mining as they often define unusual events or tell us more about a pattern than we have seen normally. Changes in seasonal migrations or spikes in volcano characteristics might fall under this category. These also have an effect on technologies such as AQP where these outliers might make the subsampling error prone.
Clustering Analysis (OriginLab, Citation2018; SAS Institute, Citation2018a)
Clustering is a technique similar to classification but involves the grouping of specific sets of data based on characteristics. From this we can then derive large amounts of metadata about groups based on their shared characteristics that may be missed in a simple classification.
Regression Analysis (Luigi et al., Citation2012; Michael, Citation2013)
Regression is typically used for planning and modelling in that they attempt to derive the value or likelihood of a variable or characteristic given the presence of other known attributes. This can be useful in some situations where there is a consistency in performance, however, can also be utilized to disprove these kinds of simple relationships such as the geyser spouting at Yellow Stone National Park.
Prediction (Chou, Li, Chen, & Wu, Citation2010; Grzymala-Busse, Citation2005)
Prediction is often the most valuable of data mining techniques—the ability to predict the future with some certainty allows us to act and make choices with knowledge. Weather forecasting is a good example of this field.
4.8.1. State of the art
The largest competitor within the large-scale data processing field is IBM SAS (https://www.sas.com/en_us/home.html), SPSS Statistics (https://www.ibm.com/uk-en/products/spss-statistics), RapidMiner (https://rapidminer.com/), SAP Predictive Analytics (https://www.sap.com/uk/products/predictive-analytics.html), and InfoSphere (https://www.ibm.com/analytics/information-server), though competitors are moving into the field in terms of Amazon Machine Learning, Microsoft Neural Designer, JASP, R, and many others.
While a diversion from the major topic of this paper, there are many data processing trends and management technologies (Al-Jarrah, Yoo, Muhaidat, Karagiannidis, & Taha, Citation2015; Jordan & Mitchell, Citation2015) that are worth mentioning as topics for further reading including: machine learning (SAS Institute, Citation2018b; Suthaharan, Citation2014); reinforcement learning (Qiu, Wu, Ding, Xu, & Feng, Citation2016; Zhou, Pan, Wang, & Vasilakos, Citation2017); probabilistic learning (Ghahramani, Citation2015); and Big Data mining (IBM, Zikopoulos & Eaton, Citation2011).
4.8.2. Future developments
It is clear from current trends that there are going to be a large number of competitors in this field. The primary motivators seem to be toward integration and analysis (one size fits all) solutions such as SPSS and a secondary drive toward analytical platforms that can be tailored toward specific ends (the R programming language).
5. Future research and support
5.1. CASEarth
CASEarth is a Big Earth Data project launched recently by the CAS (Chinese Academy Science), Guo (Citation2017) outlines the primary objective for CASEarth to establish an international center for Big Earth Data science, which will have three main aims, to develop the world’s leading Big Earth Data infrastructure, a world class Big Earth Data platform and construct a decision support system. This seems to suggest the project will not only address the physical issues affecting Big Earth Data, particularly the bottlenecking issues with distribution and processing of data but aims to establish support for the analysis of data and collaboration between disciplines. Overall the project aims to produce an international center for Big Earth Data collaborating a wide range of institutions and projects to produce a world-leading platform and toolset for the analysis of Big Earth Data.
One of the key aspects of the CASEarth project is its integration with government systems which will provide live feedback from a wide range of usage scenarios to inform tool design. Hopefully, this should have a significant impact on the usability of these tools as the project progresses reacting to feedback and hopefully see some of the mainstream usability features integrated into the program, significantly improving their usability and hopefully creating a blueprint for tool development for Big Earth Data visualization.
On 15 January 2019, Chinese Academy of Sciences (CAS) published the Big Earth Data sharing service platform. This platform provides systematic, multivariate, dynamic, continuous, and standardized Big Earth Data in a shared fashion, and promotes the formation of the new sharing mode of Earth Science data by building an integrated data sharing system where data, computing and service are involved. At present, the platform shares about 5 PB data, including 1.8 PB Earth Observation data, 2.6 PB biological and ecological data, 0.4 PB atmospheric and ocean data, and 0.2 PB fundamental geographical data. With the improvement of the hardware infrastructure, the platform will share more data successively, and update the data in a speed of 3 PB per year.
The most important components of the Big Earth Data sharing service platform include two core systems, i.e. data sharing and storage system and CASEarth Databank system, and one regional system, i.e. digital silk road Big Earth Data system. The data sharing and storage system is the window dedicated for resource publishing and sharing service of Big Earth Data. CASEarth Databank system offers instantly accessed long-temporal multiresource Earth Observation data to users all over the world. The digital silk road Big Earth Data system mainly involves a number of thematic data sets for regional resource, environment, climate, disaster, and heritage of the Belt and Road initiative.
6. Conclusions
Having analyzed the present and future technologies of Big Earth Data visualization analysis, it is clear that the volume, variety, and veracity of Earth data being collected about the world we live in is growing rapidly and we are only just beginning to scratch the surface of what we can do with this data. Significant challenges remain in storing and processing this data however head roads are beginning to be made into these issues. However, the visualization analytics tools are still technical and complex systems which have yet to take advantage of the advance in human computer interaction (HCI) over the past 20 years and with interaction technologies on the horizon. We need to urgently review these technologies to bring them up to date with other advances in the field, growth in this field shows no sign of slowing down and we must grow our visualization tools if we hope to keep up.
Data availability statement
Data sharing is not applicable to this article as no new data were created or analysed in this study.
Disclosure statement
No potential conflict of interest was reported by the authors.
References
- Adamczyk, P. D., & Bailey, B. P. (2004). If not now, when?: The effects of interruption at different moments within task execution (pp. 271–278). ACM Press. doi:10.1145/985692.985727
- Agrawal, S., & Agrawal, J. (2015). Survey on anomaly detection using data mining techniques. Procedia Computer Science, 60, 708–713.
- Al-Jarrah, O. Y., Yoo, P. D., Muhaidat, S., Karagiannidis, G. K., & Taha, K. (2015). Efficient machine learning for big data: A review. Big Data Research, 2(3), 87–93.
- Andres, C. (2017, April 20). NoSQL database: The definitive guide to NoSQL databases. Retrieved from https://blog.pandorafms.org/nosql-databases-the-definitive-guide/
- Assunção, M. D., Calheiros, R. N., Bianchi, S., Netto, M. A. S., & Buyya, R. (2015). Big Data computing and clouds: Trends and future directions. Journal of Parallel and Distributed Computing, 79–80, 3–15.
- Batini, C., Blaschke, T., Lang, S., Albrecht, F., Abdulmutalib, H. M., Barsi, Á., … Kugler, Z. (2017). Data quality in remote sensing. ISPRS - International Archives of the Photogrammetry, Remote Sensing and Spatial Information Sciences, XLII-2/W7, 447–453.
- Baumann, P. (2017). Standardizing big earth datacubes (pp. 67–73). IEEE. doi:10.1109/BigData.2017.8257912
- Baumann, P., Mazzetti, P., Ungar, J., Barbera, R., Barboni, D., Beccati, A., … Wagner, S. (2016). Big data analytics for earth sciences: The EarthServer approach. International Journal of Digital Earth, 9(1), 3–29.
- Bennet, D. J. (2006). A stereo advantage in generalizing over changes in viewpoint on object recognition tasks. Perception and Psychophysics, 12, 1082–1093.
- Beureuter, P. S. (2015). Quadtree-based real-time point generalisation for web and mobile mapping. Retrieved from https://www.geo.uzh.ch/dam/jcr:2d048771-fb28-4612-a228-c7628d74be51/Bereuter-2015-PhD-Thesis.pdf
- Borne, K. (2014, April 28). Association rule mining – not your typical data science algorithm | MapR. Retrieved from https://mapr.com/blog/association-rule-mining-not-your-typical-data-science-algorithm/
- Bresciani, S., & Eppler, M. J. (2018). The risks of visualization: A classification of disadvantages associated with graphic representations of information. In P. J. Schulz, U. Hartung, & S. Keller (Eds.), Identität und Vielfalt der Kommunikations-wissenschaf (pp. 52–65). Konstanz: UVK Verlagsgesellschaft mbH.
- Brown, C. M. (1998). Human-computer interface design guidelines. Exeter, UK: Intellect Books.
- Buckler, C. (2015, September 23). SQL vs NoSQL: How to choose. Retrieved from https://www.sitepoint.com/sql-vs-nosql-choose/
- Chandola, V., & Kumar, V. (2016). Outlier and anomaly detection. Retrieved from https://www.kdd.org/kdd2016/topics/view/outlier-and-anomaly-detection
- Chen, M., Mao, S., & Liu, Y. (2014). Big data: A survey. Mobile Networks and Applications, 19(2), 171–209.
- Chi, M., Plaza, A., Benediktsson, J. A., Sun, Z., Shen, J., & Zhu, Y. (2016). Big data for remote sensing: Challenges and opportunities. Proceedings of the IEEE, 104(11), 2207–2219.
- Chou, P.-H., Li, P.-H., Chen, -K.-K., & Wu, M.-J. (2010). Integrating web mining and neural network for personalized e-commerce automatic service - Semantic scholar. Retrieved from https://www.semanticscholar.org/paper/Integrating-web-mining-and-neural-network-for-Chou-Li/ec2c44280b76f2ce01e287e3811c38ea9f0400e7
- Constine, J. (2018, January 12). Snapchat’s big redesign bashed in 83% of user reviews. Retrieved from http://social.techcrunch.com/2018/01/11/snapchat-redesign-uninstall/
- Costagliola, G., Tortora, G., Orefice, S., & de Lucia, A. (1995). Automatic generation of visual programming environments. Computer, 28(3), 56–66.
- DataminingTools Inc. (2018, August). Data mining: Classification and analysis. Technology. Retrieved from https://www.slideshare.net/dataminingtools/data-mining-classification-and-analysis
- Dean, J., & Ghemawat, S. (2008). MapReduce: Simplified data processing on large clusters. Communications of the ACM, 51(1), 107–113.
- Dean, J., & Ghemawat, S. (2010). MapReduce: A flexible data processing tool. Communications of the ACM, 53(1), 72–77.
- Devillers, R., Bédard, Y., Gervais, M., Jeansoulin, R., Pinet, F., Schneider, M., & Bejaoui, L. (2007). How to improve geospatial data usability: From metadata to quality-aware GIS community . Photogrammetric Engineering and Remote Sensing, 71(2), 205–215.
- Diamanti, M. B. (2018, June 8). How containers are changing the dynamics for data centers. Retrieved from https://www.datacenterdynamics.com/opinions/how-containers-are-changing-the-dynamics-for-data-centers/
- Donalek, C., Djorgovski, S. G., Cioc, A., Wang, A., Zhang, J., Lawler, E., … Longo, G. (2014). Immersive and collaborative data visualization using virtual reality platforms (pp. 609–614). IEEE. doi:10.1109/BigData.2014.7004282
- Drummond, K., Hamburger, E., Houston, T., Irvine, T., Tieu, U., Lai, R., & Zelenko, M. (2014, August 25). The rise and fall and rise of virtual reality. Retrieved from https://www.theverge.com/a/virtual-reality
- Earth Server. (2015, May 1). EarthServer 2 | EarthServer.eu. Retrieved from http://www.earthserver.eu/about
- EarthServer. (2016, February 12). xWCPS 2.0 language definition | EarthServer.eu. Retrieved from http://www.earthserver.eu/xwcps_documentation
- EO-MINERS. (2018). EOM - Earth observation - Introduction. Retrieved from http://www.eo-miners.eu/earth_observation/eo_introduction.htm
- Evergreen, S. D. H. (2016). Effective data visualization: The right chart for the right data. Thousand Oaks, CA: SAGE Publications.
- Fan, W., & Bifet, A. (2013). Mining big data: Current status, and forecast to the future. SIGKDD Explorations Newsletter, 14(2), 1–5.
- Fernández, A., Del Río, S., López, V., Bawakid, A., Del Jesus, M. J., Benítez, J. M., & Herrera, F. (2014). Big Data with cloud computing: An insight on the computing environment, MapReduce, and programming frameworks: Big data with cloud computing. Wiley Interdisciplinary Reviews: Data Mining and Knowledge Discovery, 4(5), 380–409.
- Fisher, D., Popov, I., Drucker, S., & Schraefel, M. C. (2012). Trust me, I’m partially right: Incremental visualization lets analysts explore large datasets faster. In Proceedings of the SIGCHI conference on human factors in computing systems (pp. 1673–1682). New York, NY: ACM. doi:10.1145/2207676.2208294
- Gandomi, A., & Haider, M. (2015). Beyond the hype: Big data concepts, methods, and analytics. International Journal of Information Management, 35(2), 137–144.
- Gantz, J., & Reinsel, D. (2012). The digital universe in 2020: Big data, bigger digital shadows, and biggest growth in the far east. Framingham, MA: International Data Corporation.
- Garbaya, S., Miraoui, C., Wendrich, R., Lim, T., Stanescu, I., & Hauge, J. (2014). Sensorial virtualization: Coupling gaming and virtual environment. Journal of Advanced Distributed Learning Technology JADLeT, 2(5), 16–30.
- Gewirtz, D. (2018, March 21). Volume, velocity, and variety: Understanding the three V’s of big data. Retrieved from http://www.zdnet.com/article/volume-velocity-and-variety-understanding-the-three-vs-of-big-data/
- Ghahramani, Z. (2015). Probabilistic machine learning and artificial intelligence. Nature, 521(7553), 452–459.
- Ghemawat, S., Gobioff, H., & Leung, S.-T. (2003). The google file system (p. 29). ACM Press. doi:10.1145/945449.945450
- Ghoting, A., Kambadur, P., Pednault, E., & Kannan, R. (2011). NIMBLE: A toolkit for the implementation of parallel data mining and machine learning algorithms on Mapreduce. In Proceedings of the 17th ACM SIGKDD international conference on knowledge discovery and data mining (pp. 334–342). New York, NY: ACM. doi:10.1145/2020408.2020464
- Giannotti, F., Nanni, M., Pinelli, F., & Pedreschi, D. (2007). Trajectory pattern mining. In Proceedings of the 13th ACM SIGKDD international conference on knowledge discovery and data mining (pp. 330–339). New York, NY: ACM. doi:10.1145/1281192.1281230
- GRASS Development Team. (2017). GRASS GIS - Vector support in GRASS GIS. Retrieved from https://grass.osgeo.org/screenshots/vector/
- Grzymala-Busse, J. W. (2005). Rule induction. In The data mining and knowledge discovery handbook. doi:10.1007/978-0-387-09823-4_13
- Guo, H. (2017). Big earth data: A new frontier in Earth and information sciences. Big Earth Data, 1(1–2), 4–20.
- Guo, H., Liu, Z., Jiang, H., Wang, C., Liu, J., & Liang, D. (2017). Big earth data: A new challenge and opportunity for digital earth’s development. International Journal of Digital Earth, 10(1), 1–12.
- Guo, H., Wang, L., Chen, F., & Liang, D. (2014). Scientific big data and digital earth. Chinese Science Bulletin, 59(35), 5066–5073.
- Haklay, M., & Jones, C. (2008). Usability and GIS – why your boss should buy you a larger monitor. Proceedings of AGI GeoCommunity '08, Stratford-upon-Avon, UK
- Hall, B. H., & Khan, B. (2003). Adoption of new technology (Working Paper No. 9730). National Bureau of Economic Research. doi:10.3386/w9730
- Han, J. (2017, August 1). Data mining: Concepts and techniques. Retrieved from https://www.bookdepository.com/Data-Mining-Concepts-and-Techniques-Jiawei-Han/9780123814791
- Harinarayan, V., Rajaraman, A., & Ullman, J. D. (1996). Implementing data cubes efficently. Retrieved from https://thodrek.github.io/CS839_spring18/papers/p205-harinarayan.pdf
- Hashem, I. A. T., Yaqoob, I., Anuar, N. B., Mokhtar, S., Gani, A., & Ullah Khan, S. (2015). The rise of “big data” on cloud computing: Review and open research issues. Information Systems, 47, 98–115.
- Herland, M., Khoshgoftaar, T., & Wald, R. (2014, December). A review of data mining using big data in health informatics. Retrieved from https://www.researchgate.net/publication/275484315_A_Review_of_Data_Mining_Using_Big_Data_in_Health_Informatics
- HTC Corporation. (2018, April 9). VIVETM | Discover virtual reality beyond imagination. Retrieved from https://www.vive.com/uk/
- IBM. (2018, April 24). What is MapReduce? | IBM analytics. Retrieved from https://www.ibm.com/analytics/hadoop/mapreduce
- IBM, Zikopoulos, P., & Eaton, C. (2011). Understanding big data: Analytics for enterprise class hadoop and streaming data (1st ed.). New York, NY: McGraw-Hill Osborne Media.
- Inoubli, W., Aridhi, S., Mezni, H., Maddouri, M., & Nguifo, E. (2018, August 27). A comparative study on streaming frameworks for Big Data (pp. 17–24). VLDB 2018 – 44th International Conference on Very Large Data Bases: Workshop LADaS – Latin American Data Science, Rio de Janeiro, Brazil.
- International Society for Digital Earth. (2017). Inauguration of big earth data. Retrieved from /news/824
- Jin, X., Wah, B. W., Cheng, X., & Wang, Y. (2015). Significance and challenges of big data research. Big Data Research, 2(2), 59–64.
- Jordan, M. I., & Mitchell, T. M. (2015). Machine learning: Trends, perspectives, and prospects. Science, 349(6245), 255–260.
- Joyce, K. (2017, December 23). Two-thirds of architectural visualisation professionals will use VR in 2018. Retrieved from https://www.vrfocus.com/2017/12/two-thirds-of-architectural-visualisation-professionals-will-use-vr-in-2018/
- Kang, U., Tsourakakis, C. E., & Faloutsos, C. (2009). PEGASUS: A peta-scale graph mining system implementation and observations. 2009 Ninth IEEE international conference on data mining (pp. 229–238). doi:10.1109/ICDM.2009.14
- Komarkova, J., Sedlak, P., Habrman, J., & Cermakova, I. (2017). Usability evaluation of web-based GIS by means of a model (pp. 191–197). IEEE. doi:10.1109/DT.2017.8024296
- Kong, N., Zhang, T., & Stonebraker, I. (2015). Evaluation of web GIS functionality in academic libraries. Applied Geography, 60, 288–293.
- Krishnaprasad, S. (2001). Uses and abuses of Amdahl’s law. Journal of Computing Sciences in Colleges, 17(2), 288–293.
- Lakshen, G. A., Vraneš, S., & Janev, V. (2016). Big data and quality: A literature review. 2016 24th telecommunications forum (TELFOR) (pp. 1–4). doi:10.1109/TELFOR.2016.7818902
- Lämmel, R. (2008). Google’s MapReduce programming model — Revisited. Science of Computer Programming, 70(1), 1–30.
- Lewis, A., Oliver, S., Lymburner, L., Evans, B., Wyborn, L., Mueller, N., … Wang, L.-W. (2017). The Australian geoscience data cube — foundations and lessons learned. Remote Sensing of Environment, 202, 276–292.
- Liu, J., Li, J., Li, W., & Wu, J. (2016). Rethinking big data: A review on the data quality and usage issues. ISPRS Journal of Photogrammetry and Remote Sensing, 115, 134–142.
- Liu, J., Liu, L., Xue, Y., Dong, J., Hu, Y., Hill, R., … Li, C. (2017). Grid workflow validation using ontology-based tacit knowledge: A case study for quantitative remote sensing applications. Computers & Geosciences, 98, 46–54.
- Low, Y., Bickson, D., Gonzalez, J., Guestrin, C., Kyrola, A., & Hellerstein, J. M. (2012). Distributed GraphLab: A framework for machine learning and data mining in the cloud. Proceedings of the VLDB Endowment, 5(8), 716–727.
- Luigi, D., Oana, S., Mihai, T., & Simona, V. (2012). The use of regression analysis in marketing research. Studies in Business and Economics, 7(2), 94–109.
- Mahdavi-Amiri, A., Alderson, T., & Samavati, F. (2015). A survey of digital earth. Computers & Graphics, 53, 95–117.
- Malizia, A., & Bellucci, A. (2012). The artificiality of natural user interfaces. Communications of the ACM, 55(3), 36.
- Michael. (2013, January 9). Regression analysis. Retrieved from http://michaelpawlicki.com/regression-analysis/
- Microsoft. (2007). Introducing the Windows ribbon framework (Windows). Retrieved from https://msdn.microsoft.com/en-us/library/windows/desktop/dd316910(v=vs.85).aspx
- Microsoft. (2018, April 9). Microsoft HoloLens. Retrieved from https://www.microsoft.com/en-gb/hololens
- Moore, G. E. (2006). Cramming more components onto integrated circuits. IEEE Solid-State Circuits Society Newsletter, 11(3), 33–35. Reprinted from Electronics, volume 38, number 8, April 19, 1965, pp.114 ff.
- Moritz, D., Fisher, D., Ding, B., & Wang, C. (2017). Trust, but verify: Optimistic visualizations of approximate queries for exploring big data. In Proceedings of the 2017 CHI conference on human factors in computing systems (pp. 2904–2915). New York, NY: ACM. doi:10.1145/3025453.3025456
- Munroe, R. (2017). FedEx bandwidth. Retrieved from https://what-if.xkcd.com/31/
- Munson, J. P., & Schilling, E. A. (2016). Analyzing novice programmers’ response to compiler error messages. Journal of Computing Sciences in Colleges, 31(3), 53–61.
- NASA. (2018a, March 31). Worldview: Explore your dynamic planet. Retrieved from https://worldview.earthdata.nasa.gov
- NASA. (2018b, November). Standards, requirements and references | Earthdata. Retrieved from https://earthdata.nasa.gov/user-resources/standards-and-references
- NASA. (2018c, November 29). Earth observation data | Earthdata. Retrieved from https://earthdata.nasa.gov/earth-observation-data
- Nativi, S., Mazzetti, P., Santoro, M., Papeschi, F., Craglia, M., & Ochiai, O. (2015). Big data challenges in building the global earth observation system of systems. Environmental Modelling & Software, 68, 1–26.
- Neagu, C. (2017, January 27). Comparison: Is the Windows ribbon interface more efficient than the old-school menus? Retrieved from https://www.digitalcitizen.life/windows-8-analysis-new-ribbon-interface-more-efficient
- Nielsen, M., Störring, M., Moeslund, T. B., & Granum, E. (2003). A procedure for developing intuitive and ergonomic gesture interfaces for HCI. In Gesture-based communication in human-computer interaction (pp. 409–420). Berlin, Heidelberg: Springer. doi:10.1007/978-3-540-24598-8_38
- Oculus, V. R. (2018, April 9). Oculus. Retrieved from https://www.oculus.com/
- Olshannikova, E., Ometov, A., Koucheryavy, Y., & Olsson, T. (2015). Visualizing big data with augmented and virtual reality: Challenges and research agenda. Journal of Big Data, 2(1). doi:10.1186/s40537-015-0031-2
- Open Geospatial Consortium. (2009, March 25). Web coverage processing service (WCPS) standard | OGC. Retrieved from http://www.opengeospatial.org/standards/wcps
- OriginLab. (2018, December 28). Help online - Tutorials - Cluster analysis. Retrieved from https://www.originlab.com/doc/Tutorials/Cluster-Analysis
- Pan, X., & Zhang, S. (2012). A remote sensing image cloud processing system based on Hadoop. In 2012 IEEE 2nd international conference on cloud computing and intelligence systems (Vol. 1, pp. 492–494). Piscataway, NJ: IEEE.
- Park, J. K., & Kim, J. (2018). Big data storage configuration and performance evaluation utilizing NDAS storage systems. AKCE International Journal of Graphs and Combinatorics, 15(2), 197–201.
- Patel, A. B., Birla, M., & Nair, U. (2012). Addressing big data problem using Hadoop and map reduce. 2012 Nirma University international conference on engineering (NUiCONE) (pp. 1–5). doi:10.1109/NUICONE.2012.6493198
- Philip Chen, C. L., & Zhang, C.-Y. (2014). Data-intensive applications, challenges, techniques and technologies: A survey on big data. Information Sciences, 275, 314–347.
- Pourabbas, E. (2014). Geographical information systems: Trends and technologies. Boca Raton, FL: CRC Press, Taylor and Francis Group.
- Qiu, J., Wu, Q., Ding, G., Xu, Y., & Feng, S. (2016). A survey of machine learning for big data processing. EURASIP Journal on Advances in Signal Processing, (2016(1), 67.
- Quirk, V. (2017, June 1). Disrupting reality: How VR is changing architecture’s present and future. Retrieved from http://www.metropolismag.com/architecture/disrupting-reality-how-vr-is-changing-architecture-present-future/
- Ramachandran, R., Lynnes, C., Baynes, K., Murphy, K., Baker, J., Kinney, J., & Smith, M. (2018). Recommendations to improve downloads of large earth observation data. Data Science Journal, 17, 2. Retrieved from https://doi.org/10.5334/dsj-2018-002
- Riensel, D., Gantz, J., & Rydning, J. (2017). Data age 2025: The evolution of data to life-critical don’t focus on big data. Framingham: IDC Analyze the Future. Retrieved from https://www.seagate.com/www-content/our-story/trends/files/Seagate-WP-DataAge2025-March-2017.pdf
- Rotella, J. (2018, February 7). 3 Ways multi-user VR will enhance the design work of the future. Retrieved from https://www.archdaily.com/888583/3-ways-multi-user-vr-will-enhance-the-design-work-of-the-future
- Sabeesh. (2017, October 24). 10 Gigabit ethernet: Enabling storage networking for big data. Retrieved from https://www.arista.com/en/solutions/hadoop-big-data-ip-storage-networks
- Saraladevi, B., Pazhaniraja, N., Paul, P. V., Basha, M. S. S., & Dhavachelvan, P. (2015). Big data and Hadoop-a study in security perspective. Procedia Computer Science, 50, 596–601.
- SAS Institute. (2018a, December 28). Cluster analysis. Retrieved from http://www.jmp.com/support/help/Cluster_Analysis.shtml
- SAS Institute. (2018b). Machine learning: What it is and why it matters. Retrieved from https://www.sas.com/en_gb/insights/analytics/machine-learning.html
- SAS Institute Inc. (2018, December 27). What is big data and why it matters. Retrieved from https://www.sas.com/en_gb/insights/big-data/what-is-big-data.html
- Shvachko, K. V. (2010). HDFS scalability: The limits to growth. Login:: the Magazine of USENIX & SAGE, 35(2(ABR)), 6–16.
- Soubra, D. (2012). The 3Vs that define big data. Retrieved from https://www.datasciencecentral.com/forum/topics/the-3vs-that-define-big-data
- Spielberg, S. (2002). Minority report. Glendale, CA: Dreamworks Studios.
- StoneFly. (2018, October 10). Network attached storage (NAS) for unstructured big data. Retrieved from https://stonefly.com/blog/network-attached-storage-nas-for-unstructured-big-data
- Suthaharan, S. (2014). Big data classification: Problems and challenges in network intrusion prediction with machine learning. SIGMETRICS Performance Evaluation Review, 41(4), 70–73.
- Tarolli, D. (2017, April 3). The next big thing in the GIS industry: 3D, AR and VR. Retrieved from https://www.geospatialworld.net/article/gis-3d-ar-and-vr/
- Taylor, C. (2018, March 28). Structured vs. Unstructured data - Datamation. Retrieved from https://www.datamation.com/big-data/structured-vs-unstructured-data.html
- Technopedia. (2018, December 27). What is a data cube? Retrieved from https://www.techopedia.com/definition/28530/data-cube
- Titcomb, J. (2017, June 15). Twitter gives itself a major redesign - and its users aren’t happy. The Telegraph. Retrieved from https://www.telegraph.co.uk/technology/2017/06/15/brace-twitter-giving-major-redesign/
- Vafiadis, G., Moulos, V., Sykas, D., Baglatzi, A., & Vohora, V. K. (2013). HmapS: HyperSpectral remote sensing image cloud storage for large scale semantic search and distributed computation. In Proceedings of a meeting held 20–24 October 2013, Bali, Indonesia (pp. 4152–4158). Red Hook, NY: Curran Associates, Inc.
- van der Aalst, W. M. P. (2018). Process mining: Data science in action (Softcover reprint of the original 2nd ed. 2016 edition). Place of publication not identified: Springer.
- van der Meer, F. (2018). International journal of applied earth observation and geoinformation. Retrieved from https://www.journals.elsevier.com/international-journal-of-applied-earth-observation-and-geoinformation/
- VCloudNews. (2016, December 5). Database scalability : Vertical scaling vs Horizontal scaling. Retrieved from http://www.vcloudnews.com/database-scalability-vertical-scaling-vs-horizontal-scaling/
- W3C. (2017a). XSL Transformations (XSLT) Version 3.0. Retrieved from https://www.w3.org/TR/2017/REC-xslt-30-20170608/
- W3C. (2017b, March 21). XML path language (XPath) 3.1. Retrieved from https://www.w3.org/TR/xpath-31/
- W3C. (2018, December 23). What is SQL. Retrieved from https://www.w3schools.com/whatis/whatis_sql.asp
- Wagner, C. H. (1982). Simpson’s paradox in real life. The American Statistician, 36(1), 46–48.
- Wang, L., Cheng, C., Wu, S., Wu, F., & Teng, W. (2015). Massive remote sensing image data management based on HBase and GeoSOT. 2015 IEEE international geoscience and remote sensing symposium (IGARSS) (pp. 4558–4561). doi:10.1109/IGARSS.2015.7326842
- Wesley. (2012, September 26). Association rule learning and the Apriori algorithm. Retrieved from https://www.r-bloggers.com/association-rule-learning-and-the-apriori-algorithm/
- Witten, I. H., Frank, E., Hall, M. A., & Pal, C. J. (2016). Data mining: Practical machine learning tools and techniques. Burlington, MA: Morgan Kaufmann.
- Wu, X., Zhu, X., Wu, G.-Q., & Ding, W. (2014). Data mining with big data. IEEE Transactions on Knowledge and Data Engineering, 26(1), 97–107.
- Yam, M. (2011, April 7). Microsoft to roll out ribbon again for Windows 8. Retrieved from https://www.tomshardware.com/news/windows8-win8-ribbon-ui-explorer,12525.html
- Yang, C., Huang, Q., Li, Z., Liu, K., & Hu, F. (2016, November). Big Data and cloud computing: Innovation opportunities and challenges. Retrieved from https://www.researchgate.net/publication/309696611_Big_Data_and_cloud_computing_innovation_opportunities_and_challenges
- Yang, C., Huang, Q., Li, Z., Liu, K., & Hu, F. (2017). Big Data and cloud computing: Innovation opportunities and challenges. International Journal of Digital Earth, 10(1), 13–53.
- Yu, L., Zheng, J., Shen, W. C., Wu, B., Wang, B., Qian, L., & Zhang, B. R. (2012). BC-PDM: Data mining, social network analysis and text mining system based on cloud computing. In Proceedings of the 18th ACM SIGKDD international conference on knowledge discovery and data mining (pp. 1496–1499). New York, NY: ACM. doi:10.1145/2339530.2339764
- Yuan, Q., Nsoesie, E. O., Lv, B., Peng, G., Chunara, R., & Brownstein, J. S. (2013, May 30). Monitoring influenza epidemics in China with search query from Baidu. Retrieved from https://journals.plos.org/plosone/article?id=10.1371/journal.pone.0064323
- Zhou, L., Pan, S., Wang, J., & Vasilakos, A. V. (2017). Machine learning on big data: Opportunities and challenges. Neurocomputing, 237, 350–361.