
 ?Mathematical formulae have been encoded as MathML and are displayed in this HTML version using MathJax in order to improve their display. Uncheck the box to turn MathJax off. This feature requires Javascript. Click on a formula to zoom.
ABSTRACT
The amount of zircon U-Pb geochronological data for China has grown rapidly in recent years. Nearly 410,000 items of zircon U-Pb geochronological data, representing more than 7,000 relevant articles in the Elsevier Science Database, have been collected to a database in this research. Statistics on the ages and absolute errors of these collated data, yielded smallest standard errors for (206Pb/238U), (207Pb/235U), and (207Pb/206Pb) ages within respective time intervals of < 1388.96 Ma, 1388.96–3282.52 Ma, and > 3282.52 Ma. The ages and their absolute errors were determined using three main geochronology methods, based on laser ablation inductively coupled mass spectrometer (LA-ICP-MS), sensitive high-resolution ion microprobe (SHRIMP), and secondary ion mass spectrometer (SIMS) measurements. We compared the influence of these different methods on errors for each age interval. In addition, using a Gaussian model of multi-peak fitting of zircon U-Pb age frequencies, we identified seven growth peaks in zircons from the Chinese continental crust, which are 48.60 Ma, 131.49 Ma, 249.91 Ma, 444.27 Ma, 835.95 Ma, 1860.65 Ma, and 2505.54 Ma. It is clear that there are correspondences between these ages and various geological events, namely, the Wutai movement, Lvliang movement, Jinning movement, Caledonian movement, Indo-China movement, Yanshan movement, and Himalayaorogeny movement, respectively. The time and spatial distributions of these zircons correspond to distinct geological events on the Chinese continent, reflecting its crustal evolution.
1. Introduction
Since the introduction of a “Digital Earth”, digitization of the Earth has undergone rapid progress, providing a new perspective from big datasets and meta-data, and greatly enhancing our understanding of the Earth. This digital information is even widely used outside the scope of scientific research, in people’s lives, bringing ease and convenience. Over the last 20 years, this “Digital Earth” has contributed to revolutionary advances in our knowledge of the Earth’s fluid layers and polar caps, surface systems, and its biosphere. However, data for the solid earth layer are very limited. This constitutes a strong imbalance in the study of the interaction between layers in Earth System science.
With the introduction of precision isotope dating instruments, such as Cameca’s Secondary Ion Mass Spectrometer (SIMS), the Sensitive High-Resolution Ion Microprobe (SHRIMP), and Laser ablation inductively coupled plasma mass spectrometer (LA-ICP-MS), the study of zircon U-Pb geochronology in China has been greatly enhanced, especially on the Chinese continent. These geochronological data have supported investigations in solid earth science. Isotope geochronology is not only a tool for dating geological material but also contributes on different scientific levels to Earth science and geodynamic research, as part of big data projects. Given that there are still technical problems associated with zircon U-Pb chronology, we hoped to explore these problems using the “big picture” obtained using big datasets. For example, according to current practice, young samples should employ the 206Pb/238U dating system, while older samples should adopt the 207Pb/206Pb system, but there is no specific age standard defining this threshold in the literature. Such thresholds can be calculated using big datasets (Puetz Stephen, Ganade Carlos, Udo, & Glenn, Citation2018). In addition, geochronological big data not only make geochronology more quantitative but also allow us to study geochronology from time, space, or higher dimensions, to obtain a greater understanding of geodynamics and Earth System science.
In the field of geochronology, researchers have always preferred to use the weighted age of zircon U-Pb-dated samples as the geological age. In fact, a single-grain zircon age itself is geologically significant. There is no essential difference between the measured and weighted average ages of samples, when both the accuracy and precision of the given method are sufficient. Typically, the weighted average age will weaken the age information of outliers. In addition, human bias is employed in the calculation of a weighted average age, while the single-grain zircon age retains complete objectivity. Therefore, we selected more than 410,000 items of single-particle zircon U-Pb chronological data for study, obtained from the Elsevier Science Database. Through statistical analysis of these data, we show relationships between zircon U-Pb ages and their absolute errors, reflecting the different dating techniques employed. We also apply Gaussian multi-peak fitting to the time distribution of the zircon age frequency to reveal the spatial distribution of peak data for the Chinese continent. Details of the relationships between zircon growth, samples, and geological events uncovered through such analysis will be explored in subsequent research.
2. Materials and methods
2.1. Geochronology databases
Two databases, namely a Chinese database and the Elsevier Database, house single-grain zircon U-Pb geochronological data for the Chinese continental crust. The Chinese database incorporates data from more than 4,000 Chinese journals and dissertations, covering to the end of 2017, accessed through the China National Knowledge Infrastructure (CNKI). The number of valid articles and data entries was 2,331 and 154,768, respectively.
The items studied in this paper are from the Elsevier Database, containing data derived from documents in the Elsevier Science academic database, Science Direct. The Elsevier_Database includes more than 7,000 articles for the period prior to 2017, including over 410,000 items of zircon U-Pb geochronological data.
The geochronological data within the Elsevier Database comprise seven major data categories: data number, element and isotope content, isotope ratio and error, experimental method, sample background, quality control, and other supplementary data. There are 40 secondary data categories (see for details). Although the data format for each document is slightly different, all documents were entered according to a unified standard, and most data entries were standardized. Inconsistencies in these data were dealt with, as follows:
Table 1. Description of the data categories listed under each item in our database.
Data number: In the data table of some documents, only the test numbers were listed in tables instead of “sample number + test number” values. In this case, we determined the sample numbers from the text; however, a small part of these data have missing sample or test numbers.
Element and isotope content: In some documents, only the contents of 238U, 232Th and 232Th/238U given, with no U, Th and Th/U data. In this study, data for 238U, 232Th and 232Th/238U contents were recorded under U content, Th content and Th/U, respectively, as will be explained in the general remarks below.
Isotope ratio: In the isotope ratio and error class, the isotopes in each isotope ratio are radiogenic, and the error refers to the 1σ absolute error. However, the error given in some literature was the 2σ absolute error or 1σ relative error; this was transformed to 1σ absolute error, when identified in the database. Likewise, in the age and error categories, the errors were all 1σ absolute errors, and all data having a different format were transformed. Some of the ages are negative values according to the original study; these have been retained to ensure objectivity.
Experimental method: mainly LA-ICP-MS (including multi-collector (MC) LA-ICP-MS, MC-ICP-MS, ICP-MS, and quadropole ICP-MS), SHRIMP (including SHRIMP II, SHRIMP RG instruments), and SIMS (including Cameca-SIMS), and some thermal ionization MS (TIMS) were used. Only the three most common techniques were considered herein.
Quality control: Only age calibrating, isotope ratio calibrating, and isotope fractionation calibrating standards were entered into our database. Internal standards, blind samples, and standards for detecting unknown samples were included under the general remarks in the experimental method entry.
Supplementary data: Global Positioning System (GPS) data were missing in some documents. If the latitude and longitude could be read from maps included in the document, they were estimated to a precision of 1 min and entered into the database; while if the sampling location was specific to a township, then this site was located using Google Earth and its coordinates determined.
In addition, the format of the document number was given as “Elsevier – data scientist’ initials – number” to ensure that all original documents corresponding to the geochronological data could be found. Other supplementary data were not included in our initial database.
All original documents from which data were collected were renamed. In this case, the document number was added before the original document name and stored in our electronic library to facilitate further research.
2.2. Error analysis
In zircon U-Pb geochronology, the recommended age is usually selected, based on empirical rules that samples younger than about 800 Ma usually use the 206Pb/238U age, while those older than 1200 Ma use the 207Pb/206Pb age. However, this rule of thumb is not very precise. The selection of the recommended age needs to be based on characteristics of the U-Pb isotope system, as well as other factors, such as the precision of the measurement and whether a closed isotope system should be considered. Through statistical analysis of big data, it is possible to explore age measurement error, and select the age system having the smallest error to compute the recommended age. The Elsevier Database has ages of 206Pb/238U, 207Pb/235U, 207Pb/206Pb and 208Pb/232Th, and each type of age has its own error level. To explore the influence of various age calculations and dating techniques on age error, a series of statistical analyses were carried out on the errors of various ages to obtain recommended ages for different eras. In addition, the recommended ages for different dating techniques were compared. According to the principle of isotope dating:
where D is the number of stable daughters produced by the radioactive parent, N is the current number of radioactive precursors, e is the natural logarithm constant, λ is the decay constant, and t is the age. By differentiating and simplifying Equation (1), we obtain:
From Equation (2), the amount of change dt of age t is a function of age t. In data from chronological experiments, it can be assumed that dt is the absolute error of the age value, and is the absolute error of the isotope ratio. To obtain a relationship between age and its absolute error, it is necessary to determine a calculation method for
. However, each isotope laboratory has its own error calculation method for dating, compounded by the fact that the factors affecting isotope ratio error are quite complicated. For example, in the case of the Beijing Ion Probe Laboratory (which uses SHRIMP measurements), Song (Citation2015) outlines that before the data are processed, the abnormal ion count is removed, and the ratio of the secondary ion in the sample is converted into a corresponding isotope ratio, according to the relevant ratio from a standard sample which is alternately measured with the test sample. The formula used in this process, proposed by Claoué-Long et al. (Citation1995), is as follows:
206Pb+/238U+ = a[(238U16O)+/238U+]b. (3)
In Equation (3), 206Pb+/238U+ and (238U16O)+/238U+ are the ratios of the secondary ions’ current intensity, and the value of b is usually 2.0. After calibration with 204Pb, 207Pb, or 208Pb, the isotope ratio can be converted to an age value.
Given the many influential factors contributing to error, in theory, the absolute error of the age value cannot simply be regarded as a function of age, but is a distribution function affected by age, based on the distribution of the isotope ratio. Practical experience and theoretical analysis show that measurement errors approximately obey a normal distribution. For an in-situ micro-measurement area, where both U content and Pb isotopic composition of the zircon are uniform and the instrument is stable, the data collected can be treated as normally distributed. In this case, the series of isotope ratio data obtained, also obey a certain distribution. Therefore, the expectation values of these isotope ratio data are good estimate of their true values. In the distribution of absolute age error, the same age value will correspond to a series of absolute error values. The expectation of these ages’ absolute errors is also a good estimate of the true value. Therefore, the expectation of absolute age errors could be taken as dependent variable to study the effect of age on its absolute error.
In our statistical analysis, the period 0–4600 Ma was divided into 920 age ranges with lengths of 5 Ma, and separate ages were calculated from 206Pb/238U, 207Pb/235U, 207Pb/206Pb and 208Pb/232Th values. Abnormal data for each age range were removed using the Box Plot method (Williamson, Parker, & Kendrick, Citation1989). In this method, data belonging to [Q1-1.5IQR, Q3 + 1.5IQR] are considered normal values, while data less than (Q1-1.5IQR) or greater than (Q3 + 1.5IQR) are considered abnormal, where Q1 is the lower quartile, Q3 is the upper quartile, and IQR is the interquartile range of these error data.
After abnormal data for the four types of age calculations were removed using the Box Plot method, the ages and their absolute errors were analyzed. For each age interval, an expected value for the age error in each interval was calculated and assigned its median value, yielding a series of age-error data. Next, scatter plots were drawn with the absolute error of age plotted along the vertical axis (y), and age along the horizontal axis (x). These scatter plots were fitted using various functions. The BoxLucas1 Model (Fang et al., Citation2018) was used to fit the ages derived from 206Pb/238U, 207Pb/235U, and 208Pb/232Th:
y = a(1 – e−bx). (4)
The adjusted goodness of fit was 91.66%, 70.27%, and 72.72% for these ages, respectively. In contrast, the fitting function for the 207Pb/206Pb age was a Log3P1 model (Fang et al., Citation2018), given by:
y = a – bln(x + c). (5)
Its adjusted goodness of fit was 83.75%.
It can be seen from the scatter plots and fitted curves that although abnormal points were removed using the Box Plot method, there were still a few discrete points in the remaining data. In the process of curve fitting, this study selected data having absolute residual values of the largest 10% and removed them. The remaining data were re-fitted using the same fitting functions listed above; these results are shown in and .
Table 2. Data fitting of age values and their absolute errors for various methods.
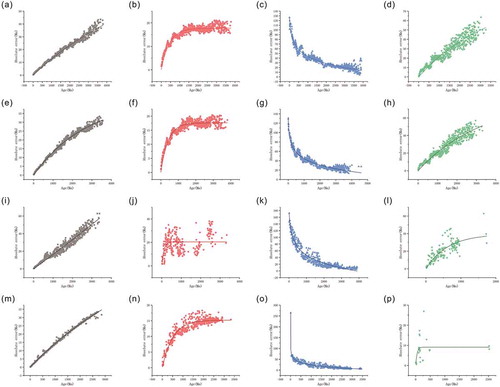
Figure 1. Scatter plots of average absolute error for various methods: (a) All methods age(206Pb/238U); (b) All methods age (207Pb/235U); (c) All methods age (207Pb/206Pb); (d) All methods age(208Pb/232Th); (e) LA-ICP-MS Age(206Pb/238U); (f) LA-ICP-MS Age (207Pb/235U); (g) LA-ICP-MS Age (207Pb/206Pb); (h) LA-ICP-MS Age (208Pb/232Th); (i) SHRIMP Age (206Pb/238U); (j) SHRIMP Age (207Pb/235U); (k) SHRIMP Age (207Pb/206Pb); (l) SHRIMP Age (208Pb/232Th); (m) SIMS Age (206Pb/238U); (n) SIMS Age (207Pb/235U); (o) SIMS Age (207Pb/206Pb); (p) SIMS Age (208Pb/232Th). Fitted curves are shown in each plot.
2.3. Selection of concordant ages
Concordant ages were evaluated from the ages derived from 206Pb/238U, 207Pb/235U, and 207Pb/206Pb methods. If the age data for a given sample point had all three age types, and these three values were consistent within a 1σ absolute error range (or the sample point had only two age types, with both values within a 1σ absolute error range), then they were considered concordant ages.
3. Results
3.1. Error analysis and recommended age
Clearly, )–(d) shows that for younger samples it is better to use the 206Pb/238U age, intermediate age samples should use the 207Pb/235U age, and older samples should use the 207Pb/206Pb age. The specific age thresholds for these ratios will be discussed in detail in section 4.2. Because the half-life of 235U decaying to 207Pb is long, the radiogenic 207Pb content of young samples is small and difficult to measure, making it better to use the 206Pb/238U age. Although older samples produce enough 207Pb, given their age, it is more difficult to fulfill the conditions of a closed system. Therefore, the 207Pb/206Pb age is more suitable for older samples.
The ages measured using all three main methods (LA-ICP-MS, SHRIMP, and SIMS) were retrieved from the Elsevier-Database and fitted to the respective functions described in section 3.1. Their scatter plots and fitted curves are shown in , while digital results are given in .
In the Elsevier Database, the geochronological data obtained by LA-ICP-MS comprise 85.63% of entries, whereas SHRIMP and SIMS contribute only 8.46% and 5.58%, respectively. Because the amount of geochronological data from LA-ICP-MS is relatively large, the average of the age error for all methods is mainly affected by LA-ICP-MS data; therefore, our fitting results for all methods were similar to those for LA-ICP-MS data only. According to the adjusted goodness of fit (R2) in , the fitting results for SHRIMP 207Pb/235U ages and SIMS 208Pb/232Th ages are not ideal. The scatter plots suggest this may be related to insufficient data.
3.2. Recommended ages for different eras
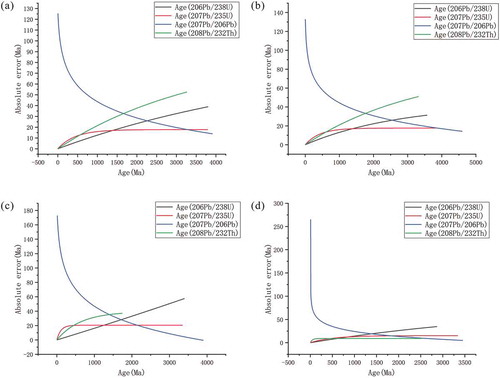
For each method, the error curves for each age type are compared. The recommended age type to use for different eras can be determined from . Using the fitting function, the specific age range for each age type can be calculated, as shown in . Except for the 208Pb/232Th age fitting curve for SIMS data, the error-age curves of different methods have very similar trends. Given that the quantity of SIMS 208Pb/232Th age data is small, the reliability of the fitted curve is relatively low; therefore, the 208Pb/232Th age is not the recommended age for the SIMS method. However, the 207Pb/235U age is the recommended age for intermediate age ranges for both LA-ICP-MS and SIMS methods, even though the quantity of SHRIMP 207Pb/235U data is small. We will continue to revise these assessments as supplementary data are added to the database, hoping to resolve issues caused by insufficient data.
Table 3. Recommended radiometric method for different age intervals.
Figure 2. Comparison of fitted curves for different radiometric ages: (a) all methods; (b) LA-ICP-MS; (c) SHRIMP; (d) SIMS.
3.3. Comparative analysis of recommended ages for different methods
Presently, single-grain zircon U-Pb geochronology is mainly determined using LA-ICP-MS, SHRIMP, and SIMS methods. To compare errors related to various methods, we compared the absolute errors of recommended ages for all three methods, with time as the horizontal axis and absolute error of the recommended age shown along the vertical axis in . We concluded that the LA-ICP-MS method is most suitable for determining isotope compositions of young samples, while SIMS is better for intermediate aged samples and SHRIMP for older samples ().
Table 4. Appropriate age intervals of different U-Pb radiometric methods for dating.
Figure 3. Comparison of minimum standard error related to the recommended radiometric age for different measurement methods.
3.4. Study of the distribution of zircon growth time
In the Elsevier Science Database, the frequencies of different ages are distinctly different. The age frequency measured in a zircon grain can reflect its growth history during geological events, such as magmatism, metamorphism, and other crustal processes.
We chose to carry out statistics on the age frequency distribution of zircon U-Pb geochronological data. First, we selected all the concordant ages from the Elsevier-Database. Using these data, we plotted a frequency-age histogram, using the frequency of the recommended ages in 5 Ma bin-sizes. In this case, the recommended age types were from data for all methods (). Using the Gaussian model, we carried out multi-peak fitting of the histogram (Guo, Citation2011). The fitting function used was:
Figure 4. Age frequency histogram and Gaussian multi-peak fitting curves showing seven main peaks for all continental Chinese U-Pb geochronology data in the Elsevier science database (peak at 835.95Ma is not decomposed in this case).
The expected values of seven main peaks were: 2505.54 Ma, 1860.65 Ma, 835.95 Ma, 444.27 Ma, 249.91 Ma, 131.49 Ma, and 48.60 Ma from oldest to youngest. Their fitting results are given in . It is clear that there are correspondences between these ages and various geological events, namely, the Wutai movement, Lvliang movement, Jinning movement, Caledonian movement, Indo-China movement, Yanshan movement, and Himalayaorogeny movement, respectively.
The peak at 835.95 Ma is actually composed of two superimposed peaks. When this peak is decomposed, and the Gaussian multi-peak fitting process is repeated, slightly different results are obtained. In this case, the expected values of the eight resulting peaks were: 2505.23 Ma, 1861.75 Ma, 869.62 Ma, 813.01 Ma, 444.13 Ma, 249.97 Ma, 131.49 Ma, and 48.71 Ma from oldest to youngest. Their fitting results are shown in and . Except for the peak at 835.95 Ma, which was resolved into two peaks, 813.01 Ma and 869.62 Ma, all other peak ages had almost the same value.
Table 5. Gaussian multi-peak fitting results of the age frequency histograms for all Chinese U-Pb geochronology data.
Figure 5. Age frequency histogram and Gaussian multi-peak fitting curves showing eight main peaks for all continental Chinese U-Pb geochronology data in the Elsevier science database (peak at 835.95Ma is decomposed into two superimposed peaks in this case).

In the same way, Gaussian multi-peak fitting was performed on all Cenozoic data (0–65 Ma), with 1 Ma as the age interval. The expected values of the six main peaks were: 61.47 Ma, 51.61 Ma, 42.70 Ma, 35.24 Ma, 27.74 Ma, and 16.55 Ma from oldest to youngest. Their specific results are shown in and .
Figure 6. Age frequency histogram and Gaussian multi-peak fitting curves for all continental Chinese Cenozoic Pb-U geochronology data in the Elsevier science database.
3.5. Study of the spatial distribution of zircon growth
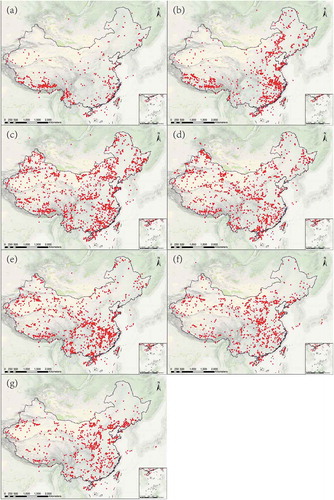
In a normal distribution, the 3σ principle states that the probability of numerical distribution within (μ−2σ, μ + 2σ) is 95.45%. When the peak of 835.95 Ma is not decomposed, the μ values of the seven peaks were: 48.60 Ma, 131.49 Ma, 249.91 Ma, 444.27 Ma, 835.95 Ma, 1860.65 Ma, and 2505.54 Ma. Their concordant ages within the interval (μ−2σ, μ + 2σ) can be projected using their GPS coordinates onto maps (). Clearly, zircons of different eras have different spatial distributions. For example, zircons yielding a peak of 48.60 Ma are mainly distributed in the Himalayas and southeast coast, those having μ = 131.49 Ma are mainly distributed on the third step of the Qinghai-Tibet Plateau and over the eastern part of China, and those having μ = 2505.54 Ma are sparsely distributed in northeast and northwest China.
Figure 7. Regional distribution of 95.45% confidence intervals for zircon peak growth ages, representing various high-frequency peaks in age. (a) 48.60 Ma;(b) 131.49 Ma;(c) 249.91 Ma;(d) 444.27 Ma; (e) 835.95 Ma; (f) 1860.65 Ma; (g) 2505.54 Ma.
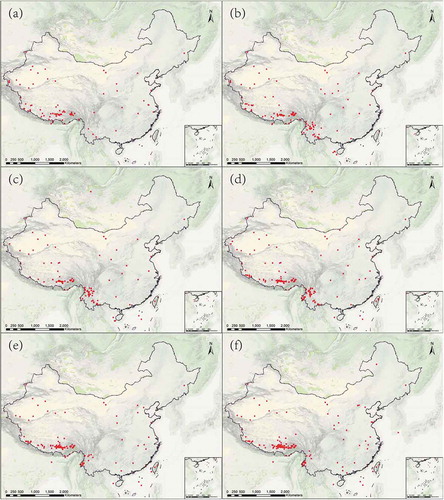
For the various μ values of the six peaks of Cenozoic age (16.55 Ma, 27.74 Ma, 35.24 Ma, 42.70 Ma, 51.61 Ma and 61.47 Ma), concordant age data within the interval (μ−2σ, μ + 2σ) of each peak were mapped to show their spatial distributions. Their GPS projections are shown in .
Figure 8. Regional distribution of 95.45% confidence intervals for zircon peak growth ages within the Cenozoic era, representing high-frequency peaks for ages: (a) 16.55 Ma; (b) 27.74 Ma; (c) 35.24 Ma; (d) 42.70 Ma; (e) 51.61 Ma; (f) 61.47 Ma.
4. Discussion
4.1. Recommended ages
At present, the 238U/235U (atomic ratio) equals 137.88 in all U-containing objects on the earth. Because U isotope fractionation has not been documented, usually only 238U is measured and the content of 235U is calculated from the 238U content. Meanwhile, the 207Pb/206Pb ratio is more than 1, so the relative error in the 207Pb/235U ratio is greater than that of 206Pb/238U. Therefore, some scholars believe that the age derived from 207Pb/235U should not be used as the recommended age. The reason why the statistical data give a more “precise” result for the 207Pb/235U age is that the relative error of the 207Pb/235U ratio is close to that of the 206Pb/238U ratio, when the U content is high. Thus, it appears that the relative error of the 207Pb/235U age is less than that of the 206Pb/238U age, although the precision of the 207Pb/235U age is better, despite Pb loss. In this case, we believe the 207Pb/206Pb age should be used, because of its better accuracy.
In real situations, the isotopic content of samples can change under the influence of geological conditions, such as within an environment where the U-Pb system is no longer closed. In this case, geochronological data can be distorted. The viewpoint that the age of 207Pb/235U should not be used as the recommended age clearly arises from the perspective of measurement technique, actual laboratory, and sample experience.
This meta-study quantitatively analyzed nearly 400,000 items of zircon U-Pb single-grain age data from the Elsevier database, collated over the past 20 years. It objectively showed characteristics of various types of geochronological data. Clearly, the ages derived from 207Pb/235U were more precise, when there was no abnormal element content in the sample. However, when dating a sample, the most appropriate recommended age calculation should be selected, based on the elemental characteristics of the sample.
4.2. Error analysis of different dating methods
Some scholars believe that different dating methods have different sampling quantities and associated errors. For example, the age errors of young samples dated by LA-ICP-MS measurements are smaller than those of SHRIMP measurements, because their sample volumes are much larger. For instance, SHRIMP measurements have an 80-min ablation depth of only 2 µ, while LA-ICP-MS measurements quickly penetrate zircon crystals to a depth of several tens of µ. In fact, each dating method has their own error characteristics related to equipment, sampling method, and sample amount. The statistical results of this study show the error levels of LA-ICP-MS, SHRIMP, and SIMS from the perspective of big data, which can provide a more objective reference.
4.3. Comparative analysis of Chinese and the Elsevier database
Researches on two databases that house single-grain zircon U-Pb geochronological data for the Chinese continental crust have almost the same results. The Chinese database incorporates data from Chinese journals and dissertations accessed through the China National Knowledge Infrastructure (CNKI). The items studied in this paper are from the Elsevier Database, containing data derived from documents in the Elsevier Science academic database, ScienceDirect. Even though the different sources, they have similar peak values of zircon growth. The expected values of the peaks derived from the Chinese database are 2505.31Ma, 1868.36Ma, 811.56Ma, 442.42Ma, 255.17Ma, and 131.71 Ma from oldest to youngest (Fang et al., Citation2018). The expected values from this research are 2505.23 Ma, 1861.75 Ma, 869.62 Ma, 813.01 Ma, 444.13 Ma, 249.97 Ma, 131.49 Ma, and 48.71 Ma, respectively. The difference is that two peaks, 48.71 Ma and 869.62 Ma, are missed in the Chinese database. Actually, peaks around 48.71 Ma and 869.62 Ma do exist in Chinese database, which are not so significant to be successfully fitted due to the deficient data to some degree.
5. Conclusions
Our study of single-grain zircon U-Pb geochronological data for the Chinese continental crust from the Elsevier Database showed:
The ages derived from 206Pb/238U, 207Pb/235U and 207Pb/206Pb were the recommended ages of zircons having ages younger than 1388.96 Ma, between 1388.96 and 3282.52Ma, and older than 3282.52 Ma, respectively. However, due to the situations of measurement technique, actual laboratory, and sample experience, it is debatable to use the age of 207Pb/235U as recommended age.
LA-ICP-MS measurements were more suitable for determining isotopic compositions of young samples having ages younger than 1002.73 Ma; while SIMS measurements were more suitable for samples with ages from 1002.73 Ma to 3242.41 Ma, and SHRIMP measurements were best for samples older than 3242.41 Ma.
The growth peaks of zircons from various areas of China were 48.60 Ma, 131.49 Ma, 249.91 Ma, 444.27 Ma, 835.95 Ma (which could be further decomposed into two superimposed peaks), 1860.65 Ma, and 2505.54 Ma, respectively. These ages corresponded to specific geological events. In more detail, the zircon growth peaks during the Cenozoic were: 16.55 Ma, 27.74 Ma, 35.24 Ma, 42.70 Ma, 51.61 Ma, and 61.47 Ma.
The growth periods of zircons from the Chinese continental crust have specific spatial distributions consistent with their geological history.
Acknowledgments
We acknowledge the financial support provided for this research from the National Key R&D Program of China [Grant 2017YFC0601203] and the National Innovation Training Program for Undergraduate Students [Grant 201810001028]. We are also grateful to the reviewers for their comments and we thank Dr Trudi Semeniuk from Edanz Editing China, for editing the English text.
Data availability statement
The data referred to in this paper is not publicly available at the current time.
Disclosure statement
No potential conflict of interest was reported by the authors.
Additional information
Funding
References
- Claoué-Long, J. C., Compston, W., Roberts, J., & Fanning, C. M. 1995. Two carboniferous ages: a comparison of shrimp zircon dating with conventional zircon ages and 40ar/39ar analysis. In W. A. Berggren, D. V. Kent, M.-P. Aubry, & J. Hardenbol (Eds.), Geochronology, time scales and global stratigraphic correlation. SEPM special publication (Vol. 54, pp. 3–21). Tulsa: Society for Sedimentary Geology.
- Fang, X. J., Wu, Y. J., Liao, S. S., Xue, L. Z., Chen, Z., Song, B., … Ji, J. Q. (2018). Preliminary analysis of the Chinese sublibrary of the Chinese crust single-grain zircon U Pb geochronology database. Acta Petrologica Sinica, 34(11), 3252–3265 (in Chinese).
- Guo, H. (2011). A simple algorithm for fitting a Gaussian function [DSP tips and tricks]. IEEE Signal Processing Magazine, 28(5), 134–137.
- Puetz Stephen, J., Ganade Carlos, E., Udo, Z., & Glenn, B. (2018). Statistical analyses of global U-Pb database 2017. Geoscience Frontiers, 9(1), 121–145.
- Song, B. (2015). SHRIMP zircon U-Pb age measurement: Sample preparation, measurement, data processing and explanation. Geological Bulletin of China, 34(10), 1777–1788 (in Chinese).
- Williamson, D. F., Parker, R. A., & Kendrick, J. S. (1989). The box plot: A simple visual method to interpret data. Annals of Internal Medicine, 110(11), 916–921.